Evolution of Lateritic Soils Geotechnical Parameters
During a Multi-Cyclic OPM Compaction and
Correlation with Road Traffic
Meissa Fall1, Déthiè Sarr1, Makhaly Ba1,Etienne Berbinau2,Jean-Louis Borel2, Mapathé Ndiaye1,Cheikh H. Kane1
1
Laboratoire de Mécanique et Modélisation, UFR Sciences de l’Ingénieur, University of Thies, Thies, Senegal 2
RAZEL sa, Christ de Sarclay, 3 rue René razel, Orsay cedex, Orsay, France E-mail: [email protected]
Received August 8, 2011; revised September 13, 2011; accepted September 22, 2011
Abstract
Gravel lateritic soils are intensively used in road geotechnical engineering. This material is largely represen-tative of engineering soil all around the tropical African Countries [1,2]. Gravel lateritic soils from parts of Burkina Faso and Senegal (West Africa) are used to determine the evolution of the geotechnical parameters from one to ten cycles of modified Proctor compaction. This test procedure is non-common for geotechnical purposes and it was found suitable and finally adopted to describe how these problematic soils behave when submitted to a multi-cyclic set of Modified Proctor compactions (OPM) [3,4]. On another hand, we propose a correlation between the traffic and the cycles of compaction considered as the repeated load. From that, this work shows the generation of active fine particles, the decrease of the CBR index and also the mechanical characteristics (mainly the Young Modulus, E) that contribute at least to the main deformation of the road structure.
Keywords:Optimum Moisture Content (OPM), Multi-Cyclic Compaction, CBR, AASHTO, Fines, Lateritic Soil, Road Structure
1. Introduction
This paper is primarily intended to demonstrate that under unpredicted traffic and repeated loading, properties of gra- vel lateritic soils used as pavement layer can significantly change. According to [5-10], gravel lateritic soils are very sensitive to an exceptional variation of stresses under wh- ich they are subjected in a pavement structural fill. Thus, it is expected that most of the physical and mechanical pro- perties of gravel lateritic soils evolves during the design life.
It is then important to find an adequate method of testing that can deal with such behavior already known in the literature. It is then necessary to perform usual char-acterization tests on these kinds of materials by studying the evolution of their main properties under traffic such as gradation, plasticity, CBR (Californian Bearing ra-tion), Los Angeles loss, Shear strength (UCT), etc.
To do this, tests are conducted so that they can simu-late multi-cyclic axial loading generated by traffic loads. The first cycle of OPM compaction (cycle 1) corresponds
to the specifications that are led to the initial design of pavement:
Compaction at the Optimum Modified Proctor (OPM) and determination of the initial CBR value of the material that will have to support traffic.
Determination during the same initial state of all physical and mechanical characteristics of materi-als, as reference values such as gradation, Atterberg limits, CBR, Los Angeles loss, Shear strength as Unconfined Compression Test characteristics (UCT), etc.
And finally, perform multi-cyclic compaction pro-cedure to determine soil characteristics at each cy-cle of compaction.
2. Test Procedure and Material Properties
60
International Road) and Senegal (in the western part of the country, as Yenne and Thiès), (sieve and hydrometer analysis, Atterberg limits, methylene blue, etc.), soils are compacted and subjected to mechanical tests at the Op- timum Modified Proctor (OPM). Theses mechanical tests are essentially CBR tests, unconfined compression test and resistance to degradation by abrasion and impact in the
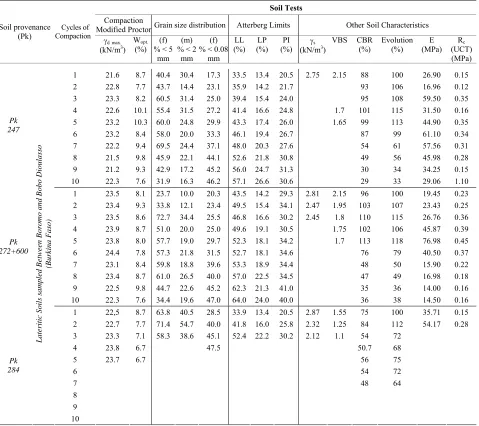
[image:2.595.64.539.207.271.2]Los Angeles machine. After the first cycle, the remaining material is used to perform exactly the same tests during the subsequent cycles (2nd, 3rd, …, 10th cycles) (Table 1). The purpose of these tests is to compare the evolution of main properties (particle size distribution, CBR, Young modulus, etc.) with repeated cycles of compaction. Tables 2(a) and (b) below summarize the overall results:
Table 1. Values of material properties at cycle 0 (raw material), (The main Lateritic Soils used in this paper are sampled from
Burkina Faso between Boromo and Bobo Dioulasso).
(fines) % < 80 m PI (%)
Pk 247 14 15
Pk 272 + 600 16 17
Pk 284 15 10
Pk 288 18 15
Pk 342 20 12
Table 2a. Summary of the test results depending on the soil provenance and the cycles of compaction.
Soil Tests
Compaction
Modified Proctor Grain size distribution Atterberg Limits Other Soil Characteristics Soil provenance
(Pk)
Cycles of Compaction
dmax.
(kN/m3)
Wopt.
(%) (f) % < 5
mm (m) % < 2
mm (f) % < 0.08
mm LL (%) LP (%) PI
(%) (kN/ms 3)
VBS CBR (%) Evolution (%) E (MPa) Rc (UCT) (MPa)
1 21.6 8.7 40.4 30.4 17.3 33.5 13.4 20.5 2.75 2.15 88 100 26.90 0.15
2 22.8 7.7 43.7 14.4 23.1 35.9 14.2 21.7 93 106 16.96 0.12
3 23.3 8.2 60.5 31.4 25.0 39.4 15.4 24.0 95 108 59.50 0.35
4 22.6 10.1 55.4 31.5 27.2 41.4 16.6 24.8 1.7 101 115 31.50 0.16
5 23.2 10.3 60.0 24.8 29.9 43.3 17.4 26.0 1.65 99 113 44.90 0.35
6 23.2 8.4 58.0 20.0 33.3 46.1 19.4 26.7 87 99 61.10 0.34
7 22.2 9.4 69.5 24.4 37.1 48.0 20.3 27.6 54 61 57.56 0.31
8 21.5 9.8 45.9 22.1 44.1 52.6 21.8 30.8 49 56 45.98 0.28
9 21.2 9.3 42.9 17.2 45.2 56.0 24.7 31.3 30 34 34.25 0.15
Pk 247
10 22.3 7.6 31.9 16.3 46.2 57.1 26.6 30.6 29 33 29.06 1.10
1 23.5 8.1 23.7 10.0 20.3 43.5 14.2 29.3 2.81 2.15 96 100 19.45 0.23
2 23.4 9.3 33.8 12.1 23.4 49.5 15.4 34.1 2.47 1.95 103 107 23.43 0.25
3 23.5 8.6 72.7 34.4 25.5 46.8 16.6 30.2 2.45 1.8 110 115 26.76 0.36
4 23.9 8.7 51.0 20.0 25.0 49.6 19.1 30.5 1.75 102 106 45.87 0.39
5 23.8 8.0 57.7 19.0 29.7 52.3 18.1 34.2 1.7 113 118 76.98 0.45
6 24.4 7.8 57.3 21.8 31.5 52.7 18.1 34.6 76 79 40.50 0.37
7 23.1 8.4 59.8 18.8 39.6 53.3 18.9 34.4 48 50 15.90 0.22
8 23.4 8.7 61.0 26.5 40.0 57.0 22.5 34.5 47 49 16.98 0.18
9 22.5 9.8 44.7 22.6 45.2 62.3 21.3 41.0 35 36 14.00 0.16
Pk 272+600
10 22.3 7.6 34.4 19.6 47.0 64.0 24.0 40.0 36 38 14.50 0.16
1 22,5 8.7 63.8 40.5 28.5 33.9 13.4 20.5 2.87 1.55 75 100 35.71 0.15
2 22.7 7.7 71.4 54.7 40.0 41.8 16.0 25.8 2.32 1.25 84 112 54.17 0.28
3 23.3 7.1 58.3 38.6 45.1 52.4 22.2 30.2 2.12 1.1 54 72
4 23.8 6.7 47.5 50.7 68
5 23.7 6.7 56 75
6 54 72
7 48 64
8
9
Pk 284
Lateritic Soils sampled Betw
een Boromo and Bobo Diou
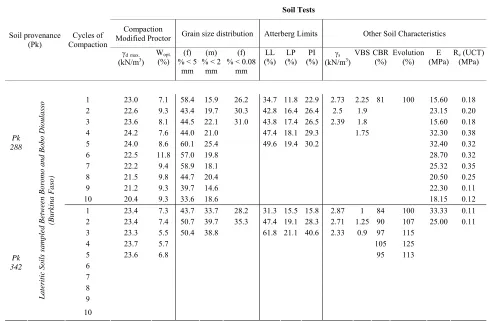
[image:2.595.62.541.294.720.2]Table 2b. Summary of the test results depending on the soil provenance and the cycles of compaction. * (Empty cells indicate insufficient quantity of materials for further testing. Multi-cyclic compaction uses a large amount of material per cycle. In this case, several samples were compacted at the same water content in order to provide enough amount of material for each cycle).
Soil Tests
Compaction
Modified Proctor Grain size distribution Atterberg Limits Other Soil Characteristics Soil provenance
(Pk) Compaction Cycles of
dmax.
(kN/m3)
Wopt.
(%) (f) % < 5
mm (m) % < 2
mm (f) % < 0.08
mm LL (%) LP (%) PI
(%) (kN/ms 3)
VBS CBR (%) Evolution (%) E (MPa)
Rc (UCT)
(MPa)
1 23.0 7.1 58.4 15.9 26.2 34.7 11.8 22.9 2.73 2.25 81 100 15.60 0.18
2 22.6 9.3 43.4 19.7 30.3 42.8 16.4 26.4 2.5 1.9 23.15 0.20
3 23.6 8.1 44.5 22.1 31.0 43.8 17.4 26.5 2.39 1.8 15.60 0.18
4 24.2 7.6 44.0 21.0 47.4 18.1 29.3 1.75 32.30 0.38
5 24.0 8.6 60.1 25.4 49.6 19.4 30.2 32.40 0.32
6 22.5 11.8 57.0 19.8 28.70 0.32
7 22.2 9.4 58.9 18.1 25.32 0.35
8 21.5 9.8 44.7 20.4 20.50 0.25
9 21.2 9.3 39.7 14.6 22.30 0.11
Pk 288
10 20.4 9.3 33.6 18.6 18.15 0.12
1 23.4 7.3 43.7 33.7 28.2 31.3 15.5 15.8 2.87 1 84 100 33.33 0.11
2 23.4 7.4 50.7 39.7 35.3 47.4 19.1 28.3 2.71 1.25 90 107 25.00 0.11
3 23.3 5.5 50.4 38.8 61.8 21.1 40.6 2.33 0.9 97 115
4 23.7 5.7 105 125
5 23.6 6.8 95 113
6 7 8 9 Pk 342
Lateritic Soils sampled Betw
een Boromo and Bobo Diou
lasso (B urkina F a so) 10
3. Interpretation of Results
3.1. Generation of Fine particles and Changing in Characteristics of Consistency
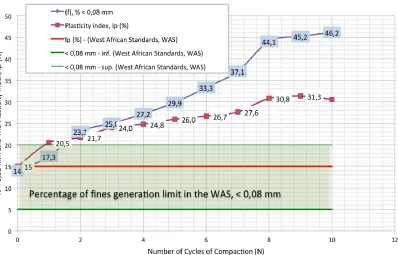
As shown by figures below, the transition between first to 10th cycles contributes to a strong generation of fine particles, as well as a gradual increase of plasticity (Fig-ure 1). The amount of fines particles (% < 80 μm) in-creases from 17% (which is the limit generally accepted for such materials) for the first cycle and reaches 46% for the 10th cycle. From the first to the 10th cycle, plastic-ity of materials also changes from 21% to 31% for the sample of Pk 247 and from 29% to 40% for the sample of Pk 272 + 600.
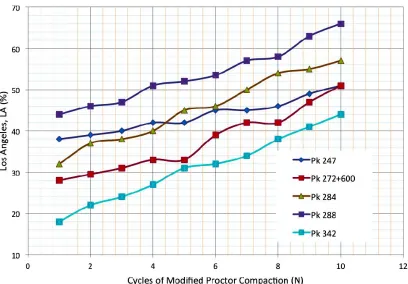
The Figure 2 gives the results of Los Angeles tests performed on gravel lateritic soils samples. The test was conducted in a particular procedure that is “unconven- tional”. In the case of the strict application of the stan-dard, the test is performed in the fraction 10/14 with a mass of test sample of 5 kg. For our purposes, we took care to fill the hollow steel cylinder with the total fraction
of the material without any selection. This procedure allows testing the total mass of the initial material with-out any selection and therefore allows completing Figure 3 showing the generation of fine particles and changes in plasticity. Since the test measures the resistance to deg-radation by abrasion and impact of the material in a ro-tating steel drum containing a specified number of steel balls, results show a strong increase of percent loss by abrasion and impact as the number of cycle increases. In this sense, both coarse and fine aggregates fragment ex-tensively during the test. This further demonstrates the problematic behavior of all gravel lateritic soils related in the literature [10].
3.2. Comparison with the Specifications in the Western African Area (West African Standards―WAS)
62
Figure 1. Evolution des fines (% < 80 m) et de la plasti-cité (PI) (Pk 272 + 600).
[image:4.595.94.502.412.696.2]Figure 3. Comparison between results (<0.08 mm et PI (%)) and specification of the WAS.
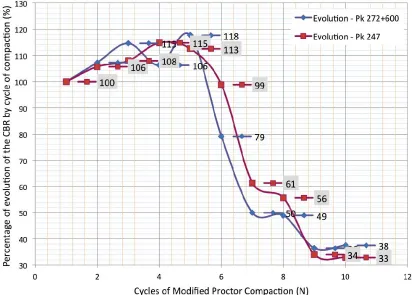
Figure 4 shows the variation of CBR values with the cycles of modified Proctor compaction. Table 3 below reminds technical recommendations contained in current textbooks approved by the CEBTP, the BCEOM and the LCPC [11] for the use of gravel lateritic soils as base courses and in the case of a T1 to T2 traffic level:
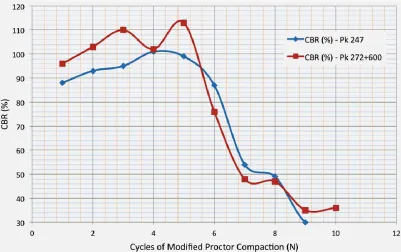
3.3. Evolution of the CBR Values
CBR is analyzed in several ways (Figure 7):
In gross value, the CBR is changing slightly for all materials up to the 5th cycle. This trend towards material stiffening is well known. Fall et al. [10] underlines that behavior and attributes it to the fact that the soil is becoming denser during the first cy cles. It gradually changes from a loose state to a dense state. Air void between coarse grains tends to be reduced and filled by fine particles generated by the breaks of the material.
The trend to the fifth cycle is to increase the CBR, which passes from a reference value of 100% and goes up to 118% or 113%. In gross value, the CBR increases from 88% to 101% and from 96 to 113%.
After the fifth cycle, the CBR begins to drop strongly and eventually reaches extremely low values such as 29% and 36% (sometimes approaching 67%) for the gravel lateritic base course.
Trends explained in figures 5 and 6 are much clearer in Figure 7 where the material stiffening is more perceptible. The stiffness increases from 0 to 5 cycles and then de-creases considerably after the fifth cycle.
Note:
[image:5.595.102.498.652.722.2]Whatever the type of correlations made on the basis of CBR, we should have, in all cases, moduli that drop sig-nificantly when the number of cycles increases. In these cases, the design of pavement base courses should lead to a significant increase in thicknesses.
Table 3. Specification for a base layer for traffic T1 – T2.
CBR4d imbibition at 95% OPM PI (%) % inf. at 80 μm (%)
CEBTP 80 <15 4 à 20
CEBTP-LCPC 80 <15 <15
64
Figure 4. Comparison of CBR values with the requirements of the WAS.
[image:6.595.90.502.407.702.2]Figure 6. Evolution CBR value with cycle of compaction.
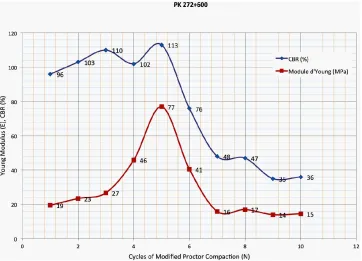
Figure 7. Evolution of the young modulus.
3.4. Evolution of Young Moduli (E: Obtained from UCT Tests)
Figure 7 give an illustration of the samples during the
66
shear strength follows the same trend as that observed with CBR values.
During the first cycles, the moduli of elasticity in-crease significantly from 17 to 61 MPa (for material of Pk 247) and from 19 to 77 MPa (for material of Pk 272). After these first cycles, moduli begin to fall significantly towards lower values. This has the same meaning as for the CBR that is soils become stiffer at the beginning of the compaction cycles and after the behavior changes completely for the last cycles. This mechanical behavior is well known in the literature and often explains the stabilization and the improvement of gravel lateritic soils with lime, cement or fly ash, for the sole purpose of in-creasing their shear strength under traffic loading without getting materials to behave as a slab.
CBR is an important parameter in pavement design if unconfined compression tests cannot be performed to get the Young’s moduli. In this case, it is often used in empiri-cal correlations to obtain static and dynamic moduli. Thus, for most tropical countries and according to textbook used as reference, the following correlations are used:
Estatic = 50 CBR (in bars),
Edynamic = 100 CBR (in bars).
Although often used, these correlations are very inac- curate but still are references today in most francophone African countries where the state of the research is still rudimentary. By using the same correlation as part of this project, we get of course the same trend as for the CBR that is an increase of modulus towards a peak value at the
first cycles and then the CBR decreases beyond. This implies that the modulus used for the initial design (E0) decreases due to increase in traffic on the road.
3.5. Conclusions
Taking into account the fact that the measured values of CBR and likewise those of the moduli decrease signifi-cantly after several cycles of compaction, we may well conclude that thickness of the pavement during its life will also differ significantly from the initial designed thickness. The immediate conclusion to this is that:
The design life of the pavement is significantly re-duced and lead to premature ruin of the structure,
Initial thicknesses should be higher if the designer was well aware of these behaviors.
4. Correlation Between Energy of
Compaction and Energy of Traffic
4.1. Energy of Compaction
The energy of compaction is given by:
C
N m g h
E
Vm
[image:8.595.118.480.442.703.2]N: number of blows; m: mass of the hammer; g: accel-eration due to gravity; h: height of drop of the hammer and Vm: volume of the Proctor or CBR mold.
4.2. Energy Due to Traffic
By analogy with the energy of compaction (Table 4), the energy of traffic can be expressed as below:
K g h
Et V
K is then defined by:
K Q TJM
Q is the standard axle load converted to kg, G is the acceleration due to gravity.
h (m) is the thickness of the pavement, V h r2 is
the volume of materials involved under the standard axle (in m3).
After simplification Et becomes:
Q TJM h
Et V
So in that relationship, the only variable is TJM and the energies of traffic are determined for TC0, TC1, TC2, TC3, TC4, TC5 (Table 5 and Figure 9).
For given values of x and y, we can directly calculate the TJM by the equation below:
10
y log y S
TJM
Q g
The corresponding energy of compaction is expressed as:
10
y log x S '
EC
Vm
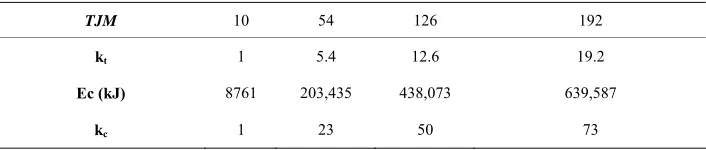
For four given values of x (x1 = 2, x2 = 5, x3 = 8, x4 = 10), we identify the values of the corresponding ordi-nates for the two energies (Et et Ec). Applying the above equations, we obtain the values of TJM and Ec given in the table below (Table 6). kt and kc are calculated; the objective is to relate them in a relationship in order to achieve the correlation.
Let:
kt(1) = 5.4, kt(2) = 12.6 et kt(3) = 19.2 progression factors of Et,
kc(1) = 23, kc(2) = 50; kc(3) = 66 progression fac-tors of the energy of compaction.
These ratios are calculated as below: 1 2 1 2
KC KC KC
Kt Kt Kt
3 3
Kc = 4kt, let
TJM0 = 10 and TJMi (i = 1, 2, 3…n)
E0 = 8 761,5
Table 4. Summary of the parameter of the curve Ec.
Cycles 1 2 3 4 5 6 7 8 9 10
N 275 550 825 1100 1375 1650 1925 2200 2475 2750
En (KJ) 2635 5276 7904 10,539 13,174 15,809 18,443 21,078 23,713 26,348
p 1 2 3 4 5 6 7 8 9 10
Table 5. Summary of the parameters for drawing the curve Et.
Classes TCi TC0 TC1 TC2 TC3 TC4 TC5
TJM (in heavy trucks) 2 14 27 68 164 342
Et (kJ) 51,908 363,354 700,754 1,764,862 4,256,431 8,876,217
[image:9.595.122.475.644.719.2]Progression factor 1 7 13.7 34 82 171
Table 6. Increase in the number of heavy load vehicles and energy of compaction.
TJM 10 54 126 192
kt 1 5.4 12.6 19.2
Ec (kJ) 8761 203,435 438,073 639,587
68
Figure 9. Curves of traffic energy and compaction energy vs progression factor.
We can write :
4 4
0 0
i
EC TJM
KC Kt .
E T
i JM
Hence,
0 0 4
i E
EC . i
TJM
TJM
In this formula, the energy is expressed in kJ. The formula reflects a geometric series with a common ratio expressed as below:
0 4
10
E q
This result allows the designer to assume the desired traffic and then deduce the corresponding energy of compaction.
4.3. Conclusions
We note well that the multi-cyclic compaction simulate exactly the effect of traffic loading. In this sense, observe that increase in traffic can be simulated by an increase in the compacting cycle. At the end of compaction, the traf-fic reaches very high level (T4 to T5).
5. Conclusions
Results show clearly that under multi-cyclic compaction, gravel lateritic soils generate fine particles, which in- crease their plasticity and drop their CBR value. Simi- larly, it is clearly shown that multi-cyclic compaction
simulates well the effect of traffic by allowing reaching its expected level, which is highest traffic level at the end of the cyclic compaction.
6. Acknowledgements
The authors would like to acknowledge again the Entre- prise Jean Lefebvre sa for their guidance and valuable input in this research project. The lateritic soils from Burkina Faso (from Boromo to Bobo Dioulasso) were collected by the help of the Entreprise Razel and sended to us by the Razel’s Team of Bamoko (Mali). By this, we thank so much all of them for their ability of making the in situ samplings as well as we desire for the laboratory’s tests. The large amount of materials used for this work has made the L2M laboratory’s technicians as busy as they never be, the authors would like to thank them for their important contributions.
7. References
[1] A. Remillon, “Les recherches Routières Entreprises en Afrique D’expression Française, Application à la Con- ception et au Renforcement des Chaussées économi- ques, ” ITBTP, 1967.
[2] M. D. Gidigasu, “Laterite Soil Engineering-Pedogenesis and Engineering Principles,” Elsevier Scientific Publish-ing Company, Amsterdam, 1976.
and Transportation Officials (AASHTO), Washington DC, 1999.
[4] T. Aashto, “Standard Method of Test for the California Bearing Ratio,” In Standard Specifications for Transpor-tation Materials and Methods of Sampling and Testing, American Association of State Highway and Transporta-tion Officials (AASHTO), Washington DC, 1993. [5] H. R. Sreekantiah, “Laterites and Lateritic Soils of West
Coast in India,” Southeast Asian Geotechnical Confer-ence, Bangkok, Vol. 1, 27 December 1987, pp. 159-170. [6] A. Sridhan, “General Report: Engineering Properties of
Tropical Soils,” International Conference on Geomechn in Tropical Soils, Singapore, 12 December 1988.
[7] G. Sweere, P. Galjaard and T. Tjong, “Engineering Be-haviour of Laterites in Road Constructions,” Interna- tional Conference on Geomechn in Tropical Soils, Sin- gapore, Vol. 1, 1988, pp. 421-427.
[8] B. A. Vallerga, et al., “Engineering Study of Laterites
and Lateritic Soils in Connection with Construction of Road, Highways and Airfields,” Country Report, AID/CSD- 1810, 1969, p. 165 and appendices.
[9] L. W. Ackroyd, “Engineering Classification of Some Western Nigerian Soils and Their Qualities in Road Building,” Road Research Laboratory, British, 1959. [10] M. Fall, “Caractérisation et Identification mé- canique de
Trois Graveleux Latéritiques du Sénégal Occidental: Application au domaine routier,” Thèse de Doctorat de l’INPL en Génie Civil et Minier de l’INPL-Nancy France, 1993, p. 277.