VOLUME 20 ISSUE 8 JANUARY 2016 ISSN 1366-5278
Automated imaging technologies for the diagnosis
of glaucoma: a comparative diagnostic study for the
evaluation of the diagnostic accuracy, performance
as triage tests and cost-effectiveness (GATE study)
Augusto Azuara-Blanco, Katie Banister, Charles Boachie, Peter McMeekin,
Joanne Gray, Jennifer Burr, Rupert Bourne, David Garway-Heath,
diagnosis of glaucoma: a comparative
diagnostic study for the evaluation of the
diagnostic accuracy, performance as triage
tests and cost-effectiveness (GATE study)
Augusto Azuara-Blanco,
1
*
Katie Banister,
2
Charles Boachie,
3
Peter McMeekin,
4
Joanne Gray,
5
Jennifer Burr,
6
Rupert Bourne,
7
David Garway-Heath,
8,9
Mark Batterbury,
10
Rodolfo Hernández,
11
Gladys McPherson,
2
Craig Ramsay
2
and Jonathan Cook
12
1
Centre for Experimental Medicine, Queen
’
s University Belfast, Belfast, UK
2
Health Services Research Unit, University of Aberdeen, Aberdeen, UK
3
Robertson Centre for Biostatistics, University of Glasgow, Glasgow, UK
4
Health Economics Group, Institute of Health and Society, Newcastle University,
Newcastle upon Tyne, UK
5
Faculty of Health and Life Sciences, Northumbria University, Newcastle upon Tyne, UK
6
School of Medicine, University of St Andrews, St Andrews, UK
7
Vision and Eye Research Unit, Postgraduate Institute, Anglia Ruskin University,
Cambridge, UK
8
National Institute of Health Research Biomedical Research Centre, Moorfields
Eye Hospital, London, UK
9
University College London Institute of Ophthalmology, London, UK
10
St Paul
’
s Eye Unit, Royal Liverpool and Broadgreen University Hospitals NHS
Trust, Liverpool, UK
11
Health Economics Research Unit, University of Aberdeen, Aberdeen, UK
12
Nuffield Department of Orthopaedics, Rheumatology and Musculoskeletal
Sciences, University of Oxford, Oxford, UK
*Corresponding author
ISSN 1366-5278 (Print)
ISSN 2046-4924 (Online)
Impact factor: 5.027
Health Technology Assessmentis indexed in MEDLINE, CINAHL, EMBASE, The Cochrane Library and the ISI Science Citation Index.
This journal is a member of and subscribes to the principles of the Committee on Publication Ethics (COPE) (www.publicationethics.org/).
Editorial contact: [email protected]
The full HTA archive is freely available to view online at www.journalslibrary.nihr.ac.uk/hta. Print-on-demand copies can be purchased from the report pages of the NIHR Journals Library website: www.journalslibrary.nihr.ac.uk
Criteria for inclusion in theHealth Technology Assessmentjournal
Reports are published inHealth Technology Assessment(HTA) if (1) they have resulted from work for the HTA programme, and (2) they are of a sufficiently high scientific quality as assessed by the reviewers and editors.
Reviews inHealth Technology Assessmentare termed‘systematic’when the account of the search appraisal and synthesis methods (to minimise biases and random errors) would, in theory, permit the replication of the review by others.
HTA programme
The HTA programme, part of the National Institute for Health Research (NIHR), was set up in 1993. It produces high-quality research information on the effectiveness, costs and broader impact of health technologies for those who use, manage and provide care in the NHS.
‘Health technologies’are broadly defined as all interventions used to promote health, prevent and treat disease, and improve rehabilitation and long-term care.
The journal is indexed in NHS Evidence via its abstracts included in MEDLINE and its Technology Assessment Reports inform National Institute for Health and Care Excellence (NICE) guidance. HTA research is also an important source of evidence for National Screening Committee (NSC) policy decisions.
For more information about the HTA programme please visit the website: http://www.nets.nihr.ac.uk/programmes/hta
This report
The research reported in this issue of the journal was funded by the HTA programme as project number 09/22/111. The contractual start date was in September 2010. The draft report began editorial review in March 2014 and was accepted for publication in November 2014. The authors have been wholly responsible for all data collection, analysis and interpretation, and for writing up their work. The HTA editors and publisher have tried to ensure the accuracy of the authors’report and would like to thank the reviewers for their constructive comments on the draft document. However, they do not accept liability for damages or losses arising from material published in this report.
This report presents independent research funded by the National Institute for Health Research (NIHR). The views and opinions expressed by authors in this publication are those of the authors and do not necessarily reflect those of the NHS, the NIHR, NETSCC, the HTA programme or the Department of Health. If there are verbatim quotations included in this publication the views and opinions expressed by the
interviewees are those of the interviewees and do not necessarily reflect those of the authors, those of the NHS, the NIHR, NETSCC, the HTA programme or the Department of Health.
© Queen’s Printer and Controller of HMSO 2016. This work was produced by Azuara-Blancoet al.under the terms of a commissioning contract issued by the Secretary of State for Health. This issue may be freely reproduced for the purposes of private research and study and extracts (or indeed, the full report) may be included in professional journals provided that suitable acknowledgement is made and the reproduction is not associated with any form of advertising. Applications for commercial reproduction should be addressed to: NIHR Journals Library, National Institute for Health Research, Evaluation, Trials and Studies Coordinating Centre, Alpha House, University of Southampton Science Park, Southampton SO16 7NS, UK.
Editor-in-Chief
NIHR Journals Library
Professor Tom Walley Director, NIHR Evaluation, Trials and Studies and Director of the HTA Programme, UK
NIHR Journals Library Editors
Professor Ken Stein Chair of HTA Editorial Board and Professor of Public Health, University of Exeter Medical School, UK
Professor Andree Le May Chair of NIHR Journals Library Editorial Group (EME, HS&DR, PGfAR, PHR journals) Dr Martin Ashton-Key Consultant in Public Health Medicine/Consultant Advisor, NETSCC, UK
Professor Matthias Beck Chair in Public Sector Management and Subject Leader (Management Group), Queen’s University Management School, Queen’s University Belfast, UK
Professor Aileen Clarke Professor of Public Health and Health Services Research, Warwick Medical School, University of Warwick, UK
Dr Tessa Crilly Director, Crystal Blue Consulting Ltd, UK Dr Peter Davidson Director of NETSCC, HTA, UK Ms Tara Lamont Scientific Advisor, NETSCC, UK
Professor Elaine McColl Director, Newcastle Clinical Trials Unit, Institute of Health and Society, Newcastle University, UK
Professor William McGuire Professor of Child Health, Hull York Medical School, University of York, UK Professor Geoffrey Meads Professor of Health Sciences Research, Health and Wellbeing Research and
Professor John Norrie Health Services Research Unit, University of Aberdeen, UK
Professor John Powell Consultant Clinical Adviser, National Institute for Health and Care Excellence (NICE), UK Professor James Raftery Professor of Health Technology Assessment, Wessex Institute, Faculty of Medicine, University of Southampton, UK
Dr Rob Riemsma Reviews Manager, Kleijnen Systematic Reviews Ltd, UK
Professor Helen Roberts Professor of Child Health Research, UCL Institute of Child Health, UK
Professor Helen Snooks Professor of Health Services Research, Institute of Life Science, College of Medicine, Swansea University, UK
Professor Jim Thornton Professor of Obstetrics and Gynaecology, Faculty of Medicine and Health Sciences, University of Nottingham, UK
Development Group, University of Winchester, UK
Centre of Evidence-Based Dermatology, University of Nottingham, UK
Abstract
Automated imaging technologies for the diagnosis of
glaucoma: a comparative diagnostic study for the evaluation
of the diagnostic accuracy, performance as triage tests and
cost-effectiveness (GATE study)
Augusto Azuara-Blanco,
1*Katie Banister,
2Charles Boachie,
3Peter McMeekin,
4Joanne Gray,
5Jennifer Burr,
6Rupert Bourne,
7David Garway-Heath,
8,9Mark Batterbury,
10Rodolfo Hernández,
11Gladys McPherson,
2Craig Ramsay
2and Jonathan Cook
121Centre for Experimental Medicine, Queen’s University Belfast, Belfast, UK 2Health Services Research Unit, University of Aberdeen, Aberdeen, UK 3Robertson Centre for Biostatistics, University of Glasgow, Glasgow, UK
4Health Economics Group, Institute of Health and Society, Newcastle University, Newcastle upon Tyne, UK
5Faculty of Health and Life Sciences, Northumbria University, Newcastle upon Tyne, UK 6School of Medicine, University of St Andrews, St Andrews, UK
7Vision and Eye Research Unit, Postgraduate Institute, Anglia Ruskin University, Cambridge, UK 8National Institute of Health Research Biomedical Research Centre, Moorfields Eye Hospital,
London, UK
9University College London Institute of Ophthalmology, London, UK
10St Paul’s Eye Unit, Royal Liverpool and Broadgreen University Hospitals NHS Trust, Liverpool, UK 11Health Economics Research Unit, University of Aberdeen, Aberdeen, UK
12Nuffield Department of Orthopaedics, Rheumatology and Musculoskeletal Sciences, University of Oxford, Oxford, UK
*Corresponding author [email protected]
Background:Many glaucoma referrals from the community to hospital eye services are unnecessary.
Imaging technologies can potentially be useful to triage this population.
Objectives:To assess the diagnostic performance and cost-effectiveness of imaging technologies as triage
tests for identifying people with glaucoma.
Design:Within-patient comparative diagnostic accuracy study. Markov economic model comparing the
cost-effectiveness of a triage test with usual care.
Setting:Secondary care.
Participants:Adults referred from the community to hospital eye services for possible glaucoma.
Main outcome measures:(1) Diagnostic performance of imaging, using data from the eye with most severe disease. (2) Composite triage test performance (imaging test, IOP measurement and visual acuity measurement), using data from both eyes, in correctly identifying clinical management decisions, that is
‘discharge’or‘do not discharge’. Outcome measures were sensitivity, specificity and incremental cost per quality-adjusted life-year (QALY).
Results:Data from 943 of 955 participants were included in the analysis. The average age was 60.5 years
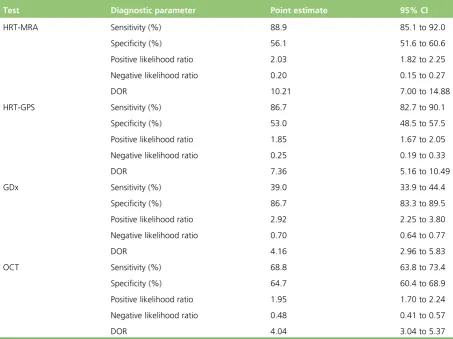
(standard deviation 13.8 years) and 51.1% were females. Glaucoma was diagnosed by the clinician in at least one eye in 16.8% of participants; 37.9% of participants were discharged after the first visit. Regarding diagnosing glaucoma, HRT-MRA had the highest sensitivity [87.0%, 95% confidence interval (CI) 80.2% to 92.1%] but the lowest specificity (63.9%, 95% CI 60.2% to 67.4%) and GDx had the lowest sensitivity (35.1%, 95% CI 27.0% to 43.8%) but the highest specificity (97.2%, 95% CI 95.6% to 98.3%). HRT-GPS had sensitivity of 81.5% (95% CI 73.9% to 87.6%) and specificity of 67.7% (95% CI 64.2% to 71.2%) and OCT had sensitivity of 76.9% (95% CI 69.2% to 83.4%) and specificity of 78.5% (95% CI 75.4% to 81.4%). Regarding triage accuracy, triage using HRT-GPS had the highest sensitivity (86.0%, 95% CI 82.8% to 88.7%) but the lowest specificity (39.1%, 95% CI 34.0% to 44.5%), GDx had the lowest sensitivity (64.7%, 95% CI 60.7% to 68.7%) but the highest specificity (53.6%, 95% CI 48.2% to 58.9%). Introducing a composite triage station into the referral pathway to identify appropriate referrals was cost-effective. All triage strategies resulted in a cost reduction compared with standard care (consultant-led diagnosis) but with an associated reduction in effectiveness. GDx was the least costly and least effective strategy. OCT and HRT-GPS were not cost-effective. Compared with GDx, the cost per QALY gained for HRT-MRA is £22,904. The cost per QALY gained with current practice is £156,985 compared with HRT-MRA. Large savings could be made by implementing HRT-MRA but some benefit to patients will be forgone. The results were sensitive to the triage costs.
Conclusions:Automated imaging can be effective to aid glaucoma diagnosis among individuals referred
from the community to hospital eye services. A model of care using a triage composite test appears to be cost-effective.
Future work:There are uncertainties about glaucoma progression under routine care and the cost of
providing health care. The acceptability of implementing a triage test needs to be explored.
Contents
List of tables xiii
List of figures xvii
List of boxes xix
List of abbreviations xxi
Plain English summary xxiii
Scientific summary xxv
Chapter 1Introduction 1
Diagnosing glaucoma 2
Comparison of glaucoma diagnostic technologies 2
Triage tests in secondary care eye services 3
Aim and research objectives 3
Aim 3
Research objectives 3
Chapter 2Methods 5
Overview of the study design 5
Participants 6
Inclusion criteria 6
Exclusion criteria 6
Setting 6
Identification of participants and recruitment process 6
Diagnostic technologies being assessed (index tests) 6
Reference standards 8
Eye level (for the diagnostic performance analysis) 8
Patient level (for the triage performance analysis) 9
Outcomes 9
Diagnostic performance of imaging technologies 9
Other outcomes 9
Diagnostic performance of a triage test (imaging test, visual acuity and intraocular
pressure measurement) 9
Delivery of interventions and data collection 10
Data management 10
Statistical analyses 11
Sample size 11
Overview of planned analyses 11
Statistical analysis methods 12
Patient and public involvement 13
Chapter 3Participant characteristics 15
Recruitment of participants 15
Baseline characteristics of participants 16
Reference standard diagnosis characteristics 18
Chapter 4Diagnostic analysis results 23
Overview 23
Default diagnosis analysis 24
Diagnostic performance of the imaging tests 24
Paired comparisons of imaging tests 26
Impact of severity of disease 28
Other outcomes 30
Diagnosis sensitivity analysis 1 31
Diagnosis sensitivity analysis 2 33
Diagnosis sensitivity analysis 3 35
Diagnosis sensitivity analysis 4 38
Diagnosis sensitivity analysis 5 40
Diagnosis sensitivity analysis 6 42
Combinations of imaging tests 44
Discussion 46
Chapter 5Triage analysis results 49
Overview 49
Default triage analysis 50
Diagnostic performance of the triage tests 50
Paired comparisons of imaging tests 52
Triage sensitivity analysis 1 54
Triage sensitivity analysis 2 56
Triage sensitivity analysis 3 58
Triage sensitivity analysis 4 61
Triage sensitivity analysis 5 63
Triage sensitivity analysis 6 65
Triage sensitivity analysis 7 67
Triage sensitivity analysis 8 69
Discussion 71
Chapter 6Economic evaluation methods 75
The model 75
Definition of health states used in the model 77 Description of the health-care diagnostic strategies and management pathways
considered within the model 78
Current practice care pathway 78
Triage care pathway 79
Model strategies 80
Estimation of parameters used within the model 80
Cohort data: prevalence, incidence and progression data 80
Test performance data 82
Base-case analysis 87
Sensitivity analysis 87
Chapter 7Economic evaluation results 89
Base-case analysis 89
Sensitivity analyses 90
Changes to the annual probability of having an eye test 90
Changes in the costs of the triage strategies 92
Changes to the start age of the cohort 93
Changes to the patients treated: not treating patients‘at risk’ 94
Changes to the sensitivity and specificity of the clinician 94
Changes in the costs of the triage strategies and not treating patients‘at risk’ 96
Changes to the diagnostic performance of the imaging technologies 96
Changes to the prevalence of glaucoma and‘at-risk’groups in the referred population 98
Changes to the quality of life for the‘at risk’health state 98
Summary and discussion 99
Chapter 8Discussion 103
Strengths and limitations 104
Uncertainties 105
Chapter 9Conclusions 107
Implications for health care 107
Recommendations for research 107
Acknowledgements 109
References 111
Appendix 1Information for patients 115
Appendix 2GATE study case report forms 121
Appendix 3Example imaging report outputs from the four imaging tests 131
Appendix 4Imaging standard operating procedures for the GATE study 135
Appendix 5Further assessment of threshold effects under diagnosis analysis
using individual parameters from the imaging tests 151
Appendix 6Additional triage analysis to inform the health economic model 155
List of tables
TABLE 1 Clinical diagnosis definitions 8
TABLE 2 Characteristics of non-participants 15
TABLE 3 Centre recruitment 16
TABLE 4 Baseline demographics of included participants 17
TABLE 5 Ocular characteristics of participants at referral 17
TABLE 6 Data from HES examination: VF and IOP 18
TABLE 7 Data from HES examination: IOP and MD by diagnosis 19
TABLE 8 Data from HES examination: diagnosis 19
TABLE 9 Data from HES examination: comorbidity 20
TABLE 10 Data from HES examination: glaucoma severity 20
TABLE 11 Data from HES examination: action after first consultation 20
TABLE 12 Data from HES examination: diagnosis by worse eye and better eye 21
TABLE 13 Data from HES examination: severity of disease by worse and better
eye for those diagnosed with glaucoma 21
TABLE 14 Data from HES examination: glaucoma mechanism for those
diagnosed with glaucoma or glaucoma suspect, by worse and better eye 22
TABLE 15 Diagnosis analyses 23
TABLE 16 Diagnostic performance: default diagnosis analysis 26
TABLE 17 Paired comparisons of sensitivity and specificity between the imaging tests 27
TABLE 18 Diagnostic performance: default diagnosis analysis (reference standard
definition of disease of moderate and severe glaucoma) 28
TABLE 19 Diagnostic performance: default diagnosis analysis (reference standard
definition of disease of severe glaucoma) 29
TABLE 20 Classification and quality of imaging results (default analysis) 30
TABLE 24 Diagnostic performance: diagnosis sensitivity analysis 3 37
TABLE 25 Diagnostic performance: diagnosis sensitivity analysis 4 40
TABLE 26 Diagnostic performance: diagnosis sensitivity analysis 5 42
TABLE 27 Diagnostic performance: diagnosis sensitivity analysis 6 44
TABLE 28 Diagnostic performance: diagnostic performance of test combinations 46
TABLE 29 Triage analyses 49
TABLE 30 Diagnostic performance: default triage analysis 52
TABLE 31 Paired comparisons of sensitivity and specificity between the triage tests 53
TABLE 32 Diagnostic performance: triage sensitivity analysis 1 56
TABLE 33 Diagnostic performance: triage sensitivity analysis 2 58
TABLE 34 Diagnostic performance: triage sensitivity analysis 3 60
TABLE 35 Diagnostic performance: triage sensitivity analysis 4 63
TABLE 36 Diagnostic performance: triage sensitivity analysis 5 65
TABLE 37 Diagnostic performance: triage sensitivity analysis 6 67
TABLE 38 Diagnostic performance: triage sensitivity analysis 7 69
TABLE 39 Diagnostic performance: triage sensitivity analysis 8 71
TABLE 40 Definition of health states for the economic evaluation 77
TABLE 41 Diagnostic strategies and associated care pathways 81
TABLE 42 Cohort data: prevalence, incidence and progression 82
TABLE 43 Accuracy parameters of the triage test used in the model 83
TABLE 44 Costs of current practice diagnosis used in the model 84
TABLE 45 Costs of triage strategies used in the model 84
TABLE 46 Annual cost of treatment 84
TABLE 50 Incremental cost-effectiveness ratios for the cohort of 40-year-old
males by varying annual probabilities of having a community optometrist eye test 91
TABLE 51 Incremental cost-effectiveness ratios for an increase to the unit costs
of the triage strategies 93
TABLE 52 Incremental cost-effectiveness ratios for changes in the age of the
cohort at referral 93
TABLE 53 Incremental cost-effectiveness for treating glaucoma patients only and
discharging those‘at risk’ 94
TABLE 54 Incremental cost-effectiveness ratios for changes in sensitivity of clinicians 95
TABLE 55 Incremental cost-effectiveness ratios for changes in specificity of clinicians 95
TABLE 56 Incremental cost-effectiveness ratios for exploring triage performance
best- and worst-case scenarios 97
TABLE 57 Incremental cost-effectiveness ratios of increasing the prevalence of
glaucoma and‘at-risk’groups in the referred population 98
TABLE 58 Incremental cost-effectiveness ratios of changing the quality of life for
the‘at-risk’health state 99
TABLE 59 Area under the ROC curve using imaging test parameters for a
diagnosis of glaucoma in the worse eye 154
TABLE 60 Additional analyses carried out to inform the health economic model 155
TABLE 61 Triage sensitivity analysis 9 157
TABLE 62 Triage sensitivity analysis 10 159
TABLE 63 Incremental cost-effectiveness for the base case with different NHS
Reference Costs applied to the triage strategies 161
TABLE 64 Incremental cost-effectiveness ratios of increasing costs of triage
List of figures
FIGURE 1 Overview of study design 5
FIGURE 2 Diagram showing recruitment to the study 16
FIGURE 3 Flow diagram: default diagnostic analysis 25
FIGURE 4 Flow diagram: diagnostic sensitivity analysis 1 32
FIGURE 5 Flow diagram: diagnostic sensitivity analysis 2 34
FIGURE 6 Flow diagram: diagnostic sensitivity analysis 3 36
FIGURE 7 Flow diagram: diagnostic sensitivity analysis 4 39
FIGURE 8 Flow diagram: diagnostic sensitivity analysis 5 41
FIGURE 9 Flow diagram: diagnostic sensitivity analysis 6 43
FIGURE 10 Flow diagram: combination of imaging tests 45
FIGURE 11 Summary of the sensitivity of imaging tests across all diagnosis analyses 47
FIGURE 12 Summary of the specificity of imaging tests across all diagnosis analyses 47
FIGURE 13 Flow diagram: default triage analysis 51
FIGURE 14 Flow diagram: triage sensitivity analysis 1 55
FIGURE 15 Flow diagram: triage sensitivity analysis 2 57
FIGURE 16 Flow diagram: triage sensitivity analysis 3 59
FIGURE 17 Flow diagram: triage sensitivity analysis 4 62
FIGURE 18 Flow diagram: triage sensitivity analysis 5 64
FIGURE 19 Flow diagram: triage sensitivity analysis 6 66
FIGURE 20 Flow diagram: triage sensitivity analysis 7 68
FIGURE 21 Flow diagram: triage sensitivity analysis 8 70
FIGURE 22 Summary of the sensitivity of the composite test across all triage analyses 72
FIGURE 26 Care pathway: triage strategies 79
FIGURE 27 Base-case cost-effectiveness analysis results 90
FIGURE 28 Receiver operating characteristic curve for HRT-MRA parameters 151
FIGURE 29 Receiver operating characteristic curve for HRT-GPS parameters 152
FIGURE 30 Receiver operating characteristic curve for GDx parameters 152
FIGURE 31 Receiver operating characteristic curve for OCT parameters 153
FIGURE 32 Flow diagram: triage sensitivity analysis 9 156
List of boxes
List of abbreviations
AUC area under the curve
CI confidence interval
DOR diagnostic odds ratio
ECC Enhanced Corneal Compensation
EQ-5D European Quality of Life-5 Dimensions
GAT Goldmann applanation tonometry
GATE Glaucoma Automated Tests
Evaluation
GDx glaucoma diagnostics
GPS glaucoma probability score
HRT Heidelberg Retinal Tomography
HRT-GPS Heidelberg Retinal Tomography glaucoma probability score
HRT-MRA Heidelberg Retinal Tomography Moorfields regression analysis
ICER incremental cost-effectiveness ratio
IOP intraocular pressure
MD mean deviation
MRA Moorfields regression analysis
NFI nerve fibre indicator
NICE National Institute for Health and Care Excellence
OAG open-angle glaucoma
OCT optical coherence tomography
OHT ocular hypertension
PAC primary angle closure
PSD pattern standard deviation
QALY quality-adjusted life-year
RNFL retinal nerve fibre layer
ROC receiver operating characteristic
SD standard deviation
SD-OCT spectral domain optical coherence tomography
STARD standards for the reporting of diagnostic accuracy studies
TSC Trial Steering Committee
TSNIT temporal, superior, nasal, inferior, temporal
VA visual acuity
Plain English summary
G
laucoma is a lifelong eye disease. Treatment is usually effective to slow the progression of glaucoma. About 4000 people are registered with sight impairment each year because of glaucoma. Many healthy subjects are unnecessarily referred from the community to hospital eye services to rule out glaucoma.New imaging tests that investigate the back of the eye can aid in the diagnosis of glaucoma and are safe and easy to perform. These technologies measure with high accuracy the tissues in the back of the eye that are typically thinned in glaucoma. This study was designed to evaluate the performance of four imaging tests at identifying, among patients referred to hospital, those who have glaucoma or are at risk and those who do not have any eye disease. We compared the imaging test results with an experienced eye doctor’s diagnosis. We also evaluated how well a possible care pathway would perform using imaging results combined with measurements of the eye pressure and vision, to identify whether or not the individual needed to see an eye doctor.
Scientific summary
Background
Glaucoma describes a group of chronic age-related eye diseases in which there is progressive damage of the optic disc and characteristic visual field loss. Glaucoma is a significant public health problem, as it is the second leading cause of blindness in the UK.
Glaucoma care constitutes a major proportion of the workload of the hospital eye service. In England there are over 1 million glaucoma-related outpatient visits to the acute sector annually. Considerable NHS resources are required to assess referrals to hospital eye services for possible glaucoma, which are typically initiated by community optometrists. However, fewer than one-quarter of referrals are found to have glaucoma, and nearly half of the referred individuals are discharged after their first visit. If referrals could be triaged in a clinically effective and cost-effective manner, resources could be better utilised for other needs.
Glaucoma is diagnosed by clinicians detecting structural changes of the optic nerve head, also known as the optic disc, and corresponding visual field defects. New imaging techniques for assessment of the structural changes have emerged: scanning laser ophthalmoscopy, commercially available as the
Heidelberg Retinal Tomograph [HRT; including two diagnostic algorithms, Moorfields regression analysis (HRT-MRA; Heidelberg Engineering, Heidelberg, Germany) and glaucoma probability score (HRT-GPS; Heidelberg Engineering, Heidelberg, Germany)] and scanning laser polarimetry, commercially available as glaucoma diagnostics (GDx; Carl Zeiss Meditec, Dublin, CA, USA) and spectral domain optical coherence tomography (SD-OCT; Heidelberg Engineering, Heildelberg, Germany), with several commercial
devices available.
Imaging technologies are being introduced into glaucoma services but their role in the diagnostic pathway is unclear. Imaging tests are user-friendly and safe, provide automated classifications and potentially could reduce the need for an examination by a clinician.
Aim
To assess the relative performance and cost-effectiveness of diagnostic imaging technologies as triage tests in secondary care for identifying people with glaucoma.
Objectives
Primary objective
To compare the diagnostic performance (in terms of sensitivity and specificity) in a cohort of patients referred to hospital eye services with possible glaucoma, of:
l four imaging tests [HRT-MRA, HRT-GPS, GDx and optical coherence tomography (OCT)] for diagnosis of glaucoma
Secondary objectives
l To explore alternative thresholds for determining abnormal tests.
l To evaluate the diagnostic performance of combinations of imaging tests.
l To evaluate the performance of the tests across the spectrum of glaucoma (mild, moderate and severe).
l To evaluate the cost-effectiveness of incorporating imaging in a triage test in hospital eye services compared with current practice of diagnostic examination by a clinician.
l To evaluate patient preferences related to different imaging technologies.
Methods
We designed a pragmatic within-patient comparative diagnostic and triage evaluation of imaging
techniques for glaucoma. Participants were adult patients referred from community optometrists or general practitioners with any possible glaucoma-related findings. Five UK NHS centres participated: three
academic centres and two district general hospitals.
Participants received all imaging tests: HRT-GPS, HRT-MRA, GDx and OCT. Possible tests results were within normal limits, borderline or outside normal limits.
The HRT uses confocal laser scanning to allow quantitative structural measurement of the optic disc anatomy. There are two main classification tools to relate measurements to normative data: (1) HRT-MRA, which requires user definition of the optic disc boundary, and (2) HRT-GPS, which is fully automated.
The GDx scanning laser polarimeter measures the retinal nerve fibre layer (RNFL) thickness surrounding the optic disc utilising the birefringent properties of the RNFL. The software provides a discriminating classifier termed the nerve fibre indicator, which is fully automated.
Spectral domain OCT is an optical imaging technique providing high-resolution, cross-sectional imaging of the retina analogous to B-scan ultrasonography but using light instead of sound. The Spectralis®optical coherence tomograph (Heidelberg Engineering, Heidelberg, Germany) was used in this study.
The reference standard was a full clinical examination, including visual field testing, by a consultant ophthalmologist with glaucoma expertise to determine (1) a diagnosis of glaucoma (mild, moderate or severe) according to well-defined criteria (diagnosis analysis) and (2) whether or not the patient would be discharged or should be monitored/treated within hospital eye services (triage analysis).
Statistical analysis
Sample size calculations were based on standard diagnostic accuracy study methods. A 5% significance level based on a two-sided test was used, which required a study of 897 individuals to have 90% power to detect an accuracy difference of 9% for the primary outcome of glaucoma diagnosis. Including a 6% indeterminacy rate increased the sample size to 954.
Primary diagnostic performance outcomes were the sensitivity and specificity of tests. Secondary diagnostic performance outcomes were likelihood ratio and diagnostic odds ratio (DOR). The proportions of
indeterminate test results, low-quality imaging and need for pupil dilatation were measured and patient preference for the tests was ranked. The test performance was assessed with respect to the glaucoma spectrum (mild, moderate and severe), when including glaucoma suspects in the reference standard diagnosis, and when including‘borderline’results as abnormal. The diagnostic performance of combinations of tests was also evaluated.
Economic analysis
A current practice pathway model was developed whereby patients referred to hospital eye services were seen by a nurse for VA assessment, a technician for visual field measurement and by a clinician.
In an alternative triage care pathway model, individuals were seen by a nurse for VA examination and IOP measurement and a technician for imaging assessment. The triage test results classified patients as needing referral for clinician diagnosis or as discharged. Those referred were seen by a technician for visual field measurement and examined by a clinician.
The cost-effectiveness of four triage pathways, each using IOP, VA and one of the four imaging technologies (which varied by their diagnostic ability and capital cost), and their subsequent care management pathways was assessed using a multistate Markov model compared with current practice.
The cohort started in one of six health states: normal; at risk of glaucoma; mild glaucoma; moderate glaucoma; severe glaucoma; or sight-impaired. The sensitivity and specificity of each triage strategy determined if diagnosis was correct and, depending on this, the health state that patients would move to and the associated progression of any underlying glaucoma.
Modelled care pathways were developed in consultation with the study team and the independent steering committee and used our previous models in this area and reviewed guidelines, study data and expert opinion.
Consequences were considered in terms of monetary costs (of testing and subsequent management of the patient’s condition) to the NHS and in terms of the effects on quality of life (by assigning utility weights). Combining these data with the probabilities of events occurring over time enabled costs, patient outcomes and quality-adjusted life-years (QALYs) to be estimated for a hypothetical cohort of patients undergoing each modelled strategy.
Model results were analysed as incremental cost per QALY and incorporated (1) costs (of testing) and triage diagnostic outcomes, (2) costs (of testing and subsequent management) and (3) QALYs. The base-case analysis used a cohort of 40-year-old males using prevalence data from the Glaucoma Automated Tests Evaluation (GATE) study and for a 50-year time horizon. Cycle length was 1 year. The results were presented in incremental cost-effectiveness ratios (ICERs).
Results
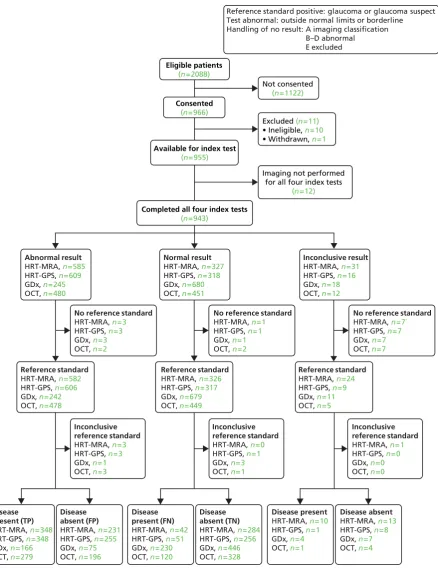
Between April 2011 and July 2013, 2088 participants were identified as potentially eligible: 2013 were invited to take part. Of those invited, 966 (48%) agreed to take part. Following consent, 11 participants were found to be ineligible and did not participate and 12 were excluded as they did not receive all four imaging tests. Therefore, 943 participants were available for the comparisons of tests.
The average age of participants was 60.5 years [standard deviation (SD) 13.8 years] and 51.1% were female. Non-participants had similar age and sex balance. Most participants (89.2%) were of‘white British’ ethnicity. The average IOP at referral was 20 mmHg. The most common diagnosis was‘no glaucoma-related findings’(31.7% of participants). Comorbidities were uncommon, except for cataract, which was reported in 8.3% of right eyes and 7.4% of left eyes. Glaucoma was diagnosed in at least one eye in 16.8% of the GATE cohort and 6.5% had glaucoma in both eyes at referral. Overall, 37.9% of GATE participants were discharged after the first visit.
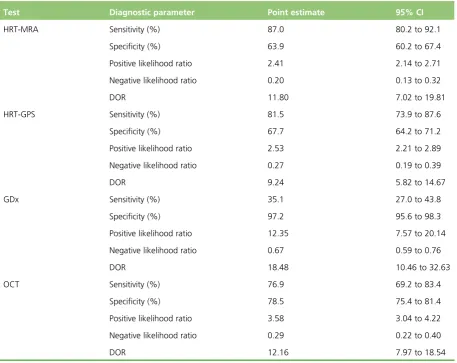
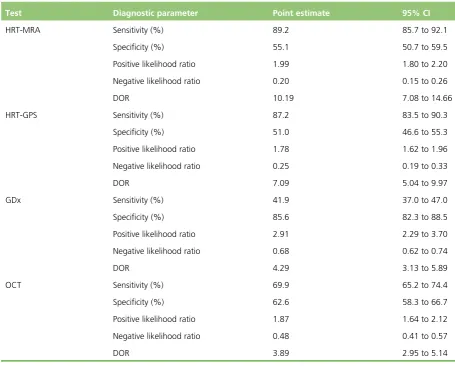
Performance of the imaging tests in diagnosing glaucoma differed. HRT-MRA had the highest sensitivity [87.0%, 95% confidence interval (CI) 80.2% to 92.1%] but the lowest specificity (63.9%, 95% CI 60.2% to 67.4%), GDx had the lowest sensitivity (35.1%, 95% CI 27.0% to 43.8%) but the highest specificity (97.2%, 95% CI 95.6% to 98.3%) and the other two tests provided intermediate results (HRT-GPS sensitivity 81.5%, 95% CI 73.9% to 87.6% and specificity 67.7%, 95% CI 64.2% to 71.2%; OCT sensitivity 76.9%, 95% CI 69.2% to 83.4% and specificity 78.5%, 95% CI 75.4% to 81.4%).
Likelihood ratios showed evidence of being able to both rule in and rule out the presence of glaucoma for all four imaging tests (95% CIs did not contain 1.0). DORs ranged from 9.24 for HRT-GPS to 18.48 for GDx.
When including borderline imaging results as an abnormal test, the sensitivity increased but with a corresponding decrease in specificity. In this sensitivity analysis, HRT-MRA had the highest sensitivity (94.9%, 95% CI 89.8% to 97.9%) but the second lowest specificity (43.9%, 95% CI 40.2% to 47.6%), GDx had the lowest sensitivity (60.4%, 95% CI 51.6% to 68.8%) but the highest specificity (82.8%, 95% CI 79.8% to 85.5%) and the other two tests provided intermediate results.
The impact of combining two imaging tests was improved detection of glaucoma but the effect was marginal and smaller than the loss of specificity.
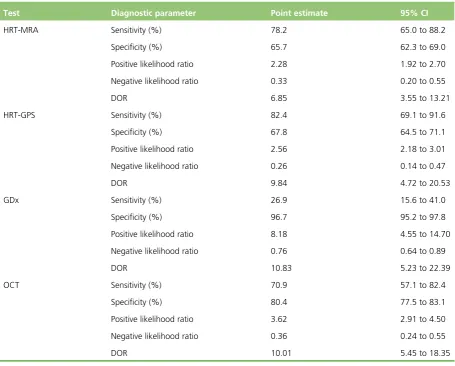
When considering participants with severe glaucoma, according to our definition of disease stage, OCT had the highest sensitivity (95.2%, 95% CI 76.2% to 99.9%) and the second highest specificity (70.9%, 95% CI 67.7% to 73.9%), GDx had the lowest sensitivity (78.9%, 95% CI 54.4% to 93.9%) but the highest specificity (93.7%, 95% CI 91.8% to 95.2%) and the other two tests provided intermediate results.
Participant preference for type of imaging test was collected for 890 participants (94%). Almost half of responders (48.2%) had no preference. Of those participants who expressed a preference, OCT was ranked as most preferred (27.6%), followed by GDx (11.9%) and HRT (5.1%). Average time taken to perform the test varied from 5.2 minutes (SD 3.0 minutes) for OCT to 7.6 minutes (SD 5.0 minutes) for HRT.
Economic analysis results
All triage strategies were more cost-effective than current practice but resulted in reduced health because of missing cases (i.e. fewer expected QALYs). The base-case results suggest that, of the triage pathways modelled, a triage including IOP, VA and HRT-MRA is the most cost-effective strategy. Triage including GDx was shown to be the least costly and least effective. Triage including OCT and HRT-GPS were not cost-effective. Compared with GDx, the cost per QALY gained for HRT-MRA was £22,904. The cost per QALY gained with current practice was £156,985 compared with HRT-MRA. Large savings could be made by implementing HRT-MRA but some benefit to patients would be forgone.
These results should be interpreted with some caution, particularly in terms of differences among triage strategies, since the diagnostic accuracy of all tests (except GDx) and their unit costs are very similar. The incremental cost-effectiveness of the triage strategies compared with current practice is very sensitive to the costs included in the model. Indeed, current practice becomes cost-effective when the total cost of a triage test increases to £30 and above. A key assumption used in the model was that clinicians are 100% accurate in their diagnostic ability. Relaxing this assumption increased further the ICER (favouring triage strategies).
Conclusions
Implications for health care
Imaging technologies can be effective to aid the diagnosis of glaucoma. An alternative pathway for patients referred from community to hospital eye services with possible glaucoma, using a triage test that includes imaging, IOP and VA, appears to be cost-effective compared with current practice. Our findings are based on a relatively inexpensive composite triage test (<£30). The most cost-effective strategy would include HRT-MRA imaging. However, triaging would be associated with a loss of health, and the
acceptability of this option among users and clinicians has not been evaluated.
Recommendations for research
l Determine the acceptability to patients and health-care providers of implementing an efficient triage glaucoma diagnostic triage system but with reduced health.
l Obtain data on glaucoma disease progression, specifically including patients classified as having glaucoma suspects and ocular hypertension, associated utility, and cost of providing health care. l Investigate varying the results of the imaging tests beyond the standard options, since the
recommended classification may not be the one best suited to the population from which GATE recruited.
l Examine the effectiveness of implementation of a composite triage test.
Funding
Chapter 1
Introduction
G
laucoma describes a group of eye diseases in which there is progressive damage of the optic nerve. It is characterised by a specific pattern of optic nerve head and visual field loss leading to impaired vision and sometimes blindness if inadequately treated. Primary glaucoma can be classified as open-angle glaucoma (OAG) or angle-closure glaucoma, the former being the more common.1Glaucoma is a significant public health problem, second only to macular degeneration as the most common cause of blindness in the UK,2–4 and is the leading cause of irreversible blindness worldwide.5The impact on patients is considerable, with the risks of moderate visual field loss (which affects the ability to drive) and long-term blindness reported as the most important consequences.6Late detection is a major risk factor for glaucoma blindness.7However, if glaucoma is identified in the early stages, treatment is effective at reducing the progress of the disease.8A a number of factors increase the risk of developing glaucoma, including elevated intraocular pressure (IOP), older age, ethnic background and family history of glaucoma. Of these, the level of IOP is the most important risk factor and is the only one which is treatable. Ocular hypertension (OHT), generally defined as an IOP of≥21 mmHg [2 standard deviations (SDs) above the mean], used to be considered as a part of the definition of glaucoma, but population studies have consistently found that many people with glaucoma have an IOP below this level.9–13However, the risk of developing glaucoma, and of worsening of existing disease, increases with increasing IOP.14–16This is supported by the fact that those presenting with advanced glaucoma at diagnosis are more likely to have higher IOP.12,17
The estimated prevalence of glaucoma in the UK is over 1% of the population over 40 years of age.18–21 Approximately 4000 new cases of severe sight impairment due to glaucoma are registered every year in the UK. Many more glaucoma patients have sight impairment not severe enough to be registered but with significant impact on their quality of life (e.g. loss of driving licence). In England and Wales, in 2007, there were over 5 million outpatient attendances at hospital eye services (around 10% of all annual outpatient attendances) in the NHS. Of these, approximately 1,400,000 were new patients (costing over £140M). As the population ages, these numbers are likely to increase.22
Estimates based on official population projections and epidemiological prevalence surveys have predicted that the number of glaucoma cases in England and Wales will increase by one-third by 2021 and continue to increase at a similar pace until 2031.23
Diagnosing glaucoma
Glaucoma is diagnosed primarily by detecting glaucomatous optic neuropathy (i.e. characteristic changes of the optic nerve head–the optic disc) and a compatible visual field defect. According to current National Institute for Health and Care Excellence (NICE) guidelines,26a definitive glaucoma diagnosis is based on the expertise of a clinician who subjectively interprets the appearance of the optic disc and the results of visual field testing. In addition to diagnosing glaucoma, the clinical examination will include a visual acuity (VA) test (to measure central vision), anterior chamber angle examination (to determine the mechanism of glaucoma, e.g. open-angle or angle-closure), and IOP measurement (which is a risk factor for glaucoma and also for disease progression).
Accurate clinical diagnosis of glaucoma is limited by subjectivity, reliance on the examiner’s experience and a wide variation of optic disc structure in the population. Imaging techniques for assessment of the structural changes at the optic nerve head and retinal nerve fibre layer (RNFL) have emerged and are in routine use in the NHS: Heidelberg Retinal Tomography (HRT)-III, scanning laser polarimetry [glaucoma diagnostics (GDx; Carl Zeiss Meditec, Dublin CA, USA)] and spectral domain optical coherence tomography (SD-OCT; Heidelberg Engineering, Heidelberg, Germany). These techniques can be easily performed by trained technicians and provide an automatic glaucoma classification index. Some clinicians now routinely incorporate the information from such imaging technologies to help make a diagnosis of glaucoma, although there is no strong evidence of their effectiveness.
Using an automated imaging quantitative test for glaucoma diagnosis may have advantages over visual field testing in that the majority of people can be imaged.18
Comparison of glaucoma diagnostic technologies
In 1997, the Health Technology Assessment (HTA) programme funded a study entitled‘The effectiveness of the Heidelberg Retina Tomograph and laser diagnostic glaucoma scanning system (GDx) in detecting and monitoring glaucoma’.30At the time, this study was the largest and most rigorous head-to-head comparison of tests for diagnosing glaucoma. However, this study used the first prototypes of the HRT and GDx, now outdated. Another serious limitation was the small study sample (250 participants), in addition to a potentially biased selection of patients, as they were not consecutively selected.
A systematic review of the performance of technologies for detecting glaucoma as both screening and diagnostic tests for glaucoma identified that the evidence is of poor quality and that no one test was clearly superior.18In this systematic review it was also found that populations studied were varied and biased. Furthermore, only six studies performed a direct comparison of the available diagnostic instruments (and including, on average, fewer than 300 patients), the threshold for definitions of glaucoma cases was not consistent and there were no studies reporting on the performance of GDx and optical coherence tomography (OCT) that met the inclusion criteria for this systematic review. However, the review did suggest that some diagnostic technologies perform better than others (e.g. HRT performed relatively well), but the credible intervals around the estimates were wide, reflecting considerable uncertainty, and, therefore, it recommended that the available diagnostic tests be evaluated in an appropriately powered directly comparative study.
In the published NICE guideline,26the authors searched for evidence comparing the diagnostic
Triage tests in secondary care eye services
Considerable NHS resources are required to assess all patients referred to hospital eye services with glaucoma suspect. In June 2009, the chairman published on behalf of the Professional Standards
Committee of the Royal College of Ophthalmology a statement that the interpretation of NICE glaucoma guidelines was putting considerable strain onto secondary care eye services through the increase in
false-positive referrals from community optometrists. The statement proposed that eye departments should consider innovative and efficient clinics for the initial assessment of patients.31
If referrals could be triaged to identify suitable referrals and discharge unsuitable referrals in an effective and cost-effective manner, the resources could be better utilised for patient eye care services. Imaging technologies are being introduced into glaucoma services in both hospital and community settings, but their role in the diagnostic pathway as triage, replacement or add-on tests has not been evaluated. The tests to be evaluated in this study are the currently available imaging technologies with characteristics that suggest that they could be valuable triage tests and that are in current use in the NHS. They do not require patient input, are user-friendly,32provide automated quantitative classifications and potentially could reduce the need for an extensive examination by an expert glaucoma clinician. The diagnostic performance of these imaging technologies has not been evaluated in a triage setting and in a robust manner.
Aim and research objectives
Aim
To assess the relative performance and the cost-effectiveness of new diagnostic imaging technologies, as triage tests in secondary care, for identifying people with glaucoma.
Research objectives
Primary objective
To compare the performance of imaging technologies [HRT Moorfields regression analysis (HRT-MRA; Heidelberg Engineering, Heidelberg, Germany), HRT glaucoma probability score (HRT-GPS; Heidelberg Engineering, Heidelberg, Germany), GDx and OCT] as diagnostic and triage tests for patients referred to hospital eye services with possible glaucoma. Triage tests include an imaging technology, VA and IOP.
Secondary objectives
(a) To explore alternative thresholds for determining test positivity.
(b) To evaluate the diagnostic performance of combinations of the imaging tests.
(c) To evaluate the performance of the tests across the spectrum of glaucoma (mild, moderate and severe).
Chapter 2
Methods
T
his chapter describes the Glaucoma Automated Tests Evaluation (GATE) study design and methods for the diagnostic performance evaluation, and follows the standards for the reporting of diagnostic accuracy studies (STARD).33The methods for the health-economic evaluation are described separately (seeChapter 6).Overview of the study design
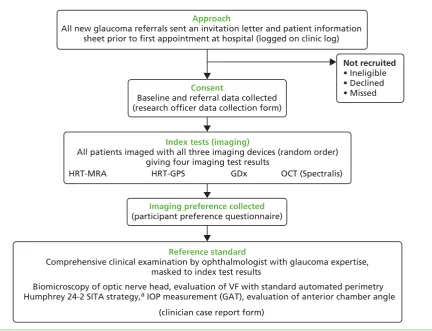
An overview of the GATE study design is shown inFigure 1. The GATE study is a pragmatic within-patient comparative diagnostic evaluation of four imaging techniques for glaucoma in patients referred to hospital eye services. Specifically, this study was designed to evaluate (1) diagnostic accuracy of imaging tests for detecting glaucoma in an eye and (2) diagnostic accuracy of triage tests that consisted of a combination of an imaging test, VA and IOP measurement, for identifying patients requiring referral to hospital eye services.
All patients recruited to the study received four different imaging tests (using three different devices), which were compared with a reference standard (i.e. a comprehensive clinical examination). The study was co-ordinated from a central study office in the Health Services Research Unit at the University of Aberdeen.
Approach
All new glaucoma referrals sent an invitation letter and patient information sheet prior to first appointment at hospital (logged on clinic log)
Consent
Baseline and referral data collected (research officer data collection form)
Not recruited • Ineligible • Declined • Missed
Index tests (imaging)
All patients imaged with all three imaging devices (random order) giving four imaging test results
HRT-MRA HRT-GPS GDx OCT (Spectralis)
Reference standard
Comprehensive clinical examination by ophthalmologist with glaucoma expertise, masked to index test results
Imaging preference collected
(participant preference questionnaire)
Biomicroscopy of optic nerve head, evaluation of VF with standard automated perimetry Humphrey 24-2 SITA strategy,a IOP measurement (GAT), evaluation of anterior chamber angle
[image:37.595.79.512.353.684.2](clinician case report form)
Participants
Inclusion criteria
Adult patients referred from community optometrists or general practitioners to hospital eye services with any glaucoma-related findings, including those with OHT.
Exclusion criteria
Patients referred to hospital eye services because of other ocular disease; patients<18 years old; patients who could not give informed consent; patients who had already been diagnosed with glaucoma; and patients referred from within secondary care.
Setting
Five NHS hospital eye services in the UK participated in this study: Aberdeen Royal Infirmary (Aberdeen), Bedford Hospital (Bedfordshire), Hinchingbrooke Hospital (Cambridgeshire), Moorfields Eye Hospital (London) and St Paul’s Eye Unit (Liverpool). The participating units consisted of three academic units of different sizes and two district general hospitals (Hinchingbrooke and Bedford).
Identification of participants and recruitment process
Consecutive eligible patients referred from community optometrists to hospital eye services with a glaucoma-related finding were identified by the research officer in each centre at the time of referral. Patients were identified from their referral letter as being referred with a possible glaucoma diagnosis or glaucoma-related finding, including high IOP, possible abnormalities in the optic disc or visual field tests, and possible narrow anterior chamber angle. To ensure that a full cross-section of referrals were identified, existing referral refinement schemes in two of the participating centres were suspended for the duration of the study in order not to introduce selection bias. In the largest centre (Moorfields Eye Hospital) only those patients booked to see a clinician trained in the study protocol to provide the reference standard were identified as eligible. Information about this study was sent to potentially eligible patients together with the date of the appointment (seeAppendix 1). Patients were approached by the local research officer on their first visit to hospital eye services to discuss the study and those patients who agreed to participate and signed the consent form (seeAppendix 1) were enrolled (i.e. before their consultation with the ophthalmologist). Each research centre kept a clinic log of eligible patients invited (seeAppendix 2), which included patient demographics (age and sex) and, for those who declined to take part or were found to be ineligible, reason for not taking part if given.
Diagnostic technologies being assessed (index tests)
Four diagnostic tests from three imaging devices were evaluated:
user to draw a contour line to define the optic disc boundary, and (2) glaucoma probability score (GPS),35which is fully automated and independent of operator input.
i. The HRT-MRA produces an overall (‘global’) classification as well as by six segments (‘temporal’,
‘temporal superior’,‘temporal inferior’,‘nasal’,‘nasal superior’and‘nasal inferior’) of the eye. Each a classification of‘within normal limits’,‘borderline’and‘outside normal limits’is given based on whether or not the observed value is within the 95.0% prediction interval, between the 95.0% and the 99.9% prediction interval or below the 99.9% prediction interval of the preset data, respectively. The final classification is based on the most abnormal of any of the seven classifications. If any one of these is‘outside normal limits’then the overall classification is‘outside normal limit’. Where there is no‘outside normal limits’but at least one‘borderline’then the final classification is‘borderline’. Only where the global and all six segment probabilities are‘within normal limits’is the final classification
‘within normal limits’.
2. HRT-GPS produces an overall probability of the presence of glaucoma (‘global’) and by segment (‘temporal’,
‘temporal superior’,‘temporal inferior’,‘nasal’,‘nasal superior’and‘nasal inferior’) for each eye. The default
‘final’classification is based on applying cut-off to the overall and six segment probabilities:<0.28 is‘within normal limits’,≥0.28 and<0.65 is‘borderline’and≥0.65 is‘outside normal limits’.35If any one of these is‘outside normal limits’then overall classification is‘outside normal limit’. Where there is none‘outside normal limits’but at least one‘borderline’then the final classification is‘borderline’. Only where the global and all six segment probabilities are‘within normal limits’is the final classification‘within normal limits’. 3. GDx-Enhanced Corneal Compensation (ECC) (Carl Zeiss Meditec, Dublin, CA, USA) scanning laser
polarimetry measures the RNFL thickness. Measurements are based on the birefringent properties of the RNFL, which has its neurotubules disposed in an organised, parallel fashion. The software provides a discriminating classifier of glaucoma/normality, the nerve fibre indicator (NFI) value, which is fully automated and is calculated for each eye. The manufacturers’reported cut-offs for the GDx-ECC NFI value are based on 95% and 99% coverage of the normative database population and are 1–35 (‘normal’), 36–55 (‘abnormal 95’) and≥56 (‘abnormal 99’).36The difference between‘abnormal 95’and
‘abnormal 99’may be viewed in a similar manner to the‘borderline’category for HRT-GPS, HRT-MRA and OCT classifications. The temporal, superior, nasal, inferior, temporal (TSNIT) parameters used in the calculation of the NFI are also produced overall and by eye segment (superior and inferior) and an inter-eye symmetry is also produced. Images are given a quality figure, which the manufacturer
recommends should be≥7. In this study, GDx-ECC measurements were made using either the GDx-Pro (three centres) or the GDx-VCC with updated ECC module (two centres).
4. OCT: SD-OCT (Spectralis®, Heidelberg Engineering, Heidelberg, Germany) is an optical imaging technique capable of providing high-resolution, cross-sectional imaging of the human retina in a fashion analogous to B-scan ultrasonography but using light instead of sound. OCT uses the principles of low-coherence interferometry using light echoes from the scanned structure to determine the thickness of the tissue. The glaucoma detection software of the Spectralis®machine used in this study produces an average RNFL thickness value for the global and six segments of the eye and automatically compares sectors of RNFL thickness with a normative database. An overall assessment of‘within normal limits’,‘borderline’or‘outside normal limits’is produced34based on the global classification and the six individual segments. Inter-eye symmetry is also produced for each segment. Images are given a quality figure, which the manufacturer recommends should be>15.
Reference standards
Eye level (for the diagnostic performance analysis)
The glaucoma diagnosis reference standard chosen for this study represents current clinical practice in the UK, which consists of clinical examination (biomicroscopy) of the appearance of the optic nerve head and
[image:40.595.81.529.320.786.2]evaluation of the visual field with standard automated perimetry Humphrey 24–2 SITA (Carl Zeiss Meditec, Dublin, CA, USA) strategy by an ophthalmologist with glaucoma expertise. In addition, the clinician measured the IOP and examined the anterior chamber angle. The imaging tests were not available to the ophthalmologist when measuring the reference standard. The clinician recorded the status of each eye as described inTable 1(i.e. glaucoma, OHT, glaucoma suspect, other eye morbidities or normal). If a clinical diagnosis could not be established at the first visit (e.g. unreliable visual field measurement requiring repeated measurement at a further appointment), an inconclusive diagnosis was recorded. In order to ensure valid and consistent application of the agreed reference standard, a limited number of consultant ophthalmologists provided the reference standard (one or two clinicians in four centres, and five different clinicians at one centre). Principal investigators collaborating in each of the participating units gathered at the start of the project to review and agree on the reference standard (definitions of glaucoma, OHT, glaucoma suspect and
TABLE 1 Clinical diagnosis definitions
Diagnosis Definition
Glaucoma
Severe Evidence of glaucomatous optic neuropathyaand a characteristic VF loss.bSevere: MD worse than or
equal to–12.01 dB
Moderate Evidence of glaucomatous optic neuropathya
and a characteristic VF loss.b
Moderate: MD between
–6.01 dB and–12 dB
Mild Evidence of glaucomatous optic neuropathyaand a characteristic VF loss.bMild: MD better than or
equal to–6 dB Glaucoma suspect
Disc suspect Appearance suggestive of glaucomatous optic neuropathy but may also represent a variation of normality, with normal VFs (with or without high IOP)
VF suspect VF loss suggestive of glaucoma, but may also represent a variation of normality, with normal appearance of the optic disc (with or without high IOP)
VF and disc suspect
Both the optic disc and VF have some features that resemble glaucoma but may also represent a variation of normality (with or without high IOP)
OHT When both the VF and optic nerve appear normal in the presence of elevated pressure>21 mmHg PAC Closed anterior chamber angle (appositionally or synechial) in at least 270°, and at least one of the following: IOP>21 mmHg and/or presence of peripheral anterior synechiae. Both VF and optic nerve appear normal
PAC suspect Closed anterior chamber angle (appositionally without any synechiae) in at least 270°, with IOP ≤21 mmHg. Both VF and optic nerve appear normal
MD, mean deviation; PAC, primary angle closure; VF, visual field.
a Evidence of optic nerve damage from any of the following: optic disc or RNFL structural abnormalities; diffuse thinning, focal narrowing or notching of the optic disc rim, especially at the inferior or superior poles; documented, progressive thinning of the neuroretinal rim with an associated increase in cupping of the optic disc; diffuse or localised
abnormalities of the peripapillary RNFL, especially at the inferior or superior poles; disc rim or peripapillary RNFL haemorrhages; optic disc neural rim asymmetry of the two eyes consistent with loss of neural tissue.
normal) and how to define the spectrum of the disease (mild, moderate and severe). For this purpose, training material was used including a series of cases with glaucoma-related findings and also with normal subjects. Clinicians who were incorporated into the study at a later date to recruit and provide the reference standard were trained individually by the chief investigator with the same material.
For the eye-level analysis, reference standard positive was classified as a diagnosis of glaucoma based on the‘worse’eye. Sensitivity analyses explored the diagnostic performance of the tests when also including glaucoma suspects in the definition of reference standard positive along with using the‘better’eye (see Statistical analysis methodsfor full details).
Patient level (for the triage performance analysis)
For each patient the clinical management decision made was recorded, that is‘discharge’or‘do not discharge’. Additionally, the reason for non-discharge [and which eye(s) it refers to] of‘treatment’or
‘monitoring’was also collected. Clinicians were advised to follow NICE guidelines in deciding whether to discharge or not.26
Outcomes
For each of the four tests (HRT-MRA, HRT-GPS, GDx and OCT) the following outcomes were measured.
Diagnostic performance of imaging technologies
The primary diagnostic performance outcomes were sensitivity and specificity. Secondary diagnostic performance outcomes were likelihood ratio and diagnostic odds ratio (DOR). The overall diagnostic performance of
combinations of these four tests was also evaluated (HRT-MRA with each of the other three tests) as well as their relative performance. The diagnostic performance of the tests (and corresponding combinations) was also assessed according to the spectrum of glaucoma (mild, moderate and severe), as defined by the glaucoma expert.
Other outcomes
The proportions of indeterminacy results, low-quality imaging according to the manufacturer’s
recommendation and the participant’s preference regarding the four tests were recorded for each test. Additionally, the number of participants who required pupil dilatation to perform the imaging was also recorded. Dilatation was attributed to the first imaging technology. Where a high-quality test result was not available for a participant (‘no result’), one of the following categorises applied:
(a) test performed and imaging report produced but quality is lower than manufacturer quality cut-off (b) test performed and imaging report produced but no overall classification generated by machine (c) test performed but there was a clear imaging artefact on the report
(d) test attempted but no imaging could be acquired from the patient’s eyes–no report generated (e) missing imaging output (owing to study-related or data-collection issues).
Indeterminacy of the result was calculated as categories (b) to (d), divided by the total number of
non-missing cases. The proportion of low-quality imaging was (a) divided by the total number of non-missing cases minus categories (a) to (d).
Diagnostic performance of a triage test (imaging test, visual acuity and intraocular pressure measurement)
Delivery of interventions and data collection
Enrolled participants attended a diagnostic station for imaging (index test) and visual field measurement immediately prior to their meeting with the ophthalmologist. In three centres (Hinchingbrooke, Bedford and Liverpool), the visual field and imaging measurements took place on a separate day prior to the ophthalmologist appointment (within 2 weeks). Pupils were not routinely dilated. However, in those patients in whom adequate quality imaging could not be obtained, pupil dilatation could be used to try to improve image quality. In exceptional circumstances, where dilatation was required in centres offering split visits, some or all of the imaging tests could be delayed until the clinic appointment but always ahead of the clinical reference standard. Imaging technicians and the patient were therefore masked to the patient’s underlying condition at the time of testing. In the remaining two centres (Aberdeen and Moorfields) all measurements were undertaken on the same day. All participants in each of the centres underwent testing with the three imaging devices, in a random order (to avoid bias when collecting participant preference) in one sitting. The random test order was automatically generated for each patient from the study website.
Imaging technicians employed at each centre performed the imaging tests. One to three technicians were identified at each centre and trained in study procedures prior to recruitment (seeAppendix 4). There was no restriction on the same technician performing all imaging tests on an individual. Across all centres, most technicians were experienced in performing the test prior to the study; if technicians were not already experienced, they received training from the manufacturer or local imaging lead prior to collecting study data.
With the exception of HRT-MRA, which required an experienced user to identify a contour line at the optic disc margin, all imaging tests generated the glaucoma classification automatically once an image had been acquired. The research officer kept printed copies of the images and uploaded the imaging results to the study website. Imaging reports were identified using a unique study number and date of birth.
The participant was asked to grade the tests in order of preference, or to record no preference, using a standard form (seeAppendix 2). Visual field measurements were undertaken with standard perimetry Humphrey SITA 24-2 strategy for each participant after all imaging tests had been completed. In exceptional circumstances, visual field measurements were undertaken ahead of the imaging tests because of clinic demand for equipment. Participants were then examined by an experienced glaucoma clinician who performed a comprehensive ocular examination including IOP measurement with Goldmann applanation tonometry (GAT), gonioscopy and biomicroscopic examination of the optic disc (with pupil dilated in patients without narrow anterior chamber angle) and evaluated the visual field test results. The clinician provided the reference standard masked to the results of the imaging technologies and completed a clinical data collection form (seeAppendix 2).
The research officer collated the results for each participant (seeAppendix 2) including a copy of the visual field test, completed forms for each participant, uploaded the information onto the web page and posted original consent forms to the central office. Information uploaded onto the web page included demographics, referral IOP, refractive error, patient preference, need for pupil dilatation, and Humphrey visual field reliability and global indices mean deviation (MD), pattern standard deviation (PSD) and visual field index (VFI).