HEALTH BEHAVIOUR IN SCHOOL-AGED CHILDREN:
Findings from the 2006 HBSC Survey in Scotland
CHILD AND ADOLESCENT HEALTH RESEARCH UNIT (CAHRU)THE MORAY HOUSE SCHOOL OF EDUCATION The University of Edinburgh
St Leonard’s Land, Holyrood Road Edinburgh EH8 8AQ
Tel: 0131 651 6520 Fax: 0131 651 6271 www.education.ed.ac.uk/cahru/
Design:
S
o
..
.
it
begins
ww
w
.soitbegin
s.c
HBSC SCOTLAND
NATIONAL REPORT
HEALTH BEHAVIOUR IN
SCHOOL-AGED CHILDREN:
WORLD HEALTH ORGANIZATION
COLLABORATIVE
CROSS-NATIONAL STUDY (HBSC)
Findings from the 2006
HBSC Survey in Scotland
Candace Currie
Kate Levin
Joanna Todd
and the HBSC National Team
CONTENTS
Tables and Figures iv
Foreword vi
Executive Summary vii
Acknowledgements ix
Chapter 1: Introduction and Methods 1
Chapter 2: Family life 7
Chapter 3: The school environment 13
Chapter 4: Peer relations 19
Chapter 5: Eating habits 23
Chapter 6: Physical activity and sedentary behaviour 31
Chapter 7: Weight control behaviour 39
Chapter 8: Body image and Body Mass Index 43
Chapter 9: Tooth brushing 47
Chapter 10: Mental well-being 49
Chapter 11: Substance use 55
Chapter 12: Sexual health 63
Chapter 13: Bullying and fighting 69
Chapter 14: Injuries 73
Appendix 75
TABLES
Table 1.1 Response rates by class 4
Table 12.1 Contraception use 68
FIGURES
CHAPTER 2: FAMILY LIFE
Figure 2.1 Family structure 9
Figure 2.2 Family structure 1990-2006 9
Figure 2.3 SES of mothers and fathers 9
Figure 2.4 Family SES 9
Figure 2.5 Family affluence 9
Figure 2.6 Perceived family wealth by age 11
Figure 2.7 Perceived wealth 1998-2006 11
Figure 2.8 Easy to talk to father 11
Figure 2.9 Easy to talk to mother 11
Figure 2.10 Easy to talk to father 1990-2006 11
Figure 2.11 Easy to talk to mother 1990-2006 12
CHAPTER 3: THE SCHOOL ENVIRONMENT
Figure 3.1 Like school a lot 15
Figure 3.2 Like school a lot 1990-2006 15
Figure 3.3 Performance at school 15
Figure 3.4 Performance at school 1998-2006 15
Figure 3.5 Feel pressured by schoolwork 15
Figure 3.6 Feel pressured by schoolwork 1994-2006 17
Figure 3.7 Classmates kind and helpful 17
Figure 3.8 Expectations on leaving school among
S4 pupils 17
Figure 3.9 Expectations on leaving school among
S4 pupils 1998-2006 17
CHAPTER 4: PEER RELATIONS
Figure 4.1 Three or more close friends of same gender 21
Figure 4.2 Spend time with friends after school 4+ 21
days/week
Figure 4.3 Spend time with friends on 4+ evenings/ 21
week
Figure 4.4 Spend time with friends on 4+ evenings/ 21
week 1994-2006
Figure 4.5 Easy to talk to best friend 21
Figure 4.6 Electronic media contact with friends 22
every day
CHAPTER 5: EATING HABITS
Figure 5.1 Frequency of family meals by age 25
Figure 5.2 Daily family meals 1994-2006 25
Figure 5.3 Eat breakfast every morning on 25
school days
Figure 5.4 Eat breakfast daily 1990-2006 25
Figure 5.5 What pupils do for lunch on school days 25
by age
Figure 5.6 Eat fruit daily 27
Figure 5.7 Eat vegetables daily 27
Figure 5.8 Eat sweets daily 27
Figure 5.9 Eat crisps daily 27
Figure 5.10 Eat chips daily 27
Figure 5.11 Drink coke/ other sugary drinks daily 29
Figure 5.12 Drink diet soft drinks daily 29
Figure 5.13 Drink water daily 29
CHAPTER 6: PHYSICAL ACTIVITY AND SEDENTARY BEHAVIOUR
Figure 6.1 33
Figure 6.2 Leisure time vigorous exercise frequency 33
(4 or more times per week)
Figure 6.3 Leisure time vigorous activity duration 33
(2 or more hours per week)
Figure 6.4 Frequency of leisure time vigorous physical 33
activity 1990-2006
Figure 6.5 Duration of leisure time vigorous physical 33
activity 1990-2006
Figure 6.6 Mode of travel to school 35
Figure 6.7 Mode of travel to school by age 35
Figure 6.8 Travel time to school by age 35
Figure 6.9 Watch TV for 2 hours a day on school days 35
Figure 6.10 Watch TV for 2 hours a day at weekends 35
Figure 6.11 Play computer games for 2 or more hours
a day on school days 37
Figure 6.12 Play computer games for 2 or more
hours a day at the weekend 37
Figure 6.13 Use computers (not games) for 2 or
more hours a day on school days 37
Figure 6.14 Use computers (not games) for 2 or
more hours a day at the weekend 37
CHAPTER 7: WEIGHT CONTROL BEHAVIOUR
Figure 7.1 Currently trying to lose weight 41
Figure 7.2 Ever been on a diet 41
Figure 7.3 Ever been on a diet 1990-2006 41
TABLES AND FIGURES
IV
CHAPTER 8: BODY IMAGE AND BODY MASS INDEX
Figure 8.1 Report body is too fat 45
Figure 8.2 Report body is too fat 1990-2006 45
Figure 8.3 Report good looks 45
Figure 8.4 Report good looks: 1990-2006 45
Figure 8.5 Weight groups according to BMI: 45
15-year-olds
CHAPTER 9: TOOTH BRUSHING
Figure 9.1 Brush teeth at least twice a day 48
Figure 9.2 Brush teeth at least twice a day 48
1990-2006
CHAPTER 10: MENTAL WELL-BEING
Figure 10.1 51
Figure 10.2 Report high life satisfaction 51
Figure 10.3 Feel very happy 51
Figure 10.4 Feel very happy 1994-2006 51
Figure 10.5 Always feel confident 51
Figure 10.6 Always feel confident 1994-2006 53
Figure 10.7 Never feel helpless 53
Figure 10.8 Never feel helpless 1994-2006 53
Figure 10.9 Never feel left out 53
Figure 10.10 Never feel left out 1998-2006 53
CHAPTER 11: SUBSTANCE USE
Figure 11.1 Ever smoked tobacco 57
Figure 11.2 Current smoking 57
Figure 11.3 Smoke tobacco daily 57
Figure 11.4 Current smoking among 15-year-olds 57
1990-2006
Figure 11.5 Daily smoking among 15-year-olds 57
1990-2006
Figure 11.6 Drink alcohol weekly 59
Figure 11.7 Weekly drinking among 15-year-olds 59
1990 -2006
Figure 11.8 Types of alcohol drunk weekly by 59
15-year-olds
Figure 11.9 Been drunk 2 or more times 59
Figure 11.10 Been drunk 2 or more times: 59
15-year-olds 1990-2006
Figure 11.11 61
Figure 11.12 Used cannabis in past 12 months 61
Figure 11.13 Cannabis user groups: 15-year-olds 61
CHAPTER 12: SEXUAL HEALTH
Figure 12.1 Sex education at school 65
Figure 12.2 Main source of information on sexual 65
matters
Figure 12.3 Main source of information on sexual 65
matters in 2002 and 2006
Figure 12.4 Person it is easiest to discuss personal and 66
sexual matters with
Figure 12.5 School sex education on personal 66
relationships 1990-2006
Figure 12.6 School sex education on getting pregnant 67
1990-2006
Figure 12.7 School sex education on menstruation 67
1990-2006
Figure 12.8 School sex education on sexual intercourse 67
1990-2006
Figure 12.9 Reported sexual intercourse: 1998-2006 67
CHAPTER 13: BULLYING AND FIGHTING
Figure 13.1 Been bullied at least 2-3 times in past 71
couple of months
Figure 13.2 Bullied others at least 2-3 times in past 71
couple of months
Figure 13.3 Involved in a physical fight 3 times or more 71
last year
CHAPTER 14: INJURIES
Figure 14.1 Injured at least once in past 12 months 74
V
VI
FOREWORD
Among the many important issues for public health in Scotland today, possibly the single most important one is the critical impact for future health of our formative years. Our trajectories in life are largely established by our late teens, and so are the lifelong health impacts of the advantages and disadvantages accrued during childhood and youth. The balance of advantages and disadvantages that an individual gains are not down to chance (though chance always plays some part in life). They are closely linked to the circumstances of children’s and young people’s lives - to their social, economic and cultural context.
Neither the circumstances of life nor the way we react, or are expected to react, to them are static. Things change over time. They also vary by place and social group. The teenage ‘finding of self’ will take a different form for a 13-year old from an affluent suburb in the 1950s than for a 13-year old on a peripheral social housing estate in the 1990s. And if one is a girl and the other a boy, the differences are even more marked. To understand the processes at work, so that we might intervene to ensure a better opportunity for all young people, requires serious study over a long period of time.
The series of Health Behaviour in School-aged Children (HBSC) surveys in Scotland is one of our most important foundations for such study. Since the first national survey in 1990, successive surveys have been carried out every four years. This report, on the fifth survey in 2006, is important not just for what it says about young people in 2006. It is important because it shows how their health-related behaviours and the context in which they take place has been changing. Or not changing.
The HBSC has always laid stress on the academic and methodological robustness of its approach. Consistency has been maintained, as far as possible, over time and between the 43 countries now included in the HBSC. But rigour alone is not enough to improve public health and commitment to dissemination and use of the knowledge gained is also vital.
The clear presentation of findings both challenges and motivates us. After two decades of effort, why is it that smoking rates are no lower than in 1990 and drinking rates are higher? And, in what I personally find the most intriguing single result, why is it that happiness (and a range of associated measures) has improved between 1994 and 2006? Is it a secular by-product of change in society or the outcome of intentional actions through policy or other initiatives? We do not know. And without such understanding, how can we hope to know how to do better?
NHS Health Scotland (and its predecessors) has funded the HBSC in Scotland since its inception and have already committed to the next survey in 2010. There is still much to learn about how we can best support young people both at individual level and by improving the contexts that drive and constrain their decisions and supposed ‘choices’. Maximising the advantages and opportunities of childhood and youth is a key goal for all organisations seeking to promote the health of Scotland’s population, from the Scottish Government to the individual practitioner. All will profit from the knowledge contained in this report and from the more detailed analyses, which will follow.
Dr David S Gordon
NHS Health Scotland
EXECUTIVE SUMMARY
This report presents data on adolescent health from the World Health Organization (WHO) collaborative cross-national Health Behaviour in School-Aged Children (HBSC) study in Scotland. Prevalence statistics for 2006 and trends across five consecutive surveys in 1990, 1994, 1998, 2002 and 2006 are included. Over 6,000 pupils were sampled in the most recent Scottish survey of 2006. The main findings are summarised below.
FAMILY LIFE
The majority of young people in Scotland (68%) live with both their parents, while 19% live with just one parent (17% with their mother and 2% with their father), and a further 12% live in a step family. Most of those children living with two parents (78%) report that both are in employment. A further 19% report that one parent is in employment, compared with 70% of children from single parent families. Young people find it easier to talk to their mother (80%) than to their father (60%) and ease of communication with parents (particularly fathers) deteriorates with age for both boys and girls. Boys and girls find it equally easy to talk to their mothers about things that bother them but boys are more likely than girls to have easy communication with their fathers.
THE SCHOOL ENVIRONMENT
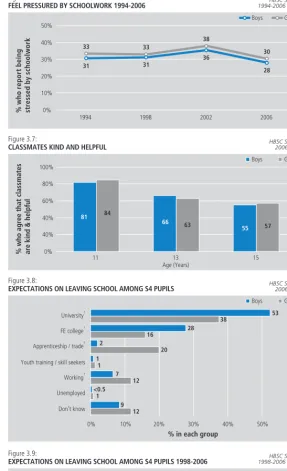
A quarter of young people like school ‘a lot’, girls more than boys. Liking school declines with age. Two thirds of young people rate their school performance highly relative to their classmates but this proportion declines with age. Schoolwork pressure was reported by nearly a third of young people, particularly at age 15 when 34% of boys and 45% of girls report feeling stressed by schoolwork. The majority (68%) of young people find their classmates kind and helpful. 84% of 15-year-old girls aspire to go on to university or further education on leaving school, compared with 54% of boys.
PEER RELATIONS
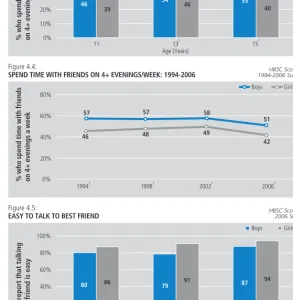
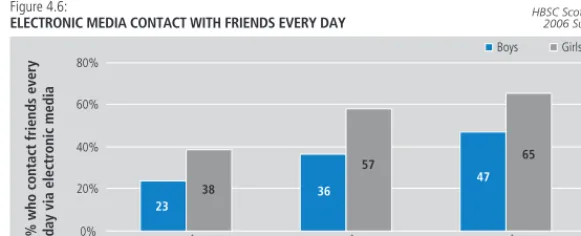
Half of girls and a third of boys contact their friends daily via phone, text messages and/or the internet, and electronic media contact increases with age. Girls find it easier than boys to talk to their best friend about things that really bother them, however ease of communication with best friend increases with age for both boys and girls. Boys are more likely than girls to spend time with friends immediately after school or in the evening.
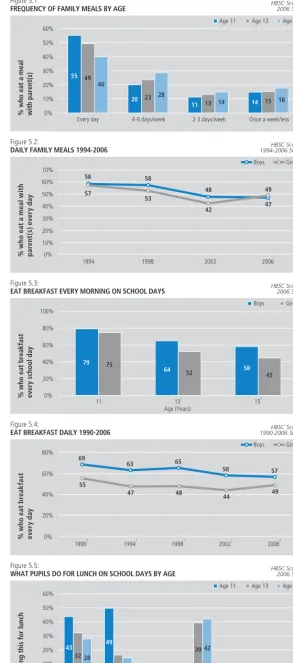
EATING HABITS
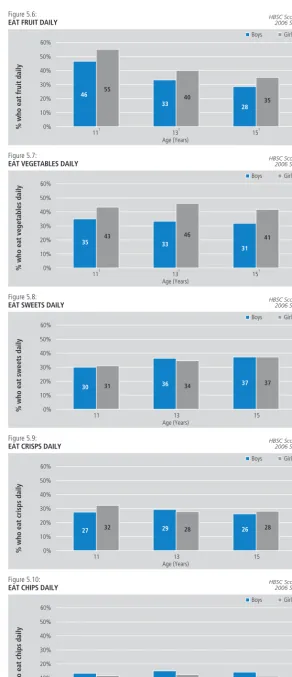
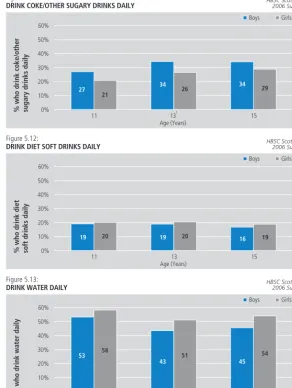
Almost three quarters of young people eat a family meal four or more days a week and almost two thirds eat breakfast every school day. The frequency with which young people have breakfast decreases with age, as does the frequency of having a family meal. 40% of young people eat fruit daily and 38% eat vegetables daily, with higher proportions of girls than boys eating both. The proportion of young people eating fruit daily decreases with age, while there is no change in vegetable consumption. Daily consumption of water is more than double the daily consumption of soft drinks.
PHYSICAL ACTIVITY AND SEDENTARY BEHAVIOUR
29% of boys and 16% of girls meet the Scottish Government moderate to vigorous physical activity guidelines. Older boys take part in vigorous exercise less often but for longer durations than younger boys, while girls take part less frequently as they get older but duration of exercise remains the same across all ages. Approximately half of young people in Scotland walk to school, primary pupils more often than secondary. Boys play computer games and watch television more often than girls, and for both, TV and computer usage is higher at the weekend than during the week. Whilst the use of computers for game playing decreases with age, computer use for other purposes (chatting on-line, internet, e-mailing, homework) increases.
VIII
WEIGHT CONTROL BEHAVIOUR
One third of young people report that they have previously been or are currently on a diet and there has been a 50% increase in reported dieting among boys since 1990. Girls are twice as likely as boys to be dieting or doing something else to lose weight (22% and 11% respectively). Boys are less likely to try to control their weight as they get older, while the opposite is true for girls.
BODY IMAGE AND BMI
25% of boys and 40% of girls report that they feel too fat. 36% of boys and 26% of girls consider themselves to be good looking. Young people’s views of their physical appearance and body size are less favourable at age 13 than at age 11. Of those who reported their height and weight, three quarters of 15-year-olds are classified as having a normal weight, 12% as being overweight, and 2% are classified as being obese, according to their self-reported height and weight.
TOOTH BRUSHING
There has been a steady increase from 1990 to 2006 in the proportion of boys and girls who brush their teeth two or more times a day, and girls are more likely than boys to brush their teeth twice a day or more; 80% compared with 65%.
MENTAL WELL-BEING
The majority of young people (84%) are satisfied with their life, 49% are very happy, 36% never feel helpless, 22% never feel left out of things, 21% rate their health as excellent and 20% always feel confident. Boys fare better than girls on all six mental health measures and prevalence of well-being decreases with age, for girls more than boys. Young people’s happiness, confidence and never feeling helpless have increased since 1994, and the proportion not feeling left out has increased since 1998.
SUBSTANCE USE
More than one in four young people have tried smoking and, at age 15, girls are more likely to have tried smoking than boys. 13% of girls and 10% of boys report that they are smoking at present. By age 15, two thirds of smokers report that they smoke every day. One in five 13-year-olds and two in five 15-year-13-year-olds drink alcohol at least once a week. 48% of 15-year-old girls and 43% of 15-year-old boys have been drunk on at least two occasions. Although boys and girls are equally likely to drink alcohol by age 13, the type of drink consumed varies; boys are most likely to drink beer, while girls prefer alcopops and spirits. 28% of 15-year-olds and 7% of 13-year-olds have used cannabis. Nine percent of 15-year-olds are ‘experimental users’ of cannabis while a further ten percent are ‘regular users’.
SEXUAL HEALTH
Schools, friends and parents rank first, second and third respectively as sources of information on sexual matters for both boys and girls. Approximately three quarters of 15-year-olds say that it is easiest to discuss personal and sexual matters with friends. Nearly a third of 15-year-olds have had sexual intercourse (30% of boys and 34% of girls). 85% of boys and 74% of girls who are sexually active used a condom on the last occasion that they had sexual intercourse.
BULLYING AND FIGHTING
Approximately 10% of young people report having being bullied at least two or three times at school in the previous couple of months, although by age 15 this has decreased to 7%. One in twenty of young people report bullying others (8% of boys; 3% of girls). 8% of girls and 22% of boys have been in a physical fight in the previous 12 months. Fighting among boys decreases with age.
INJURIES
IX
ACKNOWLEDGEMENTS
We thank the Regional and Island Authorities for granting permission for their schools to participate in the survey; and all the young people who completed questionnaires; and the schools and teachers who kindly agreed to administer the survey.
Acknowledgement is made to all national teams in the international HBSC research network who collaborated on the production of the HBSC international research protocol and the support of the WHO Regional Office for Europe.
We are grateful to David Gordon, Head of the Public Health Observatory and his team at Health Scotland for their ongoing support. The HBSC study in Scotland is funded by NHS Health Scotland. Special thanks go to Emily Healy and Janine Muldoon for editorial support and to external reviewer, Michal Molcho at the National University of Ireland, Galway for comments to an earlier draft of the report.
HBSC National Team:
Candace Currie (Principle Investigator) Dorothy Currie
Kate Levin
Joanna Todd Jo Inchley
1
1
INTRODUCTION
Health improvement of young people in Scotland
The improvement of young people’s health in Scotland is a key aim of recent Government policies. National and local targets and programmes concerned with children and adolescents have focused on physical activity, nutrition, mental health and sexual health with an overarching aim to reduce health inequalities. Other areas of concern are smoking, alcohol or drug use and risks associated with overweight. Support for the development of health promoting environments for young people has been highly visible in the context of the Health Promoting School in Scotland. A target was set by the government for all schools to be health promoting by 2007. The strong commitment to young people’s health is now evident in recent legislation. The Schools (Health Promotion and Nutrition) (Scotland) Act 2007 (Scottish Government, 2007)states that schools have a duty to promote the physical, social, mental and emotional health and wellbeing of all pupils.
The Health Behaviour in School-Aged Children: WHO Collaborative Cross-National Study (HBSC) The Health Behaviour in School-Aged Children (HBSC) Study in Scotland is a key source of information on child and adolescent health in the country. HBSC takes a broad perspective, gathering information on wide-ranging aspects of young people’s health and well-being as well as the social contexts within which they are growing up (Currie et al., 2004). The HBSC Cross-National Study initiated in 1983 in three countries, has now grown to include 43 countries in Europe and North America. Scotland became a member country in 1986 and the first national HBSC survey was conducted in 1990. National surveys have been conducted every four years since then in line with the cross-national survey cycle. The study in Scotland is based at the Child and Adolescent Health Research Unit, University of Edinburgh. CAHRU is also the HBSC International Coordinating Centre (ICC). NHS Health Scotland funds the national study and also provides support to the ICC.
The target population of the HBSC study is young people attending school, aged 11, 13 and 15 years old. These age groups were selected because it is during these years that important stages of development occur (i.e., the onset of adolescence, the challenge of physical and emotional changes and the middle teenage years when important life and career decisions are being made). The school-based survey is administered to a nationally representative sample of approximately 1500 pupils from each age group in each participating country. Pupils complete questionnaires in the classroom during one school period.
HBSC is conducted in collaboration with the World Health Organization Regional Office for Europe and this partnership supports the wide dissemination of research findings to inform and influence health promotion and health education policy and practice at national and international levels. The Scottish HBSC team has produced a range of papers, reports and briefing papers to inform policy makers, practitioners, and academics on findings from the study. These are available on the CAHRU website1.
A full list of international publications is presented on the HBSC website2.
The report
HBSC surveys in Scotland have produced a wealth of data on the health of the nation’s youth over the last two decades. This report provides up-to-date information on young people’s health and behaviour in Scotland, as well as the social contexts affecting their lives. Where possible, patterns are traced back to the early 1990s. The data presented capture all the key priority areas of mental health, physical activity, eating habits, substance use and sexual behaviour. Less commonly reported issues are also examined; examples include how young people feel about their bodies, their efforts at weight control, their experience of bullying and fighting, how they get along with friends and family and relationships at school. Uniquely, HBSC places young people’s health in social and economic context and gathers data on family structure and socioeconomic circumstances. The report therefore also shows how social contexts of young people’s lives have changed over recent years. Analyses assessing the role that these factors play in explaining young people’s health and well-being are reported elsewhere (Levin et al., 2007; Todd et al., 2007).
STUDY METHODOLOGY
Questionnaire design
The Scottish HBSC questionnaire follows the international HBSC survey protocol, developed by the HBSC international network of researchers from member countries. The questionnaire is designed by network members working in focus groups according to area of expertise in various aspects of adolescent health. The study methods are outlined briefly below, with a more comprehensive description available elsewhere (Roberts et al., 2004; 2007). For each survey round a full research protocol is developed which includes the scientific rationales for topic areas included in the international standard questionnaire. While some items remain from each survey year to the next, others may change and others still may be dropped entirely according to national and international priorities and methodological developments. Items are subject to validation procedures in several countries before final versions are submitted for inclusion in the international questionnaire (Boyce, et al., 2006; Elgar et al., 2005; Haugland and Wold, 2001; Vereecken and Maes, 2003). In 2006 there were 53 questions (with 122 items) that were considered ‘core’ to the international study. These questions are mandatory for all member countries of the network, including Scotland, to ensure that international comparisons can be made on a number of key social, health and behaviour measures. In addition to the mandatory questions required by the HBSC network, optional thematic packages validated internationally are made available. The Scottish HBSC questionnaire also includes items that are of specific interest to the health of Scottish adolescents.
The Scottish national questionnaire was piloted in the autumn term of 2005 before the final version was submitted for documentation to the international HBSC databank in Bergen.
The questionnaire is designed to take approximately 40 minutes to complete.
Sample Design
The HBSC 2006 sample was designed to be nationally representative and produce robust prevalence estimates describing the social context, health and health behaviour of 11, 13 and 15 year olds in Scotland. The survey was conducted in schools, using the class as the sampling unit, with all the pupils in selected classes being asked to complete the confidential questionnaire anonymously.
The target population was school children in the final year of primary school (P7, average age 11.5 years) and in the second (S2) and fourth (S4) years of secondary education (average ages 13.5 and 15.5 years respectively). All local authority funded and independent sector schools were included in the sample frame with the exception of schools for children with special needs.
The sample was proportionally stratified by school funding (educational authority or independent) and education authority for state funded schools, with implicit stratification for socio-economic status, taking the proportion of children with free school meals as a proxy. Samples were selected separately for each school year group.
Within each strata schools were selected with probability proportional to the number of classes in the required year group. This meant that larger schools had a higher probability of inclusion in the sample of schools. For each age group, one class from each selected school was included in the sample.
Sample size and Precision of Estimates
The recommended minimum sample size for each of the three age groups was set at 1536 students, in accordance with International HBSC protocol. This calculation assumed a 95% confidence interval of ± 3% around a proportion of 50% and a design factor of 1.2. The design factor is the amount by which the sample size computed for a simple random sample should be multiplied to account for cluster sampling, ie sampling classes rather than children. For example,
the proportion of 11 year old boys who have ever smoked is 9%. The standard error under the
3
INTRODUCTION AND METHODS
4
assumption of random sampling is 0.9%. The true complex standard error for this proportion, which takes account of the sample design, is 1.3%, resulting in 95% confidence intervals of 6.5%-11.7%. This compares with a confidence interval of 7.0%-10.5% under the assumption of random sampling. The design factor in this example is 1.3/0.9=1.4.
Response Rates
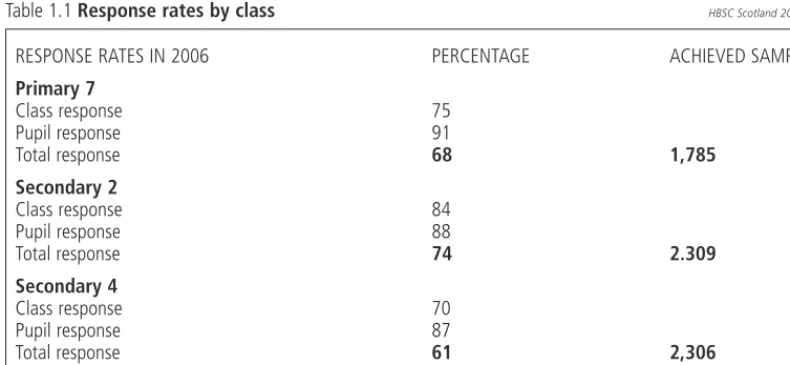
[image:15.595.87.482.245.427.2]Of the 396 school classes asked to participate in the survey, 300 (76%) took part. The breakdown of response rates is shown in Table 1.1. Pupil responses within classes were good, with approximately 11% of pupils in the class not returning a questionnaire. The main reason for school (class) non-response was that they were too busy. The main reason for pupil non-response was illness or unexplained absence. Pupils not present on the day were not followed up after the survey.
Table 1.1 Response rates by class HBSC Scotland 2006 Survey
Administration of survey instrument
Questionnaires were administered in schools between January and March 2006. The administration of the questionnaire in schools was conducted by school teachers who were given precise instructions on how to carry this out. Teachers were also given a class return form to complete which detailed how many pupils completed the questionnaire, how many were absent and reasons for absence. On completion, each pupil placed the questionnaire in an envelope and sealed it. The completed questionnaires were then returned by all schools. Coding of responses and data entry was conducted according to protocol guidelines. The national dataset was then submitted with complete documentation of the procedures adopted, as well as any deviations in the wording of questions or choice of responses, to the international data bank in Bergen. The Norwegian Social Science Data Service (NSD) performed cleaning and data quality checks under the supervision of the HBSC data bank manager, and produced the full international dataset, available for use by members of the research network.
Ethical approval and consent
The study, including the proposed design, timetable and intention of use, is first approved by the Moray House School of Education Ethics Committee. Directors of Education were contacted and permission was requested to invite schools to take part in the survey. Once permission was granted, selected schools were sent a letter of invitation, information about the HBSC survey, along with an example questionnaire, and details of what is involved in taking part. Consenting schools then sent a letter, written by CAHRU, to the parents of pupils in selected classes, requesting consent for their children to be surveyed. Parental consent forms were opt-out, so that only those pupils whose parents signed an opt-out form were not included in the survey. Pupils themselves could also opt out of the survey on the day if they chose not to take part. They were provided with information leaflets about the survey before the survey day.
RESPONSE RATES IN 2006 PERCENTAGE ACHIEVED SAMPLES
Primary 7
Class response 75
Pupil response 91
Total response 68 1,785
Secondary 2
Class response 84
Pupil response 88
Total response 74 2.309
Secondary 4
Class response 70
Pupil response 87
Total response 61 2,306
5
INTRODUCTION AND METHODS
RESULTS
Presentation of Findings
The Report is made up of 14 chapters, including this first one which gives a broad introduction and background to the study. Chapters two, three and four give a descriptive summary of social factors which are known to be associated with the health behaviour of young people: family life, the school environment and peer relations. The remainder of the report describes prevalence of various health indicators and behaviours, broken down by age and gender. Most of the findings presented in this report are based on collapsing response options to questionnaire items.
Data Analyses
For the most part, comparisons were drawn between genders and age groups in the prevalence of health outcomes described by proportions. Design adjusted chi-square tests were carried out to assess statistical significance of differences between genders and age groups. All differences or changes reported are significant unless otherwise stated. In this report a 99% level of significance was used in the comparison of proportions. This more conservative measure was used in preference to 95% as many tests of proportions were carried out. Analyses for age and gender took account of the effect of the survey design- stratification, clustering and weighting- on the precision of the estimates presented. The Complex Survey package of SPSS 14 (SPSS Inc, 2005) was used for all design-adjusted analyses
Many of the items were collected over a number of surveys in Scotland and trends are reported for these. Where differences ‘between 1990 and 2006’ are described, the statistical test carried out was between the proportion in 1990 and the proportion in 2006. In a few cases comparisons were drawn between intervening years but these are highlighted in the text.
In some cases, reported data appear not to add up, eg. Figure 2.3, percentages of mother SES appear to add up in total to 101%. This is due to rounding error. Similarly, columns in Figure 6.13 appear to be different for an equivalent percentage. This apparent inconsistency is again due to rounding.
REFERENCES
Boyce, W., Torsheim, T., Currie, C. and Zambon, A. (2006). The Family Affluence Scale as a Measure of National Wealth: Validation of an Adolescent Self-reported Measure. Social Indicators Research, 78 (3): 473-487.
Currie, C., Roberts, C., Morgan, A., Smith, R., Settertobulte, W., Samdal, O. and Barnekow Rasmussen, V. (2004). Young People's Health in Context: Health Behaviour in School-aged Children Study. International Report from the 2001/2002 Survey. Health Policy for Children and Adolescents No.4. Copenhagen, Denmark: WHO Regional Office for Europe.
Elgar, F., Moore, L., Roberts, C., Tudor-Smith, C. (2005), Validity of self-reported height and weight and predictors of bias in adolescents. Journal of Adolescent Health, 37 (5): 371-375.
Haugland, S. and Wold, B. (2001). Subjective health in adolescence - Reliability and validity of survey methods. Journal of Adolescence, 24(5): 611-624.
Levin, K., Todd, J., Inchley, J., Currie, D., Smith, R. and Currie, C. (2007). HBSC Briefing Paper 11: Family affluence and health among schoolchildren. Edinburgh: Child & Adolescent Health Research Unit (CAHRU).
Todd. J., Smith, R., Levin, K., Inchley, J., Currie, D. and Currie, C. (2007). HBSC Briefing Paper 12: Family structure and relationships and health among schoolchildren. Edinburgh: Child & Adolescent Health Research Unit (CAHRU).
Roberts, C., Currie, C., Samdal, O., Currie, D., Smith, R. and Maes, L. (2007) Measuring the health and health behaviours of adolescents through cross-national survey research: recent developments in the Health Behaviour in School-aged Children (HBSC) study. Journal of Public Health, 15 (3), 179-186.
Roberts, C., Tynjala, J., Currie, D. and King, M. (2004). Methods. In Currie C. et al (eds.) Young People's Health in Context: international report from the HBSC 2001/02 survey. WHO Policy Series: Health policy for children and adolescents Issue 4, WHO Regional Office for Europe, Copenhagen.
Scottish Government (2007) Schools (Health Promotion and Nutrition) (Scotland) Act 2007.
Vereecken, C., Maes , L. A. (2003). A Belgian study on the reliability and relative validity of the Health Behaviour in School-Aged Children food frequency questionnaire. Public Health Nutrition, 6, 581-588.
NOTES:
1 www.education.ed.ac.uk/cahru 2 http://www.hbsc.org/
7
2
FAMILY LIFE
• In Scotland, 68% of young people live with both their parents, 19%
with a single parent (17% with mother and 2% with father) and 12%
in a step family; the remaining 1% live in a variety of care arrangements
• Of those children living with both parents, 78% have both parents in
employment, and a further 19% have one in employment, whilst among
children from single parent families 70% have a parent in employment
• Of the 64% of fathers who have been assigned socio-economic status
(SES), most fall into skilled manual (SES 4) and managerial/technical
(SES 2) categories. Among the 60% of mothers with an assigned SES,
the most common category is managerial/technical (SES 2)
• 57% of young people think their family is quite or very well off, with
11-year-olds more likely to describe their family as very well off than
13 or 15-year-olds
• Young people find it easier to talk to their mother (80%) than to their
father (60%) and ease of communication with parents (particularly
fathers) deteriorates with age for both boys and girls
INTRODUCTION
For adolescents, as well as younger children, the family is a vital setting for physical, emotional and social development. Family provides the context in which many health behaviours are established and its influence continues throughout adolescence and onward through the life course (Pedersen et al., 2004).
The composition of the family unit has undergone significant change in recent decades and many children in Scotland are growing up in increasingly diverse living arrangements. Overall, the association between family structure and adolescent health tends to show more favourable outcomes for children living in two-parent families compared to step- and single-two-parent families (Amato and Keith, 1991; Griesbach et al., 2003; McMunn et al., 2001; Todd et al., 2007).However, the variations in social, cultural and political norms across Europe mean that associations between family structure and health are likely to vary (Iacovu, 2004).
Importantly, research suggests that it is not only family composition that is important, but the quality of relationships between family members (Houseknecht and Hango, 2006; Martinez and Forgatch, 2002).
Good parent-child relations can serve a protective function, helping children to achieve positive health outcomes and avoid stress (Barrett and Turner, 2006). Adolescents who have good relationships with their parents experience fewer behavioural problems and are less likely to engage in risk taking behaviour
(McArdle et al., 2002; Pedersen et al., 2004; Ward and Laughlin, 2003).
Family socioeconomic circumstances can also have a profound influence on the health and well-being of young people. In particular, parental occupation and family affluence are associated with a range of adolescent health outcomes. Children from high affluence families are more likely to have high life satisfaction, engage in physical activity, have healthy eating patterns and brush their teeth twice daily
(Currie et al., 2008; Holstein et al., 2004; Levin et al., 2007; Maes et al., 2006).
HBSC FINDINGS
Various dimensions of family life are measured in HBSC, including family structure, parental employment and occupation, family affluence and parent-child communication.
FAMILY STRUCTURE
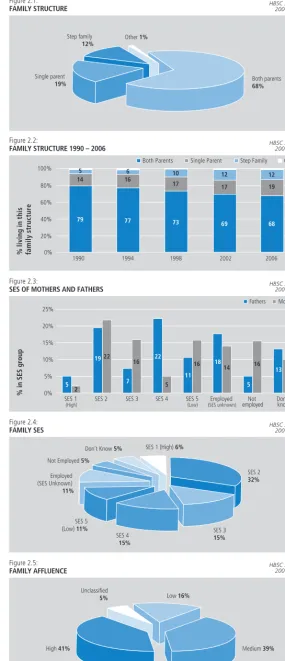
Young people were asked who they lived with1. In 2006, 68% of young people in Scotland live with both
their parents, 19% with a single parent (17% with mother and 2% with father) and 12% in a step family. A further 1% report living in another home environment, such as a foster home, children’s home or they report that they are being cared for by members of the extended family (Figure 2.1). These figures are very similar to Census data (ONS, 2007).
The proportion of young people living with both parents has gradually declined since 1990, while the proportions living in single parent and step family households have increased (Figure 2.2). This trend is found in many other European countries (Berthoud and Iacovou, 2005).
PARENTAL EMPLOYMENT AND FAMILY SOCIOECONOMIC STATUS
Among children defined as living with both parents, 78% have parents who are both employed, 19% have one parent in employment and 4% have parents who are not working. Seventy one percent (71%) of children who live with just their mother have working mothers and 70% of those living with only their father have working fathers.
Young people were asked the occupation of their parent(s) and from this information a socio-economic status (SES) between 1 (high) and 5 (low) was assigned to each parent, using the Registrar General’s social class classification. Almost two thirds could be assigned a socio-economic status (60% of mothers and 64% of fathers). The remainder fall into one of three categories: ‘employed and SES unknown’, ‘not employed’ or ‘don’t know’. Where the job description is impossible to classify (18% of fathers and 14% of mothers), parents are described as ‘employed - SES unknown’. Parents who do not work because they are sick, retired, studying, unemployed or caring for others are described as ‘not employed’. Where no information is provided, occupational status is classified as ‘don’t know’.
9
Figure 2.1:FAMILY STRUCTURE HBS200C S6c Surveyotland
Single parent
19%
Step family
12%
Other 1%
Both parents
68%
0% 20% 40% 60% 100% 80% Figure 2.2:
FAMILY STRUCTURE 1990 – 2006
Step Family Other Both Parents Single Parent
% l iving in this fa m il y s tr u ct u re
19941998 2002 2006 1990
HBSC Scotland 2006 Survey
79 14 77 16 73 17 10 5 6 69 17 12 68 12 19 0% 5% 10% 15% 25% 20% Figure 2.3:
SES OF MOTHERS AND FATHERS
Fathers Mothers
% in SES group
SES 1
(High)
SES 2 SES 3 SES 4 SES 5
(Low)
Employed
(SES unknown)
Not employed Donknow 't
22 22 11 19 16 16 14 13 10
18 16
2
5 7 5 5
HBSC Scotland 2006 Survey
Figure 2.4:
FAMILY SES HBS200C S6c Surveyotland
SES 1 (High) 6%
Don’t Know 5%
Not Employed 5%
Employed (SES Unknown)
11%
SES 5 (Low) 11%
SES 4 15% SES 3 15% SES 2 32% Figure 2.5:
FAMILY AFFLUENCE HBS200C S6c Surveyotland
Unclassified
5% Low 16%
Medium 39%
High 41%
FAMIL
Y LIFE
[image:20.595.140.426.78.741.2]The occupational status of children’s parents is presented in Figure 2.3. Of the 64% of fathers who have been assigned socio-economic status, most fall into the ‘skilled manual’ (SES 4) and ‘managerial/technical’ (SES 2) categories. Among the 60% of mothers with an assigned SES, the most common category is ‘managerial/technical’ (SES 2), followed by ‘skilled non-manual’ (SES 3) and ‘unskilled’ (SES 5). Two thirds (65%) of mothers who are not employed are ‘taking care of others’ or ‘full time in the home’, compared with 27% of fathers who are not working.
The family’s socio-economic status (Family SES) is that of the parent with the higher SES (where more than one parent is present in the main home). This indicator is useful, as it provides a single SES score for the home environment within which the young person is living. Seventy nine percent (79%) of young people are assigned a family SES classification in this way. Of the remaining 21%, half have an employed parent of unknown SES and the other half are equally divided between families with unemployed parent(s) and families where no information was provided on socio-economic status (Figure 2.4). A third of young people are assigned a family SES score of 2 and a further third are assigned a family SES score of 3/4.
FAMILY AFFLUENCE
As illustrated above, children and young people are often unable to give sufficient information about their parents’ occupational status (therefore it is difficult to provide an SES score). As an alternative, family affluence can be used as a proxy measure of socio-economic status. To assess family affluence, young people were asked to report (a) the number of cars in their family, (b) the number of computers at home, (c) the number of family holidays taken in the previous 12 months and (d) if they have their own bedroom. The Family Affluence Score (FAS) is a validated measure derived from these items and children are classified as having low, medium or high affluence (Currie et al., 1997; 2008). Fewer children are unclassifiable using FAS than SES (21% of children were unclassifiable according to parental occupation, whereas only 5% could not be given a Family Affluence Score).
In 2006, 41% of young people were classified as having high affluence families, 39% medium affluence and 16% low affluence (Figure 2.5). These cut-offs are devised for international comparisons, where the UK is relatively affluent. High, medium and low tertiles of the FAS distribution are often used for within-country analyses.
PERCEIVED WEALTH
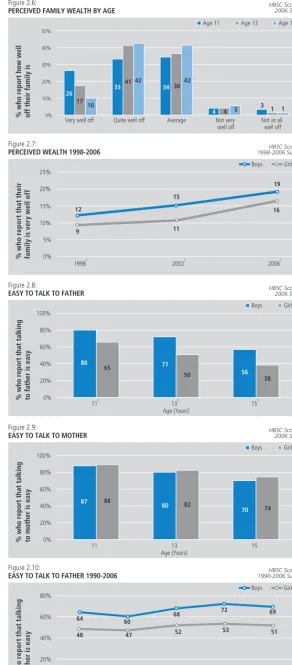
A subjective measure of family affluence was obtained by asking young people ‘How well off do you think your family is?’. Thirty seven percent (37%) of young people responded ‘average’, 39% ‘quite well off’ and 18% ‘very well off’ (Figure 2.6). Just 6% of young people thought that their family was not well off, although perception of wealth changes with age. 11-year-olds are more likely to describe their family as very well off than 13 or 15-year-olds. The family affluence score, on the other hand, is reported similarly by all three age groups.
Young people were asked to report perceived wealth in two previous surveys in Scotland (1998 and 2002) and trend analysis shows an increase in the proportion describing their family as very well off between 1998 and 2006. The figures show increases from 9% to 16% among girls and 12% to 19% among boys
(Figure 2.7).
COMMUNICATION BETWEEN PARENTS AND ADOLESCENTS
Young people find it easier to talk to their mother (80%) than to their father (60%) about things that really bother them. Easy communication with parents becomes less likely with age for both boys and girls, particularly with fathers. Seventy three percent (73%) of 11-year-olds, 61% of 13-year-olds and 47% of 15-year-olds find it easy to talk to their father. Boys and girls find it equally easy to communicate with their mother, but boys find it easier than girls to talk to their father at all three ages (Figures 2.8 and 2.9).
11
0% 10% 20% 30% 50% 40% [image:22.595.141.433.75.740.2]HBSC Scotland 2006 Survey
Figure 2.6:
PERCEIVED FAMILY WEALTH BY AGE
Age 13
Age 11 Age 15
% who report how well off their family is
Quite well off
Very well off Average Not very
well off
Not at all well off 26
17 10
4 4 5
33 4142
3 11
34 3642
0% 10% 5% 15% 20% 25% Figure 2.7:
PERCEIVED WEALTH 1998-2006
Boys Girls % w h o r e p o rt t h a t t h e ir fa m il y i s ve ry we ll o ff
1998† 2002† 2006†
HBSC Scotland 1998-2006 Surveys
9 12 15 11 19 16 † S ig ni fi c ant gender dif feren c e ( p < 0 .0 1 ) 0% 20% 40% 60% 100% 80% Figure 2.8:
EASY TO TALK TO FATHER
Boys Girls
% who report that talking to father is easy
11† 13† 15†
Age (Years)
80
65 77
50 56 38
HBSC Scotland 2006 Survey
† S ig ni fi c ant gender dif feren c e ( p < 0 .0 1 ) 0% 20% 40% 60% 100% 80% Figure 2.9:
EASY TO TALK TO MOTHER
Boys Girls
% who report that talking to mother is easy
11 13 15
Age (Years)
87 88
80 82
70 74
HBSC Scotland 2006 Survey
0% 40% 20% 60% 80% Figure 2.10:
EASY TO TALK TO FATHER 1990-2006
Boys Girls % w h o r e p o rt t h a t t a lk in g to fat h e r i s e a sy
1998† 1994†
1990† 2002† 2006†
HBSC Scotland 1990-2006 Surveys
REFERENCES
Amato, P.R. and Keith, B. (1991). Parental divorce and the well-being of children: a meta-analysis.Psychological Bulletin, 110: 26-46.
Barrett, A.E. and Turner, J. (2006). Family structure and substance use problems in adolescence and early adulthood: examining explanations for the relationship.Addiction,101: 109-120.
Berthoud, R. and Iacovou, M. (2005).Institute for Social and Economic Research, University of Essex Diverse Europe: mapping patterns of social change across the EU. London: ESRC European Panel Analysis Group.
Currie, C., Elton, R.A., Todd, J. and Platt, S. (1997). Indicators of socioeconomic status for adolescents: the WHO Health Behaviour in School-aged Children Survey.Health Education Research, 12: 385-97.
Currie, C., Molcho, M., Boyce, B., Holstein, B., Torsheim, T. and Richter, M. (2008) Researching health inequalities in adolescents: the development of the HBSC Family Affluence Scale.Social Science and Medicine, 66: 1429-1436.
Griesbach, D., Amos, A. and Currie, C. (2003). Adolescent smoking and family structure in Europe.Social Science and Medicine, 56: 41-52. Holstein, B., Parry-Langdon, N., Zambon, A., Currie, C. and Roberts, C. (2004). Socioeconomic inequality and health. In C. Currie, C. Roberts, A. Morgan, R. Smith, W. Settertobulte, O. Samdal and V. Barnekow Rasmussen.Young People's Health in Context: Health Behaviour in School-aged Children (HBSC) study. International Report from the 2001/2002 Survey.Health Policy for Children and Adolescents No.4. Copenhagen, Denmark: WHO Regional Office for Europe.
Houseknecht, S.K. and Hango, D.W. (2006). The impact of marital conflict and disruption on childrenÕs health.Youth & Society, 38: 58-89. Iacovou, M. (2004). Patterns of family living. In R. Berthoud and M. Iacovou (eds).Social Europe: Living Standards and Welfare States.
Cheltenham, UK: Edward Elgar (pp. 21-45).
Levin, K., Todd, J., Inchley, J., Currie, D., Smith, R. and Currie, C. (2007).HBSC Briefing Paper 11: Family affluence and health among schoolchildren. Edinburgh: Child & Adolescent Health Research Unit (CAHRU).
McArdle, P., Wiegersma, A., Gilvarry, E., Kolte, B., McCarthy, S., Fitzgerald, M., et al (2002). European adolescent substance use: the roles of family structure, function and gender.Addiction, 97: 329-336.
McMunn, A.M., Nazroo, J.Y., Marmot, M.G., Boreham, R. and Goodman, R. (2001). Children’s emotional and behavioural well-being and the family environment: findings from the Health Survey for England.Social Science and Medicine, 53: 423-440.
Maes, L., Vereecken, C., Vanobbergen, J. and Honkala, S. (2006). Tooth brushing and social characteristics of families in 32 countries.International Dental Journal, 56: 159-167.
Martinez, C.R., and Forgatch, M.S. (2002). Adjusting to change: Linking family structure transitions with parenting and boys’ adjustment.Journal of Family Psychology, 16: 107-117.
Office for National Statistics (2007).Focus on Families(2007 edition). HMSO.
Pedersen, M., Granado Alcon, M.C. and Moreno Rodriguez, C. (2004). Family and health. In C. Currie, C. Roberts, A. Morgan, R. Smith, W. Settertobulte, O. Samdal and V. Barnekow Rasmussen.Young People's Health in Context: Health Behaviour in School-aged Children (HBSC) study. International Report from the 2001/2002 Survey. Health Policy for Children and Adolescents No.4. Copenhagen, Denmark: WHO Regional Office for Europe.
Todd, J., Smith, R., Levin, K., Inchley, J., Currie, C. and Currie, D. (2007).HBSC Briefing Paper 12: Family structure and relationships and health among schoolchildren. Edinburgh: Child & Adolescent Health Research Unit (CAHRU)
Ward, C.L. and Laughlin, J. (2003). Social context, age and juvenile delinquency: a community perspective.Journal of Child and Adolescent Mental Health, 15: 13-26.
NOTES
1 Children were asked about where they lived all or most of the time (their main home) and, if applicable, a second home (where they lived some of the time). Results described in this report refer to their main or only home.
12
0% 40%
20% 60% 100%
80% Figure 2.11:
EASY TO TALK TO MOTHER 1990-2006
Boys Girls
% w
h
o r
e
p
o
rt
t
h
a
t t
a
lk
in
g
to
mo
ther
is
easy
1998 1994
1990 2002 2006
HBSC Scotland 1990-2006 Surveys
77
81
74 78
79
81
80
83
79
13
THE SCHOOL
ENVIRONMENT
• A quarter of young people like school ‘a lot’; a higher prevalence of
girls than boys, and liking school declines with age
• Two thirds of young people rate their school performance highly relative
to their classmates but this proportion declines with age
• Schoolwork pressures affect nearly a third of young people, particularly
at age 15 when 34% of boys and 45% of girls report feeling stressed
• 68% of young people find their classmates kind and helpful
• 84% of 15-year-old girls aspire to go on to university or further
education on leaving school, compared with 54% of boys
INTRODUCTION
School is a particularly influential social context for young people’s health (Hurrelmann et al., 1995; Lerner and Galambos, 1998; Nutbeam et al., 1993; Samdal et al., 1998; Torsheim et al., 2000; Torsheim and Wold, 2001).It plays a significant role in shaping pupils’ self-perceptions and health behaviours, which inevitably affect future, as well as current, health and well-being. In acknowledgement of the inextricable link between learning and health, the creation of supportive school environments lies at the heart of the ‘Health Promoting School’ (HPS) concept. The European Network of HPS, supported by the WHO Regional Office for Europe, Council of Europe and the European Commission (Stewart Burgher et al., 1999), aims to encourage schools to develop a whole school approach to promoting all aspects of pupils’ health. The HPS recognises the importance of a positive ethos and the need for respectful, caring relationships within the school and the wider community, to enable young people to fulfil their potential (Scottish Health Promoting Schools Unit, 2004). In Scotland, a target was set for all schools to become Health Promoting Schools by 2007 (Scottish Executive, 2003).
HBSC FINDINGS
Young people are asked a number of questions in the HBSC survey that relate closely to the inclusive ethos encapsulated in the Health Promoting School concept. Questions include how much pupils enjoy school, the psychosocial environment of school, perceived academic achievement and stress of schoolwork.
ENJOYMENT OF SCHOOL
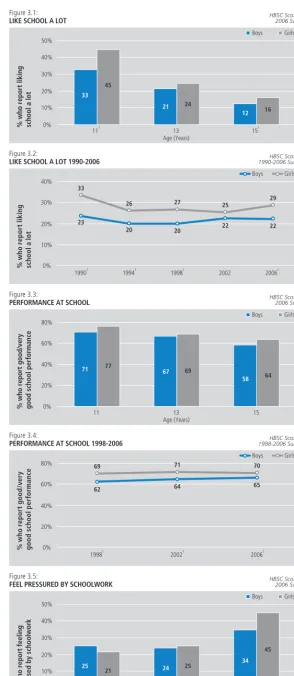
One in four young people report that they like school ‘a lot’. However, this decreases with age as Figure 3.1
clearly demonstrates; 39% of 11-year-olds, 23% of 13-year-olds and 14% of 15-year-olds say they like school ‘a lot’. Boys are less likely than girls to report liking school a lot at 11 and 15, although they do not differ at age 13.
Figure 3.2also shows the consistent difference over time between boys and girls in liking school ‘a lot’ (except in 2002). Between 1990 and 2006, boys’ views have not changed, whereas the proportion of girls liking school ‘a lot’ reduced between 1990 and 2006. This is due, primarily, to a fall between 1990 and 1994.
PERFORMANCE AT SCHOOL
Young people were asked how they thought their teachers rated their school performance compared with their classmates. Sixty five percent (65%) of boys and 70% of girls feel their performance is ‘good’ or ‘very good’, although perceived performance declines with age. Seventy four percent (74%) of 11-year-olds, 68% of 13-year-olds and 61% of 15-year-olds report high school performance (Figure 3.3). There are no significant gender differences within any of these age groups.
Trend data show that there has been no change over the past three surveys in young people’s perceptions of their performance at school (Figure 3.4). However, a gender difference is apparent at all three time points for all age groups combined; a higher proportion of girls than boys reporting ‘good’ or ‘very good’ performance, although the difference is not large.
PRESSURE OF SCHOOLWORK
Young people were asked how pressured they felt by schoolwork. Overall, nearly one in three (29%) report that they feel ‘some’ or ‘a lot’ of stress about schoolwork. A higher proportion of 15-year-old pupils (40%) feel stressed compared with 11-year-olds (23%) and 13-year-olds (25%), perhaps reflecting exam pressures or concerns about the future. No gender difference in feeling stressed is found among younger pupils. However, a higher proportion of 15-year-old girls feel stressed by their schoolwork than boys (45% versus 34% respectively) (Figure 3.5).
The proportions of boys and girls feeling stressed by their schoolwork in 2006 are very similar to those found in 1994 and 1998 but are lower than the 2002 figures (Figure 3.6). No gender difference is found in any of the survey years for all age groups combined. However, a consistent gender difference is found for S4 pupils at all time points, with girls more likely than boys to experience stress due to schoolwork (data not shown).
15
0% 10% 20% 50% 40% 30% Figure 3.1: LIKE SCHOOL A LOTBoys Girls
% who report liking school a lot
11† 13 15†
Age (Years) 33
45
21 24
12 16
HBSC Scotland 2006 Survey
† S ig ni fi c ant gender dif feren c e ( p < 0 .0 1 ) 0% 20% 10% 30% 40% Figure 3.2:
LIKE SCHOOL A LOT 1990-2006
Boys Girls % w h o r e p o rt l ik in g sc h o o
l a l
o
t
1998†
1990† 1994† 2002 2006†
HBSC Scotland 1990-2006 Surveys
23 33 20 27 22 25 † S ig ni fi c ant gender dif feren c e ( p < 0 .0 1 ) 20 26 22 29 0% 20% 40% 80% 60% Figure 3.3:
PERFORMANCE AT SCHOOL
Boys Girls
% who report good/very good school performance
11 13 15
Age (Years)
71 77 67 69
58 64
HBSC Scotland 2006 Survey
0% 40% 20% 60% 80% Figure 3.4:
PERFORMANCE AT SCHOOL 1998-2006
Boys Girls % w h o r e p o rt g o o d /v e ry good s chool per formanc e
1998† 2002† 2006†
HBSC Scotland 1998-2006 Surveys
62 69 64 71 † S ig ni fi c ant gender dif feren c e ( p < 0 .0 1 ) 65 70 0% 10% 20% 50% 40% 30% Figure 3.5:
FEEL PRESSURED BY SCHOOLWORK
Boys Girls
% who report feeling stressed by schoolwork
11 13 15†
Age (Years) 25
21 24 25
34
45
HBSC Scotland 2006 Survey
† S ig ni fi c ant gender dif feren c e ( p < 0 .0 1 )
THE SCHOOL ENVIRONMENT
CLASSMATE SUPPORT
An important element of school life is the degree to which young people feel a sense of belonging
(Osterman, 2000). Relationships with peers, friends and teachers all contribute to this feeling. In the HBSC survey, pupils are asked if they agree or disagree with the statement: ‘most of the pupils in my class(es) are kind and helpful’. Overall, 68% of young people agree with this statement, but this proportion declines with age; 83% of 11-year-olds, 64% of 13-year-olds and 56% of 15-year-olds feel their classmates are kind and helpful. No gender differences are found at any age (Figure 3.7) and the proportions of boys and girls in 2006 reporting that their classmates are kind and helpful are very similar to those found in the previous 2002 survey.
ASPIRATIONS ON LEAVING SCHOOL
Fifteen-year-olds were asked about their aspirations on leaving school1. Nearly half (46%) hope to go to
University while 22% hope to go to a Further Education college. The remaining 32% chiefly comprise those who plan to join an apprenticeship or trade (11%), those who are uncertain what they will be doing (10%) and those who expect to be in work (9%). Less than 0.5% expect to be unemployed. There are substantial gender differences in pupils’ aspirations, with more girls than boys expecting to go to University or Further Education college and more boys expecting to be working, employed as an apprentice, or developing a trade when they leave school (Figure 3.8). Trend data show that little has changed in the aspirations of S4 pupils since 1998 and that the gender divide remains fairly constant
(Figure 3.9).
REFERENCES
Hurrelmann, K., Leppin, A. and Nordlohne, E. (1995). Promoting health in schools: the German example.Health Promotion International, 10: 121-131. Lerner, R.N. and Galambos, N.L. (1998). Adolescent development: challenges and opportunities for research, programs and policies.Annual Review of Psychology, 49: 413-446.
Nutbeam, D., Smith, C., Moore, L. and Bauman, A. (1993). Warning! Schools can damage your health: Alienation from school and its impact on health behaviour.The Journal of Paediatrics and Child Health, 29 (1): 25-30.
Osterman, K.F. (2000). Students’ need for belonging in the school community.Review of Educational Research, 70: 323-367.
Samdal, O., Nutbeam, D., Wold, B. and Kannas, L. (1998). Achieving health and education goals through schools: a study of the importance of school climate and students’ satisfaction with school.Health Education Research, 13: 383-397.
Scottish Executive (2003).Improving Health in Scotland: The Challenge. Edinburgh: The Stationery Office.
Scottish Health Promoting Schools Unit (2004).Being Well – Doing Well: A framework for health promoting schools in Scotland. Scotland: SHPSU. Stewart Burgher, M., Barnekow Rasmussen, V. in Rivett, D. (Eds) (1999).The European Network of Health Promoting Schools: The alliance of education and health. Copenhagen: ENHPS.
Torsheim, T. and Wold, B. (2001). School-related stress, school support, and somatic complaints: a general population study.Journal of Adolescent Research, 16 (3): 293-303, plus Erratum,Journal of Adolescent Research, 26 (6): 773.
Torsheim, T., Wold, B. and Samdal, O. (2000). The Teacher and Classmate Support Scale: Factor structure, test-retest reliability and validity in samples of 13 and 15 year old adolescents.School Psychology International, 21: 195-212.
NOTES
1 Young people were asked to select one of the following: ‘University’, ‘Further education college’, ‘Apprenticeship or trade’, ‘Youth training or skill seekers’, ‘Working’, ‘Unemployed’ or ‘Don’t know’
17
0% 30% 20% 10% 40% 50% Figure 3.6:FEEL PRESSURED BY SCHOOLWORK 1994-2006
Boys Girls % w h o r e p o rt b e in g str e ssed b y sc hoolw o rk
19941998 2002 2006
HBSC Scotland 1994-2006 Surveys
31 33 31 33 36 38 28 30 0% 40% 40% 100% 80% 60% Figure 3.7:
CLASSMATES KIND AND HELPFUL
Boys Girls
% who agree that classmates are kind & helpful
11 13 15
Age (Years)
81 84
66 63
55 57
HBSC Scotland 2006 Survey
0% 10% 20% 30% 40% 50% 60% Figure 3.8:
EXPECTATIONS ON LEAVING SCHOOL AMONG S4 PUPILS
Boys Girls
% in each group
Youth training / skill seekers
Unemployed
Don’t know Apprenticeship / trade† FE college†
Working† University†
38 53
16 28 20 2 1 1 12 7 1 <0.5 12 9
HBSC Scotland 2006 Survey
† S ig ni fi c ant gender dif feren c e ( p < 0 .0 1 ) 0% 60% 40% 20% 80% 100% Figure 3.9:
EXPECTATIONS ON LEAVING SCHOOL AMONG S4 PUPILS 1998-2006 Boys
University / FE College
Apprenticeship / Trade / Working Girls % w h o t h in k t h e y w il l b e d o in g th ese opti ons af te r l e a ving sc hool Boys Girls
1998† 2002† 2006†
HBSC Scotland 1998-2006 Surveys
† S ig ni fi c ant gender dif feren c e ( p < 0 .0 1 ) 55 78 61 80 55 82 10 29 8 27 9 32
THE SCHOOL ENVIRONMENT
19
4
PEER RELATIONS
• Boys are more likely than girls to spend time with friends immediately
after school or in the evening
• Most young people say they find it easy to talk to their best friend
about things that really bother them
• Easy communication with best friend increases with age, and girls find
it easier to talk to their best friend than boys
INTRODUCTION
Spending time with friends and peer social group membership are important elements of the network of social relations that young people need. This network also includes relationships within the family, school and immediate neighbourhood. Being liked and accepted by peers influences health and risk behaviours and is associated with psychological well-being (Raja et al., 1992). Isolation from peers during adolescence can lead to feelings of loneliness and psychological symptoms (Muuss and Porton, 1999), as interaction with friends is vital for the development of social skills and the ability to cope with stressful events (Berndt, 1992). The initiation and maintenance of risk behaviour has also been attributed to the peer group (King et al., 1999; Settertobulte and Gaspar de Matos, 2004).However, the direction of the influence is not clear. Adolescents may seek out friends with patterns of behaviour similar to their own or they may conform to peer group norms.
Most research concerning peer influence focuses on risks resulting from engagement in peer groups. For example, smoking and other drug use have been linked to social integration in the peer group (Killen et al., 1997; Kuntsche and Jordan, 2006; Paavola et al., 1996). However, peer contact is also important for the development of protective factors such as emotional well being (Martin and Huebner, 2007) and young people socialise around health promoting behaviours, such as physical activity (Settertobulte and Gaspar de Matos, 2004), as well as risk behaviours.
HBSC FINDINGS
HBSC measures several aspects of peer relations including number of friends, time spent with friends, use of electronic communication and ease of talking to best friend.
NUMBER OF CLOSE FRIENDS
Most young people report having several close friends. Less than 1% say they have no friends, 1% say they have just one, 2.5% two and 96% have three or more close friends. The vast majority (89%) of boys and girls have three or more close friends of the same sex and this does not vary substantially with age
(Figure 4.1).Opposite sex friendships, however, do vary with age; approximately 60% of 11-year-old boys and girls have three or more friends of the opposite sex compared with 70% of 13 and 15-year-old pupils (data not shown).
PEER CONTACT FREQUENCY
Boys are more likely than girls to have frequent contact1with friends immediately after school or in the
evening (Figures 4.2 and 4.3). Forty-one percent (41%) of young people (45% of boys and 37% of girls) have frequent contact with their friends after school and slightly more (46%) in the evenings (51% of boys and 42% of girls).
Fifteen-year-olds are less likely than younger boys and girls to have frequent after school contact (Figure 4.2). Age differences in evening contact with friends, however, differ for boys and girls (Figure 4.3). While 11-year-old boys are less likely than older boys to spend four or more evenings out with friends, a similar proportion of girls have frequent evening contact with their friends at all ages.
Boys’ rates of frequent contact with friends in the evening have declined between 1994 and 2006 but remained consistently higher than those of girls (Figure 4.4). Whilst girls’ evening peer contact has not changed substantially between 1994 and 2006, there has been a recent small decline. Similar long-term data for after-school contact is not available, although the proportions in 2006 are very similar to those found in 2002.
COMMUNICATION WITH BEST FRIEND
Most young people say they find it easy (or very easy) to talk to their best friend about things that really bother them (90% of girls and 82% of boys). However, there are a small number who say that they do not have a best friend at all (2% of girls and 3% of boys). Easy communication with best friend increases with age, and girls are more likely than boys to report that it is easy to talk to their best friend at all ages