Immersion and affect
in a brain-computer
interface game
Gido Hakvoort
Committee:
Dr. M. Poel
Prof. dr. ir. A. Nijholt
Dr. J. Zwiers
H. G¨
urk¨ok, M.Sc.
D. Plass-Oude Bos, M.Sc.
Immersion and affect in a
brain-computer interface game
Gido Hakvoort
Enschede, June 16, 2011
Master Thesis
Human Media Interaction
Faculty EEMCS
University of Twente
Graduation Committee:
Dr. Mannes Poel (1st supervisor) Prof. dr. ir. Anton Nijholt
Abstract
Preface
While being an undergraduate I quickly became aware that it was the reci-procity between different research fields that really appealed to me. On the intersection of research fields you need to find creative solutions to unify them. Although I had never realised that an academic career could be something for me, in my second year I realised you need knowledge before you can share it, and preferably a lot as some people, including myself, never stop asking ’why?’. These realisations led me to adjusting my goals and I decided to pursue a mas-ter’s degree. In my final year I started looking for a suitable master programme where I could broaden my knowledge of the interaction between human and computer which is why I enrolled myself at the University of Twente for the master Human Media Interaction (HMI).
During my second year at HMI, I followed a course on machine learning where I came in contact with Boris Reuderink, a PhD student researching brain-computer interfaces in the context for games. Since he was appointed as my supervisor for the machine learning course, we had conversations about his re-search but also about the differences between HMI and my undergraduate edu-cation. I became aware that although I had technical skills, I lacked theoretical competencies and experience which are important for an academic career. At that time I also had to choose a direction for my master thesis and I decided to take brain-computer interfaces as my research topic. It offered ways to gain the-oretical competencies and experience, while I was still able to use my practical skills.
I started my master thesis together with Michel Obbink and during the first couple of months we went through a lot of theoretical material and developed Mind the Sheep!, the game we used for both our researches. After these months we took of in different directions and continued our researches separately. My research has led to this thesis in which I try to describe the thought processes which I have been going through, the experiments that I have conducted and of course the results I have found.
Part of the research described in this thesis will be presented at the 13th IFIP TC13 Conference on Human-Computer Interaction (INTERACT 2011) that will be held in September 2011 in Lisbon. The paper will also appear in the proceedings of INTERACT 2011 and can be found in Appendix I.
Gido Hakvoort
Acknowledgements
When I started my master thesis and chose brain-computer interfaces as my research topic, I knew it would not be easy. However, without the help and support of some important people it would have been much more difficult which is why I would like to thank them.
First of all, I owe many thanks to my best friend and brother, Michiel Hakvoort. I know it must have been hard sometimes, listening while I was reciting my thought processes and ideas. But you were always available, listened and gave valuable feedback, support and technical suggestions which aided in the devel-opment of Mind the Sheep!.
Of course I like to thank the members of my graduation committee, Mannes Poel, Anton Nijholt, Job Zwiers, Hayrettin G¨urk¨ok and Danny Plass-Oude Bos who have supported me during my master thesis. I had regular meetings with three of them and I would like to thank them in particular. Hayrettin G¨urk¨ok, I lost count of how many times I dropped by your office, but after each meeting I left with a renewed sense of motivation. If it were for advice, input or just to talk, you always made time. I enjoyed our discussions and I’m grateful for the opportunity to assist in your research. Danny Plass-Oude Bos, your critical questions and remarks have definitely increased the quality of my research and thesis. Beside our meetings we also went to Researchers’ Night to give demon-strations. I remember you had a deadline that same day. I still don’t know how you pulled off giving the demonstration, participate in social events and at the same time finish the paper before the deadline. I do know you were so dedicated that you wouldn’t stop until they turned off the wireless network and kicked us out of the building. Mannes Poel, I’m aware that I sometimes wandered off or wanted to do too much, you made sure that I stayed close the core of my master thesis.
I was also given the opportunity to turn my research into a paper for a conference and I would like to thank Anton Nijholt for giving me the opportunity to present the paper myself.
Furthermore I’d like to thank Michel Obbink, for the discussions on both our works, his cooperation and valuable input. I’m glad we became good friends. Boris Reuderink who inspired me to choose brain-computer interfaces as my research topic and who was available for technical questions, Christian M¨uhl for his input on the human aspect of brain-computer interfaces and Jorian Blom and Dick Meijer for their input on statistical analysis.
Contents
I
Define
1
1 Introduction 2
1.1 Background . . . 2
1.2 Motivation . . . 2
1.3 Objectives . . . 3
1.4 Research Question . . . 3
1.5 Hypotheses . . . 3
1.6 Outline . . . 3
2 Brain-Computer Interfaces 5 2.1 What Are They? . . . 5
2.2 BCIs for Selections . . . 6
2.2.1 P300 . . . 6
2.2.2 Steady-state Visually Evoked Potential . . . 6
2.3 BCIs in Games . . . 6
3 Experiencing Games 9 3.1 Immersion . . . 9
3.2 Affect . . . 10
3.3 Flow . . . 11
3.4 Game Experience and BCIs . . . 12
II
Research
13
4 Method 14 4.1 Approach . . . 144.2 The Game: Mind the Sheep! . . . 14
4.3 Selection Methods . . . 15
4.3.1 P300 selection . . . 16
4.3.2 SSVEP selection . . . 16
4.3.3 Non-BCI selection . . . 16
4.4 Questionnaires . . . 17
4.5 Analysis . . . 17
5 Experiment 19 5.1 Participants . . . 19
5.3 Detecting BCI Selections . . . 21
5.3.1 P300 . . . 21
5.3.2 Steady-state Visually Evoked Potential . . . 21
III
Report
22
6 Results 23 6.1 Immersion . . . 236.2 Affect . . . 24
6.3 Game Statistics . . . 25
7 Discussion 26 7.1 Immersion . . . 26
7.2 Affect . . . 27
7.3 Game Statistics . . . 27
8 Conclusion 29
IV
Appendices
35
A Acronyms used in thesis 36 B Determining SSVEP parameters 38 B.1 Experiment Setup . . . 39B.2 SSVEP Classifier . . . 39
B.3 Stimulus Size . . . 40
B.4 Stimulus Frequencies . . . 41
C Detailed Experiment Protocol 44
D Experiment Information for Participants 46
E Participant Consent Form 49
F Participant Demographic Information Questionnaire 52
G Participant self-assessment manikin (SAM) Questionnaire 55
H Participant Immersion Questionnaire 58
List of Figures
2.1 Block diagram of a BCI system . . . 5
2.2 Jay Lauf and Buzz Aldring playing Brainball (a). In-game avatar changes based on player’s stress level in AlphaWoW (b) . . . 7
2.3 A screenshot of MindBalance (a). Subject playing Bacteria Hunt (b). . . 7
3.1 Levels of involvement with their barriers . . . 10
3.2 Emotions in the valance and arousal space . . . 11
3.3 Flow as a dynamic balance between challenge and skills . . . 11
4.1 Screenshot of Mind the Sheep! . . . 15
4.2 Screenshot of the selection methods when active . . . 15
5.1 Participant playing Mind the Sheep! . . . 20
List of Tables
6.1 Scores of the five immersion factors and total immersion, averaged over participants. Values are represented as µ(σ) with highest values marked grey. A significant difference (p <0.05) or trend (p < 0.10) depending on the used selection method is indicated with∗ or† respectively. . . . 23
6.2 Average SAM scores, the values are represented as µ(σ) with highest values marked grey. . . 24 6.3 Average number of selections per minute, average selection
du-ration (in seconds) and normalised game dudu-ration. All presented asµ(σ) with highest values marked grey. A significant difference (p < 0.05) depending on the used selection method is indicated by∗. . . . 25
B.1 Average recall and precision for power spectral density analysis (PSDA) based classification . . . 41 B.2 Average recall and precision for canonical correlation analysis
Part I
Chapter 1
Introduction
1.1
Background
A brain-computer interface (BCI) can be described as a direct communication link between the brain and the machine. In a BCI system, signals from the brain are analyzed to determine the user’s state of mind or intentions. In order to do this, BCIs rely on the presence of distinctive brain-signals which in turn can be translated into actions [38]. BCI systems have been applied for medical use to help disabled users by giving back mobility [13] and breaking the isolation of people with physiological disorders [11, 16].
As successful applications of BCIs make their appearance in the news and commercial BCI input devices become publicly available, BCIs find their way into recreational use. However, as the scope of BCI applications is extending from medical to recreational use, the expectations for BCIs are also changing. Currently they are unable to meet the high performance and accuracy of ex-isting input modalities such as mouse and keyboard, and are therefore unfit as replacement. Instead they should be seen as separate modalities which can be used beside, or in combination with, existing input modalities [26].
1.2
Motivation
A common method to assess BCIs is by expressing their performance in bits per minute, which can be calculated by using the mean classification accuracy and the number of available classes [40]. Although this gives meaningful details on the information transfer rate (ITR) of a BCI, other factors may be just as important when applying BCIs for recreational use. Where increasing the performance and ITR of BCIs has always been an important goal for medical studies, how BCIs are applied as modalities and the influence they have on the user experience becomes more and more important when they are applied for recreational use.
are used to the concept that games have to be mastered [25], they will be more indulgent towards BCI modalities and the inaccuracy of BCIs can even become a challenging factor.
1.3
Objectives
The purpose of this study is to evaluate two BCIs for user experience in the terms of immersion and affect. As making selections is an important aspect in many applications and BCIs can be used to make selections, two distinct BCI selection methods will be used in this study. Together with a comparable non-BCI selection method they will be integrated into a computer game to determine if they can enhance user experience. The BCI selection methods will be used as a primary control and are based on P300 and SSVEP which will be further explained in Chapter 2.
The selection methods will be used in parallel with, instead of replacing an, existing modality to make the interface more interesting and engaging. The results and setup of the study will be presented in this thesis.
1.4
Research Question
The question that arises is whether a BCI can enrich the user experience in terms of immersion and affect, furthermore, is there a difference between different types of BCIs in terms of immersion and affect.
1.5
Hypotheses
As there are no intermediate actions required while using a BCI, it lets users engage with an environment on a different level. However, this does not mean it enriches the user experience. For this the BCIs need not only to be engaging but also enjoyable, have a nice flow and be user friendly. As SSVEP is found to be annoying, especially at low frequencies [22], it is expected that it will not match these requirements and possibly even deprive user experience. A BCI based on P300 is less pronounced and therefore expected to enhance user experience in terms of immersion and affect.
1.6
Outline
This thesis is divided into three main parts, Define, Research and Report.
Define is the first part and it will set the context of this thesis by provid-ing related work. What are brain-computer interfaces, how can they be used and how are they applied within games. Readers who are familiar with BCIs, SSVEP and P300 can skip Chapter 2. Related work on user experience will be described in Chapter 3 which will provide more information on immersion, affect and flow and how they can be influenced by input modalities.
used to answer to the research question, the game, the selection methods and the experimental setup in more detail.
Chapter 2
Brain-Computer Interfaces
2.1
What Are They?
[image:14.595.141.453.481.673.2]A BCI can be described as a communication link between brain and machine. In a BCI system, signals from the brain are being analyzed to determine the user’s state of mind or intentions, which in turn can be translated into actions [38]. A diagram of a BCI system can be seen in Figure 2.1. BCI systems have been applied for medical use to help disabled people by giving back mobility [13] and breaking the isolation of people with physiological disorders [11, 16]. For the signal acquisition there are many different measurement methods such as electroencephalography (EEG), magnetoencephalography (MEG), functional magnetic resonance imaging (fMRI) or near-infrared spectroscopy (NIRS). All of them are non-invasive methods requiring no surgical procedures. Especially in the area of healthy user BCIs research, EEG measurements have become very popular as its relatively cheap and has a high temporal resolution [38].
To determine a user’s state of mind or intentions BCIs rely on the presence of distinctive brain signals. One of the most frequently used brain signals in EEG-based BCI systems are event-related potentials (ERPs) which are responses of the brain that are the direct result of an external or internal event. These ERP usually occur when the brain is exposed to any kind of visual, somatosensory or aural stimulus, mental activity, or when omitting a stimulus that was repeatedly occurring. Two brain signals, which have both been used in medical applications to facilitate making selections, are P300 and SSVEP.
2.2
BCIs for Selections
2.2.1
P300
One of the most used ERPs is the P300 which can be triggered by rarely oc-curring, or significant stimuli. The P300 response appears roughly 300 ms after stimulus presentation as a positive peak in the user’s brain signals. Although the P300 can be measured throughout the brain, it is most profound at the pari-etal region of the scalp [16]. The unpredictability of the stimulus has a strong effect on the P300 and the oddball paradigm is frequently used to increase its amplitude. By mixing low probability targets with high probability non-targets, the unpredictability of a target increases, thereby increasing the P300 amplitude [2]. By determining the difference between target and non-target stimulation responses, P300 can be used to make selections. This functionality is used in the P300 speller applications [11].
2.2.2
Steady-state Visually Evoked Potential
Another member of the ERP family is steady-state visually evoked potential (SSVEP) [2]. In most cases SSVEPs are triggered by presenting a modulated visual stimulus with a periodic signal, usually at frequencies above 5 Hz, to a user. The periodic signal of the stimulus can then be traced back in the measured brain signals which are mostly recorded from the occipital region of the scalp [35]. The power of an SSVEP only covers a narrow bandwidth matching that of the stimulus [21]. This makes them relatively easy to detect, which is why the BCI selection method used in this study was based on SSVEP.
2.3
BCIs in Games
(a) (b)
Figure 2.2: Jay Lauf and Buzz Aldring playing Brainball2(a). In-game avatar changes based on player’s stress level in AlphaWoW (b).
The ERP games apply the concept of brain responses that are the direct result to a stimuli. Two of these responses are P300 and SSVEP which are described in Section 2.2. An example using P300 is a study by Bayliss [1] where participants could interact with a number of objects (e.g. a lamp, a television set) and turn them on or off. The P300 responses were used to determine with which object a participant wished to interact and an action was performed accordingly (e.g. turning on the television set). The SSVEP paradigm is often applied as selection method, for example in the game MindBalance [18], see Figure 2.3(a). Participants had to balance an avatar on a cord by focusing on one of two checkerboards which flickered at different frequencies (to elicit a SSVEP). Another example where SSVEP is applied, is Bacteria Hunt [23], where players had to control an amoeba and hunt down as many bacteria as possible, see Figure 2.3(b). Although Bacteria Hunt does not appear in Reuderink’s summary (as it was developed later), it is worth mentioning as it is a multi modal, multi paradigm BCI game. Players steer the amoeba with a keyboard and as they become more stressed, steering the amoeba becomes more difficult. At the same time, eating bacteria is done by focusing on a SSVEP stimulus.
[image:16.595.153.440.497.615.2](a) (b)
Figure 2.3: A screenshot of MindBalance (a). Subject playing Bacteria Hunt (b).
The last group defined by Reuderink use the concept of motor activity. In case movement is imagined or performed, distinct brain signals are generated and can in turn be detected. A major advantage of BCI system relying on motor
activity it that they do not depend on stimuli presentation and can therefore be controlled solely from the brain. An example is a virtual meeting room in which users could explore the room by imagining left or right hand movements thereby rotating the view.
Chapter 3
Experiencing Games
While for gamers the definition of game experience seem to be common knowl-edge, game studies try to analyze and conceptualize the many aspects described by gamers. Three well known concepts are immersion, affect and flow which are described in this chapter. Although flow is mentioned in other studies as an aspect of user experience, the focus of this study is on immersion and affect. Why flow was left out will be explained in this chapter.
3.1
Immersion
The concept of immersion appears in different contexts. Someone who is reading a book can be immersed, just as someone who is watching a movie or playing a game. Whether the term is used consistently in these contexts is unclear. However, for playing games there seems to be a shared concept of immersion among gamers [5]. Immersion in games is often accompanied by high levels of concentration, losing track of time and empathy.
In a study by Brownet al. [5] an attempt was made to define immersion within games. In their study they examined the concept of immersion expe-rienced by gamers. Their results indicate that immersion is not just a static experience, but has different levels of involvement. They defined three levels of involvement: engagement, engrossment and total immersion. They also state that to reach a certain level of immersion a number of barriers must be crossed. An illustration of the levels and their barriers is shown in Figure 3.1.
Engrossment Engagement Total immersion Game construction Atmosphere Empathy Investment Access
Figure 3.1: Levels of involvement with their barriers as defined by Brownet al.
[5].
and location, this gives players the opportunity to become fully immersed as they need to invest more attention to the created atmosphere. Besides atmo-sphere the last barrier which needs to be crossed to reach the final level, total immersion, is empathy. Although it is not necessary for players to empathise with the in-game situation, they can feel attached to in-game characters.
Some of the aforementioned barriers are related to human characteristics, such as personal preferences, empathy and the will to invest time and attention. Others are related to the construction of the game such as the graphics, a plot and atmosphere. However, to reach a state of total immersion an important barrier to take is related to the controls. Through them gamers translate their intentions into in-game actions [28] and controls should become virtually invis-ible to the gamer. As intentions originate from the brain, users first need to translate their intentions into real world actions to handle the controls. Even if these real world actions become virtually invisible for the user, they still need to be performed. Using a BCI to detect intentions may allow them to be translated directly into in-game actions, making the real world actions redundant.
In a study by Jennettet al. [17] immersion in games was further investigated. They identified five factors of immersion: cognitive involvement, real world dissociation, emotional involvement, challenge and control. They also developed a questionnaire to measure the total immersion and its factors. As in the study of Brown et al., some factors were related to human characteristics (cognitive involvement, real world dissociation and emotional involvement) and others were related to the construction of the game (challenge and control).
3.2
Affect
arousal dimensions are critical in recreational applications. Arousal Valence glad happy delighted pleased excited contented relaxed calm sad depressed bored tired alarmed angry frustrated stressed
Figure 3.2: Emotions in the valance and arousal space
Bradley et al. [4] developed a questionnaire, the self-assessment manikin (SAM), to measure emotional responses in these three dimensions. In Fig. 3.2 some emotions associated with valence and arousal can be seen. Integrating the selection methods into an enjoyable, challenging and task oriented environment, such as a game, should result in a more positive affect in terms of valence and arousal which will aid users to overcome the inaccuracy of the selection methods.
3.3
Flow
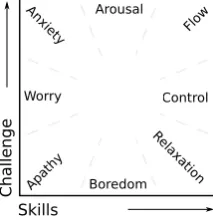
Flow is a concept with which many gamers are all too familiar with and it can be described as a state of consciousness in which users achieve a dynamic balance between challenge and skills [6]. The concept of flow is applicable to various fields and Csikszentmihalyi did extensive research on the topic of flow, which according to him could lead towards an optimal experience. In his stud-ies he found that flow was often associated with one or more of the following eight components, high levels of concentration, losing track of time, merging ac-tion and awareness, loss of self-consciousness, direct feedback, balance between challenge and skills, sense of control and clear goals [9].
Flow Arousal Apath y Worry Anxiety Control Rel axat ion Boredom C h all en ge Skills
[image:20.595.242.349.566.677.2]The balance between challenge and skill is important for flow, as a deflection towards challenge results in anxiety and too little of both can result in boredom (Figure 3.3) which will disrupt the optimal experience [6].
Some of the components defined by Csikszentmihalyi seem to have a direct connection with immersion (e.g. high levels of concentration and losing track of time) and indeed, flow can be seen as a successor of immersion [17]. However, there are some differences as flow is a process leading towards an optimal ex-perience, whereas immersion consists of different levels of involvement between which users can switch [5]. Furthermore, immersion does not necessarily leads towards an optimal experience, it does not even need to be enjoyable. As the purpose of this study is to evaluate BCIs for their user experience, which can be negative or positive, flow was not included in this study and the focus was on immersion and affect.
3.4
Game Experience and BCIs
The aforementioned concepts have been the subject of various game studies, aiming for a more thorough understanding of how the concepts are related to user experience and to find a consensus on the terminology. In a study by Nacke et al. [24] the user experience of a game was evaluated in terms of flow and immersion using questionnaires and an electromyography (EMG). They found that physiological responses can be used as indicators for the user’s state of mind. In a later study by Reuderink [33] et al. participants were subjected to short periods of frustration to determine whether the user’s state of mind had an effect on EEG signals. Preliminary analysis of their experiment indicate that features used for classification could be affected by the user’s state of mind. These studies support the hypothesis that the user’s state of mind has an influence on physiological measurements and thereby on BCIs. However, studies on the opposite, whether BCIs have an influence on the user’s state of mind, are scarce.
Part II
Chapter 4
Method
4.1
Approach
To determine whether BCI selection methods can enrich the user experience, two BCI selection methods were assessed in terms of immersion and affect using standard questionnaires. The results were compared against a non-BCI selection method. All selection methods needed to be alike and comparable. As the selection methods were compared based on their user experience a measurable level of enjoyment was needed in the environment. Since games are developed for being both challenging and enjoyable a simple game would be a perfect ground for the environment. Gamers love working with new technologies, are capable of adapting quickly to a new environment and are used to the concept that games have to be mastered [25]. Therefore a simple game was developed to give the players an enjoyable challenge in which the BCI and non-BCI selection method can be integrated.
4.2
The Game: Mind the Sheep!
Mind the Sheep! consists of a playground representing a meadow on which a few obstacles, such as fences, gates or trees, are placed. There are three dogs in the playground which are controlled by the player. Depending on the objectives of a specific level, the playground can be populated with a number of sheep or collectibles. A screenshot of the game can be seen in Fig. 4.1 with ten white sheep and three black dogs. The goal of the game is to gather all sheep into a pen or gather all collectibles as quickly as possible using the three dogs. Players can use one of the selection methods to select one of the three dogs.
Figure 4.1: Screenshot of Mind the Sheep! with three black dogs and ten white sheep. The pen is located in the center.
eye on the sheep at the same time.
The dogs use a simple A* search based path finding algorithm to move to a specific location on the map. By default, sheep will walk around and graze randomly. However, when a dog approaches, they will tend to flock and move away from the dog allowing them to be herded in a desired direction. The flocking behavior is introduced by using the boids algorithm [34]. By positioning the dogs at strategic locations on the map a flock of sheep can be directed into the pen.
4.3
Selection Methods
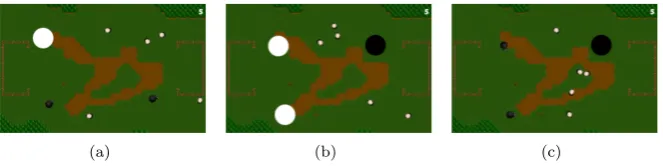
The BCI and non-BCI selection methods were integrated into Mind the Sheep!. However, as players would not want to continuously make selections, they were able to start and stop the selection methods thereby controlling the presence of the stimuli for the BCI selection methods. An illustration of the selection methods when active can be seen in Figure 4.2.
(a) (b) (c)
[image:24.595.132.464.598.681.2]4.3.1
P300 selection
To extend Mind the Sheep! with a selection method based on P300, dogs were highlighted for 100 ms with circles in a random order (to elicit a P300 response) while the selection method was operational. As long as a player held the mouse button pressed, EEG data was collected. When the mouse button was released, the collected data was analysed and a selection was made. As players were able to select one out of three dogs, the target stimulus would occur with a probability of 0.3. As higher target probabilities result in lower P300 amplitudes [10], three invisible targets were added to ensure a target probability of 0.16, equal to the speller application used in work of Hoffmann et al. [16].
For the P300 selection method some parameters needed to be determined, such as the inter-stimulus interval (ISI), the size of the stimuli and the clas-sifier. In a study conducted by Farwell et al. [11], two different ISIs (125 ms and 500 ms) and four classifiers (covariance, SWDA, peak picking and area measurement) were compared. As multiple target stimulations result in higher classification accuracies and a shorter ISI did not interfere with eliciting a P300 response, an ISI of 100 ms was used. The classifiers based on covariance and stepwise linear discriminant analysis (SWDA) require training and the classi-fiers based on peak picking is less accurate with a shorter ISI, which is why area measurement was used to detect P300 responses. To be consistent with the other selection methods the size of the P300 stimuli was set to 3 centimeters.
4.3.2
SSVEP selection
For the SSVEP-based BCI selection method, dogs were replaced with circles flickering at different frequencies while the selection method was operational. EEG data was collected as long as the player held the mouse button pressed. Upon releasing the mouse button, the collected data was analysed and a selection was made.
For the SSVEP selection method some parameters needed to be determined, such as the frequencies to use, the size of the stimuli and the classifier. For this a small pre-experiment study with 7 participants was conducted. A complete overview of the setup and results of the pre-experiment study can be found in Appendix B.
Based on the results of the pre-experiment study a canonical correlation analysis (CCA) based classifier was selected as its overall performance was bet-ter, had lower inter-subject variability and a better signal-to-noise ratio (SNR). For the frequency set, 7.5 Hz, 8.57 Hz and 12 Hz had the best performance. However, participants noticed differences in stimulus frequencies which could lead to a preference towards one of the three dogs based on its classification ac-curacy. Therefore, a frequency set with higher frequencies was chosen, namely 10 Hz, 12 Hz and 15 Hz, making it harder to distinguish them. Based on the pre-experiment study the size of the stimuli was set to 3 centimeters.
4.3.3
Non-BCI selection
good detection, which is directly related to the time the selection method is operative. Although it would be much easier for users to make a selection by pointing and clicking with a mouse, this would offer little challenge and give the non-BCI selection method a great advantage when compared with the BCI selection method. To pose a similar challenge in the non-BCI selection method, it was modelled to be similar to the BCI selection method in terms of the time required for an accurate selection.
Similar to the BCI selection method users were able to start and stop the non-BCI selection method. When operative, the dogs were highlighted one at a time with an increasing highlight period. The diameter of the stimuli was kept the same as in the BCI selection method, 3 centimeters. When users stopped the selection method, the current highlighted dog was selected.
To make an accurate selection, users had to react in time when the dog they wanted to select was highlighted. With a highlight period of 250 ms users should have enough time to react as this is close to the average human reaction time [19]. The highlight period should reach 250 ms only by the time that is equal to the time needed to make a selection using the BCI selection method, which is around 2.5 seconds [20]. Therefore, the highlight period started with 100 ms and was increased with 5% after every highlight, with a maximum highlight period of 500 ms.
4.4
Questionnaires
To measure the affective reaction of players while playing the game, a SAM [4] was used as to measure emotional responses in three dimensions (i.e. valence, arousal and dominance). It was expected that if players became more frustrated by using a selection method, this would result in higher arousal and lower valence scores. The dominance would also be higher if players had the feeling that a selection method was working properly and that they were in control.
The questionnaire by Jennettet al. [17] was used to measure players’ immer-sion. It contains 31 questions and is designed to measure the total immersion as well as five different factors of immersion (cognitive involvement, emotional involvement, real world dissociation, challenge and control). Although valence, arousal and dominance scores would probably differ between selection methods for which players have an aversion, this does not necessarily mean players would not become immersed in the game.
Furthermore some game statistics, such as the number of selections, the duration of the selections and the time needed to finish the game were collected while they played the game. Ideally players would use all the dogs as this would make it easier to gather the sheep. The number of times a particular dog was selected and the time needed to finish the game would be good indications of how well a selection method performed for a player.
4.5
Analysis
average score for the valence, arousal and dominance scales. The number of selections were normalised to the game duration as to get the number of selec-tions per minute and were averaged over the three trials. The game duration was normalised to the time limit per trial and was averaged over the three trials. The averaged results were examined on evident differences. As each partic-ipant used all three selection methods and normally distributed samples could neither be assumed nor proved, the Friedman test was used to determine if there were significant differences (p <0.05) in immersion, affect or game statistics de-pending on the selection method. In case Friedman’s test indicated a significant difference, post-hoc analysis with the Wilcoxon signed-rank tests was conducted on the different combinations of selection methods to examine where the dif-ferences occurred. For the post-hoc analysis no alpha correction was applied as it was conducted only to examine where the differences occurred in case Friedman’s test indicated a significant difference.
Due to differences in the designs of the statistical tests it is possible that the conclusions of Friedman’s test and the post-hoc analysis lead to a contradiction. Should this be the case, all results will be given and a possible explanation of the significant difference will be given in the discussion (Chapter 7).
Chapter 5
Experiment
5.1
Participants
Fourteen participants (6 female and 8 male), aged between 17 and 25 (µ = 21.14, σ = 2.88) participated in the experiment. All participants except for one had normal or corrected-to-normal vision and described themselves as daily computer users. Although eight participants had at least one-time experience with EEG, eleven participants had no experience with BCIs. Before the ex-periment, all participants signed an informed consent form and they were paid according to institution’s regulations.
5.2
Procedure
Prior to the experiment participants were given a small questionnaire to obtain demographic information and they had to sign an informed consent form. They read the instructions on how to play the game and the setup of the experiment was explained. The experiment held in this study consisted of three different sessions. In each session a participant used one of the selection methods (i.e. P300, SSVEP or non-BCI) while playing Mind the Sheep!. Each participant used all three selection methods. However, a counterbalanced measures design was used to avoid confounding variables such as learning a strategy to play the game.
The layout of the playgrounds across the trials was kept the same to ensure no playground was more difficult for one of the selection methods. However to ensure that participants did not create an optimal strategy for a specific trial, the positions of the dogs, collectible objects and sheep were altered for the different selection methods. To ensure that the experiment would take too long, a timeout was set for each trial for the participants to finish the level by collecting all objects or gathering all sheep into a pen. Participants had 3 minutes, 5 minutes and 10 minutes for the familiarity, easy and difficult trials respectively. Since immersion in games is often accompanied by losing track of time, the time left was not visible for the participants. Otherwise it could have influenced their perception of the elapsed time.
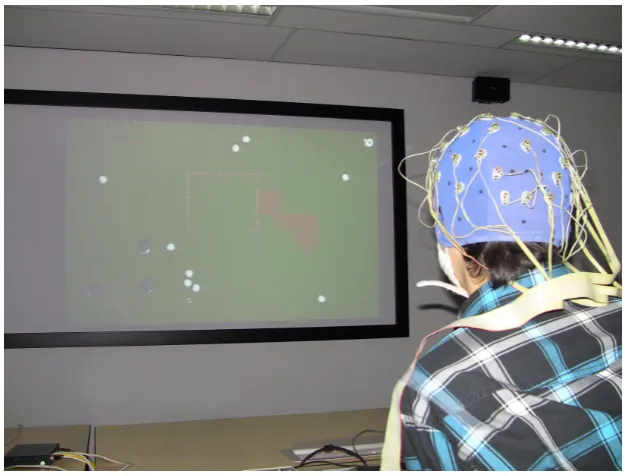
[image:29.595.140.454.398.636.2]The game ran on a PC and was connected to a projector1 which was used to create a more enjoyable environment. The projector was mounted on the ceiling and projected the game on a screen approximately 3 meters away from a participant. The sizes of the stimuli were scaled proportionally with the increased distance to the screen. To make sure the frequencies for the SSVEP based BCI selection method were correctly presented by the projector they were validated with a light sensor. Participants sat on a chair behind a table and by using the mouse, which was placed on the table, they were able to start and stop the selection methods. The data acquisition ran on a separate PC and sent the raw EEG data to the game PC. An impression of the setup can be seen in Figure 5.1.
Figure 5.1: Participant playing Mind the Sheep!
5.3
Detecting BCI Selections
To make selections using a BCI selection method, EEG data needs to be recorded and analysed. For this 32 electrodes were placed according to the international 10-20 system [31] prior to the experiment. For the EEG data acquisition a BioSemi ActiveTwo system2 was used. The electrodes and analysis which are used are different for each BCI selection method.
5.3.1
P300
During each P300 selection EEG data was used from the electrode located at
Pz. Before the data was classified a number of preprocessing operations were applied to the data based on work of Hoffmannet al [16].
First the EEG data was re-referenced to the common average reference (CAR) [8] of all 32 electrodes after which the data was filtered with a 2nd order forward-backward Butterworth band-pass with high-pass and low-pass frequen-cies set to 1.0 Hz and 12.0 Hz, respectively. For each target single trails were extracted, after which the trials were averaged. Trials started at the onset (i.e. at the beginning of the intensification of the stimulus) and ended 1000 ms after the stimulus appeared. To reduce the effect of outliers in the data, caused by eye movement, eye blinks or muscle activity, a 80% Winsorisation was applied to the data where all samples below the 10th percentile were replaced by the 10th percentile and all sample above the 90th percentile were replaced by the 90th percentile. Finally the samples where scaled linearly to an interval of [−1, 1].
For the classification the area measurement based on work of Farwell et al
[11] was used, which summarizes the area under the P300 curve within a certain window. The window for the P300 ranged from 220 to 500 ms. The target with the largest area was classified as the target a player was focusing on.
5.3.2
Steady-state Visually Evoked Potential
During each SSVEP selection EEG data was used from eight parietal-occipital electrodes (i.e. Pz, P3, P4, PO3, PO4, Oz, O1, O2). The EEG data was re-referenced to the CAR of all 32 electrodes, after which the CCA based detection method was used to determine which frequency the participant was focusing on. Using CCA is a relatively new approach where sets of reference signals are constructed for each one of the stimulation frequencies. Each set contains the sine and cosine for the first, second and third harmonic of the stimulation frequency. The re-referenced EEG data and each set with reference signals are used as input for the CCA. CCA tries to find pairs of linear transformations for the two sets such that when the transformations are applied the resulting sets have a maximal correlation. The stimulation frequency with the highest maximum correlation is classified as the frequency the participant was focusing on.
Part III
Chapter 6
Results
When the 14 participants were asked which selection method they would choose if they were given the opportunity to play the game again, 2 of them chose the non-BCI selection method, 2 of them chose the P300 selection method and 10 of them chose the SSVEP selection method. This is a first indication that participants preferred the SSVEP selection method over the non-BCI and P300 selection methods. The scores for immersion, the SAM questionnaire and the game statistics are described below and will provide a more detailed insight.
6.1
Immersion
Based on the immersion questionnaire the total immersion scores of each session were calculated for the three selection methods. The five immersion factors were also analyzed and all scores, averaged over participants, are shown in Table 6.1.
P300 SSVEP non-BCI
Total∗ 153.50 (19.35) 160.86 (15.00) 143.29 (23.85)
Cognitive† 55.00 (7.69) 58.43 (5.35) 52.36 (9.75)
Dissociation† 26.93 (5.65) 28.36 (5.12) 25.00 (5.74)
Emotional∗ 59.64 (9.38) 59.86 (6.26) 54.29 (9.19)
Challenge 20.86 (2.85) 20.71 (2.40) 20.86 (3.03)
[image:32.595.146.448.476.575.2]Control 34.71 (6.17) 37.86 (5.02) 32.57 (6.16)
Table 6.1: Scores of the five immersion factors and total immersion, averaged over participants. Values are represented as µ(σ) with highest values marked grey. A significant difference (p < 0.05) or trend (p <0.10) depending on the used selection method is indicated with∗ or† respectively.
However, there was a significant increase in total immersion in the P300 vs. SSVEP sessions (Z =−2.064, p= 0.039).
The five immersion factors show the same tendency as the total immersion. All immersion factors, except the challenge factor, are rated higher in the SSVEP session. For the emotional involvement factor there was a significant difference depending on the used selection method (Z = 6.143, p= 0.046). However, post-hoc analysis could not indicate what caused this significant difference. There was no significant difference in the P300 vs. non-BCI sessions (Z=−1.635, p= 0.102), nor in the SSVEP vs. non-BCI sessions (Z=−1.696, p= 0.090). There was also no significant difference between the P300 and SSVEP sessions (Z = −0.409, p= 0.683).
For the cognitive involvement factor a trend was visible depending on the used selection method (Z = 5.880, p = 0.053). Post-hoc analysis revealed a trend between the SSVEP and non-BCI sessions (Z =−2.122, p = 0.034) and between the P300 and SSVEP sessions (Z =−2.081, p= 0.037). There was no trend between the P300 and non-BCI sessions (Z=−0.6299, p= 0.5287).
The used selection method also had an effect on the real world dissociation factor as a trend was visible (Z = 5.698, p= 0.058). Post-hoc analysis did not reveal a trend between the P300 and non-BCI sessions (Z=−0.770, p= 0.441) or between the P300 and SSVEP sessions (Z =−1.258, p = 0.209). However, there was a trend between the SSVEP and non-BCI sessions (Z =−1.926, p= 0.054).
Using a different selection method had no significant effect on the challenge (Z= 0.157, p= 0.925) and control (Z = 3.569, p= 0.168) factors.
6.2
Affect
Based on the SAM questionnaire the total SAM scores were calculated for the selection methods and the average results are shown in Table 6.2.
P300 SSVEP non-BCI
Valence 6.14 (1.32) 7.00 (1.38) 6.26 (1.64)
Arousal 4.52 (2.24) 4.40 (2.38) 4.79 (2.40)
[image:33.595.170.421.492.550.2]Dominance 4.93 (1.60) 6.02 (1.69) 5.64 (2.55)
Table 6.2: Average SAM scores, the values are represented asµ(σ) with highest values marked grey.
6.3
Game Statistics
Most participants were able to finish the familiarity and easy trials, regardless the selection method, within the given time limit. However, of the 14 partici-pants only 5 were able to finish the difficult trial while using the P300 selection method. Whereas for the SSVEP and non-BCI selection methods respectively 13 and 11 participants finished the difficult trial.
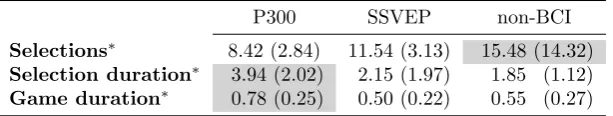
The game statistics which were collected during the experiments are shown in Table 6.3, showing the average number of selections per minute, the average selection duration (in seconds) and the normalised game duration.
P300 SSVEP non-BCI
Selections∗ 8.42 (2.84) 11.54 (3.13) 15.48 (14.32)
Selection duration∗ 3.94 (2.02) 2.15 (1.97) 1.85 (1.12)
[image:34.595.144.451.256.314.2]Game duration∗ 0.78 (0.25) 0.50 (0.22) 0.55 (0.27)
Table 6.3: Average number of selections per minute, average selection duration (in seconds) and normalised game duration. All presented asµ(σ) with highest values marked grey. A significant difference (p <0.05) depending on the used selection method is indicated by∗.
On average the number of selections per minute was higher in the non-BCI session and there was a significant difference depending on the used selection method (Z = 14.714, p = 0.0006). Post-hoc analysis indicated no significant differences between the SSVEP and non-BCI sessions (Z=−1.726, p= 0.084). However, there was a significant increase in selections per minute in the P300 vs. non-BCI sessions (Z =−3.296, p= 0.001) and the P300 vs. SSVEP sessions (Z=−2.417, p= 0.016).
Chapter 7
Discussion
7.1
Immersion
It was expected that only P300 would enrich the user experience since SSVEP is generally considered as annoying. However, for the immersion it seems the contrary is true. Most participants indicated that they preferred playing the game with the SSVEP selection method, which seems to be supported by the results of the immersion questionnaire. There was a significant increase in total immersion between the P300 and SSVEP sessions. This indicates that partici-pants were more immersed using the SSVEP selection method than when using the P300 selection method. Furthermore, there was an overall increase in to-tal immersion between the SSVEP and non-BCI sessions. Although this was not significant it can be seen as a trend, indicating that the SSVEP selection method could enrich the user experience in terms of immersion.
For the P300 and SSVEP selection methods no physical actions were re-quired, whereas for the non-BCI selection method, participants still had to translate their intentions into an physical action (i.e. stopping the selection method at the correct time). However, for the P300 selection method, partic-ipants still had to perform a mental action (i.e. count how often a dog was highlighted). This could have interfered with participants becoming fully im-mersed while using the P300 selection method. For the SSVEP selection method participants only had to stare at the dog they wished to select. As participants were able to translate their intentions directly, without requiring any type of actions, into in-game actions while using the SSVEP selection method, they might have become more easily immersed.
experience more (or less) difficulties while using one of the selection methods. However, as there is no ground truth for the accuracy of the selection meth-ods and an overall reduction was observed in the control factor for the P300 and non-BCI sessions compared to the SSVEP session, more data could prove otherwise.
Although post-hoc analysis could not indicate what caused the significant difference for the emotional involvement factor, the average scores for the P300 and SSVEP sessions were almost equal, 59.64 and 59.86 respectively. The aver-age score for the non-BCI session was lower (54.29), which could indicate that SSVEP and P300 together caused the significant difference for the emotional involvement factor. Participants seemed to enjoy making (successful) selections using a BCI, they became more emotionally involved, less aware of their sur-roundings and needed to focus on the game, which was supported by the real world dissociation and cognitive involvement factors where trends were revealed between the SSVEP and non-BCI sessions and the P300 and non-BCI sessions.
7.2
Affect
The used selection method did not seems to have a significant effect on the results of the SAM questionnaire. However, there was an overall increase in valence between the SSVEP and non-BCI sessions and between the P300 and SSVEP sessions. There was a strong correlation between the total immersion and valence (ρ = 0.68), indicating that being more immersed was also found more positively affective. This could have been caused by participants’ feel-ing of control as there was also a strong correlation between total immersion and dominance (ρ = 0.67). In other words, in this case the SSVEP selection method let participants translate their intentions directly into in-game actions, giving them an increased feeling of control leading to a more positively affective experience.
7.3
Game Statistics
Although participants needed less selections per minute to finish the game in the P300 session, there was a significant increase in game duration between the P300 and non-BCI sessions and between the P300 and SSVEP sessions, indicating that participants needed more time to finish the game while using the P300 selection method. The P300 selection method apparently gave par-ticipants some difficulties as a reduction in both selections and game duration was expected. The used selection method also had a significant effect on the se-lection duration. There was a significant increase in sese-lection duration between the P300 and non-BCI sessions and between the P300 and SSVEP sessions, in-dicating that participants used more time to make a selection using the P300 selection method. As participants understood that an accurate BCI selection did require more time, they adjusted the selection duration accordingly. This indicated that the P300 selection method did indeed introduce some difficulties as the game and selections duration increased in the P300 session.
Chapter 8
Conclusion
In this study two BCI system were compared to a non-BCI system to evaluate the user experience in terms of immersion and affect. For the BCI systems, selection methods based on SSVEP and P300 were integrated into a game, introducing a challenge factor. A comparable non-BCI selection method based on time was also implemented into the game, introducing an equal challenge. Fourteen participants played the game with all selection methods in three levels with increasing difficulty. They rated each selection method on immersion and affect.
Based on the results it is evident that in this case SSVEP is capable of enriching the user experience in terms of immersion and affect. Participants were significantly more immersed and the SSVEP selection method was found more positively affective. Although it was expected that P300 would enrich user experience, it did not. For users to become totally immersed, a BCI system facilitating in making selection should effortlessly submit to the intentions of the users and not elicit any disruptions. This is why the SSVEP selection method makes it easier for users to become immersed as they are able to directly translate their intentions into in-game actions. A SSVEP selection method only requires users to focus at the target they wish to select. It does not require any physical action as with the non-BCI selection method, nor any mental action, as with the P300 selection method.
Furthermore, participants appeared to have more patience when using the BCI selection methods than when using the non-BCI selection method, which could have been caused by the curiosity of participants for the BCI selection methods or the self overestimation by participants while using the non-BCI selection method.
Bibliography
[1] Bayliss, J. D. Use of the evoked potential P3 component for control in a virtual apartment. IEEE Transactions on Neural Systems and Rehabilita-tion Engineering 11, 2 (2003), 113 – 116.
[2] Beverina, F., Palmas, G., Silvoni, S., Piccione, F., and Giove, S. User adaptive BCIs: SSVEP and P300 based interfaces. PsychNology Journal 1, 4 (2003), 331–354.
[3] Bin, G., Gao, X., Yan, Z., Hong, B., and ShangkaiGao. An on-line multi-channel SSVEP-based brain–computer interface using a canoni-cal correlation analysis method. Journal of Neural Engineering 6, 4 (2009), 046002.
[4] Bradley, M. M., and Lang, P. J. Measuring emotion: The self-assessment manikin and the semantic differential. Journal of Behavior Therapy and Experimental Psychiatry 25, 1 (1994), 49–59.
[5] Brown, E., and Cairns, P.A grounded investigation of game immersion. In CHI ’04 extended abstracts on Human factors in computing systems
(2004), ACM, pp. 1297–1300.
[6] Chen, J. Flow in games (and everything else). Commun. ACM 50, 4 (2007), 31–34.
[7] Cheng, M., Gao, X., Gao, S., and Xu, D.Design and implementation of a brain-computer interface with high transfer rates. IEEE Transactions on Biomedical Engineering 49, 10 (2002), 1181–1186.
[8] Cooper, R., Osselton, J., and Shaw, J. EEG technology. Butter-worths, 1969.
[9] Csikszentmihalyi, M. Flow: The Psychology of Optimal Experience. Harper Perennial, New York, 1990.
[10] Duncan-Johnson, C., and Donchin, E. On quantifying surprise: The variation of event-related potentials with subjective probability. Psy-chophysiology 14, 5 (1977), 456–467.
[12] Friedman, D., Leeb, R., Guger, C., Steed, A., Pfurtscheller, G., and Slater, M. Navigating virtual reality by thought: What is it like?
Presence: Teleoperators and Virtual Environments 16, 1 (2007), 100–110. [13] Gal´an, F., Nuttin, M., Lew, E., Ferrez, P., Vanacker, G.,
Philips, J., Van Brussel, H., and Mill´an, J. An asynchronous and non-invasive brain-actuated wheelchair. In13th International Symposium on Robotics Research (2007).
[14] Hakvoort, G., Reuderink, B., and Obbink, M.Comparison of PSDA and CCA detection methods in a SSVEP-based BCI-system. Technical Re-port TR-CTIT-11-03, Centre for Telematics and Information Technology, University of Twente, 2011.
[15] Hjelm, S. I., and Browall, C. Brainball - using brain activity for cool competition. In Proceedings of the First Nordic Conference on Human-Computer Interaction (2000).
[16] Hoffmann, U., Vesin, J., Ebrahimi, T., and Diserens, K. An effi-cient P300-based brain-computer interface for disabled subjects. Journal of Neuroscience Methods 167, 1 (2008), 115–125.
[17] Jennett, C., Cox, A., Cairns, P., Dhoparee, S., Epps, A., Tijs, T., and Walton, A. Measuring and defining the experience of immersion in games. International Journal of Human-Computer Studies 66, 9 (2008), 641–661.
[18] Lalor, E. C., Kelly, S. P., Finucane, C., Burke, R., Smith, R., Reilly, R. B., and McDarby, G. Steady-State VEP-Based Brain-Computer Interface Control in an Immersive 3D Gaming Environment.
EURASIP Journal on Applied Signal Processing 2005, 19 (2005), 3156 – 3164.
[19] Lansing, R., Schwartz, E., and Lindsley, D.Reaction time and EEG activation under alerted and nonalerted conditions. Journal of Experimen-tal Psychology 58, 1 (1959), 1–7.
[20] Lin, Z., Zhang, C., Wu, W., and Gao, X. Frequency Recognition Based on Canonical Correlation Analysis for SSVEP-Based BCIs. IEEE Transactions on Biomedical Engineering 53, 12 (2006), 2610–2614. [21] Lopez, M., Pelayo, F., Madrid, E., and Prieto, A. Statistical
characterization of steady-state visual evoked potentials and their use in brain–computer interfaces.Neural Processing Letters 29, 3 (2009), 179–187. [22] Molina, G. G.Detection of high-frequency steady state visual evoked po-tentials using phase rectified reconstruction. InEusipco(Lausanne, Switzer-land, Aug. 2008).
[24] Nacke, L., and Lindley, C. A. Flow and immersion in first-person shooters: measuring the player’s gameplay experience. In Proceedings of the 2008 Conference on Future Play: Research, Play, Share(2008), Future Play ’08, ACM, pp. 81–88.
[25] Nijholt, A., Plass-Oude Bos, D., and Reuderink, B.Turning short-comings into challenges: Brain-computer interfaces for games. Entertain-ment Computing 1, 2 (2009), 85–94.
[26] Nijholt, A., Tan, D., Allison, B., del R. Milan, J., and Graimann, B.Brain-Computer Interfaces for HCI and Games. InCHI ’08 extended abstracts on Human factors in computing systems (2008), ACM, pp. 3925–3928.
[27] Norman, D. Emotion & design: attractive things work better. Interac-tions 9, 4 (2002), 36–42.
[28] Pagulayan, R., Keeker, K., Wixon, D., Romero, R., and Fuller, T. User-centered design in games. In The human-computer interaction handbook (2002), pp. 883–906.
[29] Picard, R. Affective computing. The MIT press, 2000.
[30] Plass-Oude Bos, D., Reuderink, B., Laar, B., G¨urk¨ok, H., M¨uhl, C., Poel, M., Nijholt, A., and Heylen, D.Brain-computer interfacing and games. In Brain-Computer Interfaces, Human-Computer Interaction Series. Springer London, 2010, pp. 149–178.
[31] Reilly, E. L. EEG Recording and Operation of the Apparatus. In: Elec-troencephalography: Basic Principles, Clinical Applications and Related Fields. Lippincott Williams & Wilkins, 1999, pp. 139–160.
[32] Reuderink, B. Games and brain-computer interfaces: The state of the art, 2008.
[33] Reuderink, B., Nijholt, A., and Poel, M. Affective pacman: A frustrating game for brain-computer interface experiments. In Intelligent Technologies for Interactive Entertainment, vol. 9 ofLecture Notes of the Institute for Computer Sciences, Social Informatics and Telecommunica-tions Engineering. Springer, 2009, pp. 221–227.
[34] Reynolds, C. W. Flocks, herds and schools: A distributed behavioral model. In SIGGRAPH ’87 Proceedings of the 14th annual conference on Computer graphics and interactive techniques (1987), ACM, pp. 25–34. [35] Ruen Shan, L., Ibrahim, F., and Moghavvemi, M. Assessment of
Steady-State Visual Evoked Potential for Brain Computer Communication. In3rd Kuala Lumpur International Conference on Biomedical Engineering 2006 (2006), Springer, pp. 352–354.
[37] van de Laar, B., Reuderink, B., Plass-Oude Bos, D., and Heylen, D. Evaluating user experience of actual and imagined movement in BCI gaming. International journal of Gaming and Computer Mediated Simula-tions 2, 4 (2010), 33–47.
[38] van Gerven, M., Farquhar, J., Schaefer, R., Vlek, R., Geuze, J., Nijholt, A., Ramsey, N., Haselager, P., Vuurpijl, L., Gielen, S., and Desain, P. The brain–computer interface cycle. Journal of Neural Engineering 6, 4 (2009), 041001.
[39] Volosyak, I., Cecotti, H., and Gr¨aser, A. Impact of Frequency Se-lection on LCD Screens for SSVEP Based Brain-Computer Interfaces. Bio-Inspired Systems: Computational and Ambient Intelligence (2009), 706– 713.
[40] Wolpaw, J., Ramoser, H., McFarland, D., and Pfurtscheller, G.
EEG-based communication: improved accuracy by response verification.
Part IV
Appendix A
BCI brain-computer interface
EEG electroencephalography
MEG magnetoencephalography
NIRS near-infrared spectroscopy
fMRI functional magnetic resonance imaging
ERP event-related potential
SSVEP steady-state visually evoked potential
ISI inter-stimulus interval
EMG electromyography
CAR common average reference
SNR signal-to-noise ratio
ITR information transfer rate
CCA canonical correlation analysis
PMCC Pearson product-moment correlation coefficient
SWDA stepwise linear discriminant analysis
FFT fast Fourier transform
PSD power spectral density
PSDA power spectral density analysis
Appendix B
B.1
Experiment Setup
[image:48.595.227.366.233.365.2]During this experiment participants sat in a comfortable chair at approximately 70 cm in front of a LCD monitor1on which the stimuli were presented. A small white cross was placed at the center of an LCD monitor on a black background (Fig. B.1). During the study participants were exposed to different types of trials, in which the presented stimulus varied in size and frequency. The detailed setup of the pre-experiment study was described in [14].
Figure B.1: Screen layout of the monitor during the pre-experiment study
Based on the work of Volosyaket al. [39], 7 different frequencies (6.00 Hz, 6.67 Hz, 7.50 Hz, 8.57 Hz, 10.00 Hz, 12.00 Hz and 15.00 Hz) were used. Their study showed that frequencies which are integer factors of the refresh rate of an LCD monitor are more suitable for presenting stimuli. Using the factor of the refresh rate produces a more stable stimulus frequency because only whole frames are visible on the LCD screen. The diameters of the stimuli were set to 2 and 3 centimeters, which is consistent with the work in the literature [7, 20]. In each trial one stimulus, a blinking white circle, appeared at the location of the cross. Participants had to focus for 4 seconds on the stimulus. Between trials, participants had 6 seconds rest to relax their vision. All trials were presented 25 times and were placed in a random order prior to the experiment. Thus, for each participant, 25 segments of 4 seconds of data were recorded for each unique trial. The complete experiment lasted 60 minutes and was divided into 4 sessions of equal length. Between the sessions, participants could relax in order to reduce the effect of visual fatigue.
For offline analysis, continuous EEG activity was recorded using a BioSemi ActiveTwo system2with a sampling rate of 512 Hz. Recordings were taken from 32 scalp electrodes, placed according to the international 10-20 system [31].
B.2
SSVEP Classifier
One of the most popular and widely used methods to detect the presence of SSVEPs is power spectral density analysis (PSDA) where a fast Fourier
transform (FFT) is used to estimate the power spectral density (PSD) of a time window of the user’s EEG-signal. The magnitude of each stimulation fre-quency can then be used for classification [7]. A relatively new approach is using CCA where the correlations between the user’s EEG-signal and each stimula-tion frequency can be used for classificastimula-tion. CCA-based detecstimula-tion methods have some improvements and advantages compared to PSDA-based detection methods, such as better SNR, lower inter-subject variability and the possibility to use harmonic frequencies [3, 20]. To determine which classifier to use, all tri-als in this experiment were classified with a CCA and a PSDA based detection method and the results were compared.
For the PSDA-based detection, EEG data fromOz was filtered with a band-pass filter of 4 - 35 Hz. The data was re-referenced with CAR using all 32 electrodes and a FFT was performed every 0.3 seconds with a FFT-size of 512 data points. For each of the stimuli frequencies the sum of the extracted magnitudes of its first and second harmonics were used for classification. The stimuli frequency with the highest value, which also exceeded two times the average magnitude of the FFT, was classified as the presented frequency. The first two classifications of the 4 second stimuli were dropped as they contain non-stimulated data and might influence the performance. The rest of the clas-sifications are used in a majority vote to determine the presented frequency.
For the CCA-based detection, EEG data was acquired from eight different electrodes (Pz, P3, P4, PO3, PO4, Oz, O1, O2). The acquired EEG data was re-referenced with CAR [8] using all 32 electrodes. Sets of reference signals were constructed for each one of the stimulation frequencies where each set contained the sine and cosine for the first, second and third harmonic of a stimulation frequency. The re-referenced EEG data and each set with reference signals were used as input for the CCA. CCA tries to find pairs of linear transformations for the two sets such that when the transformations are applied the resulting sets have a maximal correlation. The stimulation frequency with the highest maximum correlation was classified as the frequency the participant was focusing [14].
The average recall and precision for each of the 7 frequencies are shown in Tables B.1 and B.2. It can be seen that the CCA based detection method has higher recall and precision values than the PSDA based detection method. A Wilcoxon signed-rank test between the average recall values showed that this difference is significant (Z =−2.20, p <0.05). Based on these results a CCA based detection method was used for determining the size and frequencies and for the final experiments.
B.3
Stimulus Size
Recall Precision 6 72.00 23.91
6.67 29.71 48.15
7.5 45.14 42.47
8.57 48.00 73.68
10 61.71 51.43
12 27.43 96.00
15 17.14 100.00
Table B.1: Average recall and precision for PSDA based clas-sification
Recall Precision 6 62.29 46.58
6.67 46.29 61.36
7.5 65.71 55.02
8.57 68.57 63.16
10 80.00 48.28
12 52.00 91.00
[image:50.595.142.267.125.227.2]15 39.43 98.57
Table B.2: Average recall and precision for CCA based classi-fication
a detection method based on CCA.
The average recall and precision for each of the 7 frequencies are shown in Tables B.3 and B.4. It can be seen that the larger stimuli elicit SSVEP responses which result in higher recall and precision values than the smaller stimuli. A Wilcoxon signed-rank test between the average recall values showed that this difference is significant (Z =−2.37, p <0.05). Based on these results, for the final experiment the size of the stimuli was set to 3 centimeter.
Recall Precision 6 53.14 34.70
6.67 36.57 46.04
7.5 50.86 48.63
8.57 54.60 49.48
10 69.14 35.38
12 34.29 86.96
15 17.71 100.00
Table B.3: Average recall and precision for stimuli with size of 2 centimeter
Recall Precision 6 62.29 46.58
6.67 46.29 61.36
7.5 65.71 55.02
8.57 68.57 63.16
10 80.00 48.28
12 52.00 91.00
15 39.43 98.57
Table B.4: Average recall and precision for stimuli with size of 3 centimeter
B.4
Stimulus Frequencies
Of the 7 different frequencies only three were used in the game, one for each dog. Which frequencies to use was determind by testing each possible combination. The number of combination can be expressed as nk
and can be calculated with
n k
= n!
k!(n−k)!. In this case, withn= 7 andk= 3 the number of combinations is 35. For each combination all relavant epochs were extracted and classified using the CCA-based classifier. The reference signals for the CCA (Y), only contained the reference to the three frequencies available in the combination.
Recall Precision 1: 6, 6.67, 7.5 73.14 74.01
2: 6, 6.67, 8.57 74.10 74.50
3: 6, 6.67, 10 69.52 70.49
4: 6, 6.67, 12 70.29 76.00
5: 6, 6.67, 15 72.38 76.39
6: 6, 7.5, 8.57 81.33 81.63
7: 6, 7.5, 10 73.90 74.47
8: 6, 7.5, 12 75.05 79.40
9: 6, 7.5, 15 72.19 77.73
10: 6, 8.57, 10 76.95 77.47
11: 6, 8.57, 12 76.95 80.46
12: 6, 8.57, 15 78.86 82.56
13: 6, 10, 12 71.62 75.51
14: 6, 10, 15 72.00 77.45
15: 6, 12, 15 73.90 83.67
16: 6.67, 7.5, 8.57 77.33 77.49
17: 6.67, 7.5, 10 74.48 75.26
18: 6.67, 7.5, 12 75.81 76.52
19: 6.67, 7.5, 15 70.86 77.42
20: 6.67, 8.57, 10 76.00 76.50
21: 6.67, 8.57, 12 78.29 78.70
22: 6.67, 8.57, 15 78.29 80.03
23: 6.67, 10, 12 76.76 77.95
24: 6.67, 10, 15 73.33 77.32
25: 6.67, 12, 15 77.90 79.60
26: 7.5, 8.57, 10 82.48 82.91
27: 7.5, 8.57, 12 84.95 85.11
28: 7.5, 8.57, 15 78.29 82.48
29: 7.5, 10, 12 80.76 81.62
30: 7.5, 10, 15 73.14 78.69
31: 7.5, 12, 15 76.19 81.66
32: 8.57, 10, 12 81.90 82.68
33: 8.57, 10, 15 78.10 82.23
34: 8.57, 12, 15 81.71 84.66
[image:52.595.209.384.217.607.2]35: 10, 12, 15 78.10 83.08
Appendix C
1. Introduction (30 min)
(a) Welcome the participant (2 min) (b) Give a short introduction (3 min)
(c) Participant fills in and signs consent form (5 min)
(d) Participant fills in short questionnairem Measure participant’s head circumference and put on EEG cap in the meantime (20 min)
2. Experiment (33 min) x 3
(a) Short introduction (1 min) (b) Part one: familiarity trial (4 min)
i. Participant plays Mind the Sheep! and must collect 10 objects which are placed across the playground within 3 minutes (3 min) ii. Participant fills in SAM questionnaire (1 min)
(c) Part Two: easy trial (6 min)
i. Participant plays Mind the Sheep! and must pen a small flock of 5 sheep within 5 minutes (5 min)
ii. Participant fills in SAM questionnaire (1 min) (d) Part Three: Difficult trial (11 min)
i. Participant plays Mind the Sheep! and must pen a flock of 10 sheep within 10 minutes (10 min)
ii. Participant fills in SAM questionnaire (1 min) (e) Participant fills in questionnaire on immersion (6 min) (f) A small brake and some drinks (5 min)
3. Ask for preference of participant
Appendix D
Welcome Participant,
In a minute you will be playing Mind the Sheep! In this document you’ll find a brief explanation on how to play it and some extra information.
The Game
Mind the Sheep! consists of a playground representing a meadow. On this playground there are a few obstacles, e.g. trees, fences, rocks, etc. On this playground you will also find three herding dogs which are under your control.
If you want to move a herding dog, point the Wiimote at any location on the playground and start the current selection methods by pressing the A button. Now you can select one of the herding dogs by using a selection method. When you release the A button the selection methods stops and moves one of the three dogs to the location you indicated. Note: when a herding dog was unable to find a route to the indicated location it will not response.
Selection Methods
During this experiment you will use three different selection methods. Two of them (SSVEP-based and P300-bas
![Figure 2.1: Block diagram of a BCI system including acquisition, processingand deployment, based on [36].](https://thumb-us.123doks.com/thumbv2/123dok_us/1193255.642582/14.595.141.453.481.673/figure-block-diagram-including-acquisition-processingand-deployment-based.webp)
![Figure 3.1: Levels of involvement with their barriers as defined by Brown et al.[5].](https://thumb-us.123doks.com/thumbv2/123dok_us/1193255.642582/19.595.227.367.123.253/figure-levels-involvement-barriers-dened-brown-et-al.webp)