Magnetization Transfer: A Potential Method to Determine the Age of
Multiple Sclerosis Lesions
Myrosia M. Tomiak, Jordan D. Rosenblum, Jordan M. Prager, and Charles E. Metz
PGRPOSE: To determine whether magnetization transfer contrast can differentiate acute from chronic lesions in multiple sclerosis. METHODS: Thirteen patients with multiple sclerosis and eight healthy patients were studied with MR using a 0.1-T system. Relatively T2-weighted spin-echo images were obtained without and with magnetization transfer contrast. The magnetization transfer effect of multiple sclerosis lesions was calculated and compared with the ages of the lesions. The magnetization transfer effect of normal-appearing white matter in patients with multiple sclerosis was calculated and compared with the magnetization transfer effect of white matter in healthy volunteers. Statistical analysis was performed. RESGL TS: White matter in the healthy volunteers had values from 0.40 to 0.45. Normal-appearing white matter in the patients with multiple sclerosis had magnetization transfer effect values ranging from 0.41 to 0.45. Multiple sclerosis plaques of less than 1 year's duration had magnetization transfer effect values ranging from 0.05 to 0.26; older plaques had values from 0.25 to 0.41. The difference in the distributions of these values for acute and chronic multiple sclerosis plaques is statistically significant. CONCLGSION: Current imaging modalities do not differentiate acute multiple sclerosis lesions from chronic ones. Our data on magnetization transfer show a statistically significant difference in magnetization transfer effect values between lesions of less than 1 year's duration and older lesions. The different values may correspond to the histologic changes of multiple sclerosis plaques over time. Magnetization transfer may be a reliable method for determining the age of multiple sclerosis lesions.
Index terms: Sclerosis, multiple, Magnetic resonance, technique; Magnetic resonance, tissue characterization; Brain, magnetic resonance
AJNR Am J Neuroradio/15:1569-1574, Sep 1994
Multiple sclerosis is a demyelinating disorder typified by relapsing and remitting neurologic symptoms. Magnetic resonance imaging (MRI) is the most sensitive modality for the detection of multiple sclerosis lesions but lacks specificity (1 ). Gadolinium-enhanced MRI demonstrates multiple sclerosis lesions that are active in terms of a disrupted blood-brain barrier (2, 3) but does not differentiate demyelination from edema (4). No current imaging modality can determine the age, and by inference the his-topathologic state, of multiple sclerosis lesions.
Received June 11, 1993; accepted after revision December 16. From the University of Chicago Hospitals, Department of Radiology. Address reprint requests to Myrosia M. Tomiak, MD, The University of Chicago Hospitals, Department of Radiology, MC 2026, 5841 S Maryland Ave, Chicago, lL 60637.
AJNR 15:1569-1574, Sep 1994 0195-6108/94/1508-1569 © American Society of Neuroradiology
1570 TOMIAK AJNR: 15, September 1994
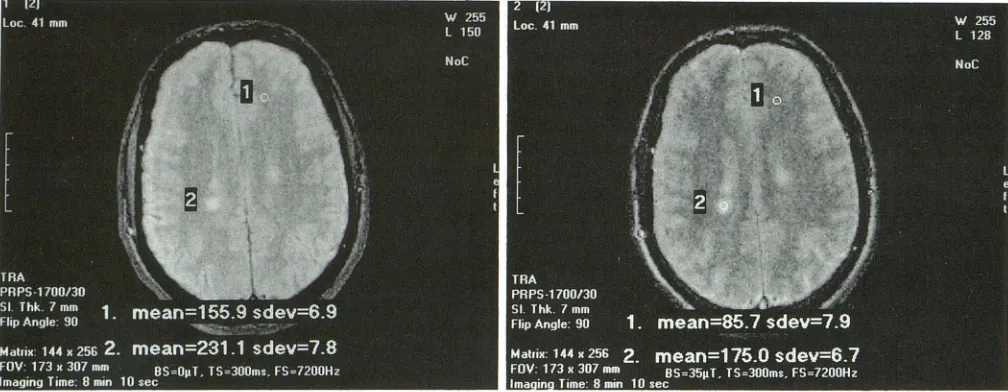
Fig 1. Example of a "mask" image in a patient with multiple sclerosis. The scan was taken at a level just superior to the lateral ventricles. Region of interest cursors have been placed on normal-appearing white matter in the left frontal lobe and on a plaque in the right parietal lobe. Each region's mean signal intensity value and standard deviation is shown at the bottom of the image.
Fig 2. Corresponding magnetization transfer image. Signal intensity in plaques is suppressed less than in surrounding brain tissue,
making plaques appear relatively brighter. (The apparently increased signal intensity of cerebrospinal fluid on the magnetization transfer
image relative to the mask image is an artifact of the computer software used in image processing.)
netization transfer to differentiate acute multi-ple sclerosis lesions from chronic lesions.
Methods
Subjects
Eight healthy volunteers, 4 women and 4 men ages 25 to 44 years, and 13 patients with known multiple sclerosis,
8 women ages 21 to 51 and 5 men ages 26 to 50, were
evaluated. Diagnoses were based on clinical symptoms and MR findings, with additional evidence from cerebro-spinal fluid analysis, visual evoked-potential testing, and electromyography testing. Some of the patients with mul-tiple sclerosis were already part of a double-blind
inter-feron study.
All patients with multiple sclerosis had multiple prior
annual high-field ( 1.5-T) MR exams, performed according to a protocol used at our institution for evaluation of
pa-tients with multiple sclerosis (T2-weighted spin-echo
im-ages with parameters 2200/35-90/1 [repetition time/echo
time/excitations) in standardized axial and coronal planes). Some patients had additional exams, the shortest
interval between exams being 2 months. All patients had high-field exams within 1 day to 1 week of the magnetiza-tion transfer study. These exams were used to estimate ages of the multiple sclerosis plaques. The most recent prior exam on which a lesion was not seen on either axial or coronal images was used to determine the maximum
possible age of a lesion. An arbitrary separation of lesions
into those less than 1 year's duration and greater than 1 year's duration was used for purposes of analysis.
Data
The magnetization transfer exams were performed on a 0.1-T system. For each patient, preliminary relatively T2-weighted spin-echo (1700/30/1) axial images of the whole brain were obtained as in the high-field exams to localize
areas of interest. For the actual magnetization transfer
exam, a single-section "mask" image was obtained with-out the magnetization transfer parameters followed by a
magnetization transfer image with the parameters applied. (Figs 1 and 2) Both images used the same relatively T2-weighted sequence (1700/30/1 ), with a section thickness
of 7 mm and a 162 X 256 matrix. For the magnetization transfer images an off-resonance pulse was applied to
every other repetition time during image acquisition. Pa-rameters for the off-resonance pulse were 7.2 kHz offset, amplitude 0.35 /LT, and duration 300 milliseconds.
Signal-intensity values were measured for comparable
regions of interest on the mask image and on the magne-tization transfer image. Regions of interest were at least 4
X 4 pixels and placed such that measured signal
intensi-ties had standard deviations less than 10 U. In the healthy
volunteers, regions of interest were selected in deep white matter at multiple sites. In the patients with multiple scle-rosis, regions of interest were selected in plaques and in normal-appearing white matter. All plaques were less than 1 em. The magnetization transfer effect value for a
given region of interest was calculated using the equation (M0 - M5)/M0 , where M0 is the measured signal intensity
on the mask image and M5 is the measured signal intensity
[image:2.612.55.559.84.280.2]AJNR: 15, September 1994
0.45
0.4
I
0.35
c
-oirl 0.3
:;::;~
~w ~ 0.25 ·- 1.... ~
(j)Cllc.,_ ro -0.2 Ol~> ro ro
~~ 0.15
0.1
0.05
0
I
I
•
•
•
•
I
I
I
MAGNETIZATION TRANSFER 1571
Fig 3. Scattergram plotting of magneti-zation transfer effect values ( uertical axis) for white matter in healthy volunteers, nor
-mal-appearing white matter in patients with multiple sclerosis (MS), plaques less than 1 year old in patients with multiple sclerosis,
and plaques more than 1 year old in patients with multiple sclerosis.
Normal White Matter
Normal-Appearing White Matter
MS Plaques < 1 yr.
MS Plaques > 1 yr.
Statistics
We interpreted our data from the perspective of receiver operating characteristic analysis, which describes the abil-ity of a diagnostic procedure to differentiate two compl e-mentary states of truth ( 11). In our study, the two states of interest were lesion age less than 1 year and lesion age greater than 1 year. We used the area under the receiver operating characteristic curve as an index to summarize the accuracy of magnetization transfer effect in classifying multiple sclerosis lesion age into these two groups. This index can be interpreted as the average sensitivity that a diagnostic procedure provides if its specificity is chosen randomly between 0% and 100%, or, equivalently, as the average specificity of the procedure if sensitivity is chosen randomly ( 11). The value of the Az (area under the curve) and its standard error were estimated by techniques de-scribed by Hanley and McNeil (12). However, this stan -dard error cannot be used to test the null hypothesis that magnetization transfer effect provides no information in classifying multiple sclerosis lesion age (ie, that the true value of the area under the curve is 0.5), because the standard error of estimates of the Az depends on the true value. Therefore, in a supplementary analysis, we used a nonparametric method described by Hanley and McNeil (12) to calculate the amount by which estimates of the Az would vary if the population distributions of magnetization transfer effect values were the same in both groups. We then used the resulting standard deviation in a normal-deviate test to evaluate the null hypothesis that the true value of the area under the curve was 0.5, which is equiv-alent to the normal approximation of the Mann-Whitney test for two independent samples ( 13).
Results
White matter in the healthy volunteers had magnetization transfer effect values ranging
from 0.40 to 0.45. Normal-appearing white
matter in all of the patients with multiple scle-rosis had magnetization transfer effect values ranging from 0.41 to 0.45. The magnetization transfer effect value of cerebrospinal fluid was
less than 2%, corresponding to minimal
bleed-over of saturation on free-water protons.
Nine plaques of less than 1 year's duration were identified in 4 patients with multiple scle-rosis. These had magnetization transfer effect
values ranging from 0.05 to 0.26. Thirty-two
plaques of greater than 1 year's duration were
identified in 10 patients with multiple sclerosis.
These had magnetization transfer effect values ranging from 0.25 to 0.41. These results are
shown graphically in Figure 3.
By using techniques described by Hanley and McNeil (12), we estimated the receiver
operat-ing characteristic area index and its standard
error to be 0.993 and 0.02, respectively. A
non-parametric calculation described by the same
authors (12) indicated that, with 9 and 32
le-sions in samples for the two groups, estimates of the Az would vary with a standard deviation of 0.11 if the true value of the area were 0.5 (ie, according to the null hypothesis that magneti-zation transfer provides no information in
clas-sifying multiple sclerosis lesion age). Thus an
appropriate statistic for testing the null
hypoth-esis is (0.993 - 0.5)/0.11 = 4.48, which
cor-responds toP< .00001 according to the
Mann-Whitney test for two independent samples ( 13).
Although this calculation does not take into
[image:3.612.50.376.80.311.2]magnetiza-1572 TOMIAK
tion transfer effect values of different lesions in a given patient, a similar calculation, which as-sumes that correlation to be perfect, yields P <
.01. We conclude with high confidence that magnetization transfer effect value is associated with the age of a multiple sclerosis lesion.
Discussion
The transverse (T2) relaxation of the central nervous system has been shown in animal mod-els to consist of distinct components corre-sponding to extraaxonal water protons, axonal water protons, intramyelinic water protons, and protons possibly associated with mobile lipids in the myelin sheaths (14). In multiple sclerosis, the T2 relaxation times of plaques are increased and show predominantly biexponential decay curves (15, 16), as opposed to the monoexpo-nential distribution of normal white matter ( 1 7). The faster-relaxing T2 component probably represents the more-bound, myelin-associated water compartment in white matter; the second compartment probably represents the less-bound interstitial water (18). This suggests that contributions to T2 relaxation come from demy-elinated fibers, remaining mydemy-elinated fibers, edema, and gliosis ( 16). That the prolongation of transverse relaxation in multiple sclerosis corresponds to alterations in central nervous system water compartmentalization is further supported by the fact that water-diffusion coef-ficients are increased in patients with multiple sclerosis (19). This increase is greater in acute lesions than in chronic ones, possibly reflecting predominance of demyelination acutely and gli-osis chronically (20). Normal-appearing white matter in patients with multiple sclerosis also has been shown to have transverse relaxation times longer than normal (15-17); however, the values overlap considerably with normal values ( 15), and the decay curves are more likely to be monoexponential (17). This may reflect the early histopathologic changes of multiple scle-rosis at a microscopic level.
Magnetization transfer contrast is a unique type of MR contrast based on the exchange of magnetization in tissues between the proton pool associated with free or mobile water and the proton pool associated with immobile water or macromolecules (6). An off-resonance pulse is applied before an imaging sequence to satu
-rate the bound proton pool. Magnetization is
AJNR: 15, September 1994
transferred to the free-proton pool by cross-relaxation and chemical exchange mechanisms (6). The net effect is signal suppression in all tissues, the degree of which is dependent on the efficiency of these mechanisms and varies with tissue composition (21 ). The surface structure of myelin consists of hydrophilic cholesterol hydroxyl groups projecting into the aqueous phase, with hydrophilic phosphate groups pro-jecting out further, forming depressions that can hold water molecules. This geometry is ideal for magnetization transfer between the water pro-tons and the hydroxyl propro-tons (22). The final image contrast or magnetization effect is also affected by the amplitude, duration and fre-quency of the pulse (8), as well as by the field strength (21 ). Technical aspects for clinical ap-plications of magnetization transfer have been discussed in detail by Hajnal et al (5).
The consistently narrow range of magnetiza-tion transfer effect values for white matter in the healthy volunteers indicates the reproducibility of the magnetization transfer effect in the brain.
This has been shown by other investigators as well (4, 10). It is likely that magnetization trans-fer effect values are characteristic for normal brain (21 ). The data presented here show a statistically significant temporal distribution of magnetization transfer effect values for multiple sclerosis plaques, which suggests a relation to the temporal course ofthe disease's histopatho-logic changes. The early histohistopatho-logic stages of multiple sclerosis consist of swelling and frag-mentation of the myelin sheath, followed by phagocytosis of the myelin ( 23). This is associated with an inflammatory reaction and edema ( 4). The chronic stages show absence of myelin, proliferation of astrocytes, and eventual development of fibrous gliosis (23). It is possible that these histologic changes disrupting the myelin structure are reflected in the magnetization transfer effect values, with lower values corresponding to edema and demyelination and higher values to gliosis.
Although the changes in T2 relaxation values seem to be related to the histopathologic changes in multiple sclerosis plaques, such a relation has yet to be documented for
magnetization transfer effect values.
In our study, values for normal-appearing
white matter in the patients with multiple scle
-rosis were similar to those in healthy volunteers.
This differs from a study by Dousset et a! ( 4), in
AJNR: 15, September 1994
values of normal-appearing white matter in 15 patients with multiple sclerosis were lower than values in healthy subjects. However, 3 of the patients in that study had normal-appearing white matter magnetization transfer effect val-ues within the normal range. The discrepancy between the two studies may be explained by the small number of patients in both studies,
possibly skewing results in either case. It also may be caused by sampling of white matter with microscopic disease in their study and white matter without involvement in our study. Some of our patients were involved in a double-blind study in which they may have been receiving either immunosuppressive therapy or placebos, possibly affecting the magnetization transfer ef-fect values of their normal-appearing white matter. We do not have information regarding which patients were on actual therapy; how-ever, it is unlikely that this affected magnetiza-tion transfer effect values, because values were the same as in the patients with multiple scle-rosis who were not in the study.
Age assignment for the multiple sclerosis plaques was an arbitrary division of less than or greater than 1 year based on retrospective eval-uation of prior high-field MR exams, as previ-ously discussed. Lesions visible on the low-field exams were assumed to be visible on the high-field exams, because high-field MR has sensi-tivity equal to or greater than low-field MR for the detection of white matter abnormalities (24). Exams were limited to single-section ac-quisitions for the magnetization transfer images because of problems with cumulative saturation in multisection acquisitions. Consequently, only one or two images could be obtained for each patient.
Conclusion
The ability to discern the age, and thereby the histologic stage, of multiple sclerosis lesions is of clinical importance in that acute edematous lesions would be more likely to respond to
med-ical therapy than chronic gliotic ones. No
cur-rent imaging modality is able to show this
dis-tinction. Dousset et a! speculated that the wide
range of magnetization transfer effect values in
their patients with multiple sclerosis indicated lesions of differing ages and grades of myelina
-tion ( 4). A search of the literature on magneti-zation transfer showed no other reports that
at-MAGNETIZATION TRANSFER 1573
tempt to show a temporal correlation of magnetization transfer effect values in multiple
sclerosis lesions. Our study shows a statistically significant difference in magnetization transfer effect values between lesions of less than 1
year's duration and older lesions. This suggests that magnetization transfer is a potential method for differentiating acute from chronic
lesions in patients with multiple sclerosis.
References
1. Uhlenbrock D, Seidel D, Gehlen W, et al. MR in multiple sclerosis: comparison with clinical, CSF, and visual evoked potential find·
ings. AJ!'IR Am J f'leuroradio/1988;9:59-67
2. Nesbit GM, Forbes GS, Scheithauser BW, et al. Multiple sclerosis:
histopathologic and MR and/or CT correlation in 37 cases at
biopsy and 3 cases at autopsy. Radiology 1991;180:467-474 3. Barkhof F, Scheltens P, Frequin STFM, et al. Relapsing-remitting
multiple sclerosis: sequential enhanced MR imaging vs clinical
findings in determining disease activity. AJR Am J Roenlgenol
1992; 159:1041-1047
4. Dousset V, Grossman RI, Ramer KN, et al. Experimental allergic encephalomyelitis and multiple sclerosis: lesion characterization
with magnetization transfer imaging. Radiology 1992; 192:
483-491
5. Hajnal JV, Baudouin CJ, Oatridge A, et al. Design and implemen
-tation of magnetization transfer pulse sequences for clinical use. J Compul Assist Tomogr 1992;16:7-18
6. Wolff SO, Balaban RS. Magnetization transfer contrast (MTC) and tissue water proton relaxation in vivo. fl1agn Reson fl1ed 1989; 10:
135-144
7. Wolff SO, Eng J, Balaban RS. Magnetization transfer contrast:
method for improving contrast in gradient-recalled-echo images. Radiology 1991; 179:133-137
8. Lipton MJ, Sepponen RE, Tanttu Jl, et al. Magnetization transfer technique for improved magnetic resonance imaging contrast
en-hancement in whole body imaging. Invest Radio/1991 ;26:S255-S256
9. Tanttu Jl, Sepponen RE, Lipton MJ, et al. Synergistic enhance
-ment of MRI with Gd-DTPA and magnetization transfer. J Compul
Assist Tomogr 1992;16:19-24
10. Lundbom N. Determination of magnetization transfer contrast in tissue: an MR imaging study of brain tumors. AJR Am J Roenl
-genol 1992; 159:1279-1285
11. Metz CE. ROC methodology in radiologic imaging. Invest Radio/
1986;21 :720-733
12. Hanley JA, McNeil BJ. The meaning and use of the area under a receiver operating characteristic (ROC) curve. Radiology 1982;
143:29-36
13. Hays WL. Statistics. Fort Worth: Holt, Rinehart and Winston, 1988: 825-827
14. Menon RS, Rusinko MS, Allen PS. Proton relaxation studies of water compartmentalization in a model neurological system. fl1agn Reson fl1ed 1992;28:264-274
15. Larsson HBW, Frederiksen J, Kjaer L, et al. In vivo determination ofTl and T2 in the brain of patients with severe but stable multiple sclerosis. fl1agn Reson fl1ed 1988;7:43-55
1574 TOMIAK
17. Armspach J, Gounot D, Rumbach L, et al.ln vivo determination of
multiexponential T2 relaxation in the brain of patients with multi-ple sclerosis. Magn Reson Imaging 1991 ;9:1 07-113
18. Zamaroczy D, Schluesener HJ, Jolesz FA, et al. Differentiation of experimental white matter lesions using multiparametric mag-netic resonance measurements. Invest Radio/1991;26:317-327 19. Christiansen P, Gideon P, Thomsen C, et al. Increased water
self-diffusion in chronic plaques and in apparently normal white
matter in patients with multiple sclerosis. Acta /'leuro/ Scand
1993;87:195-199
20. Larsson HBW, Thomsen C, Frederiksen J, et al. In vivo magnetic resonance diffusion measurement in the brain of patients with
multiple sclerosis. Magn Reson Imaging 1992;10:7-12
AJNR: 15, September 1994
21. Niemi PT, Komu MES, Koskinen SK. Tissue specificity of
low-field-strength magnetization transfer contrast imaging. J
Magn Reson Imaging 1992;2: 197-201
22. Koenig SH. Cholesterol of myelin is the determinant of gray-white
contrast in MR imaging of the brain. Magn Reson Med 1991 ;20:
285-291
23. Prineas J. Pathology of the early lesion in multiple sclerosis. Hum
Pathol 1975;6:531-554
24. Orrison WW Jr, Stimac GK, Stevens EA, et al. Comparison of CT,