ISSN Online: 2156-8278 ISSN Print: 2156-8251
Reliable Method for Steady-State
Concentrations and Current over the
Diagnostic Biosensor Transducers
Kurunatha Perumal Thevar Preethi
1*, Velmurgan Meena
2, Rajaram Poovazhaki
1*1Department of Mathematics, E.M.G. Yadava Women’s College, Madurai, India
2Department of Mathematics, Madurai Kamaraj University Constitutional College, Madurai, India
Abstract
A mathematical modelling of diagnostic biosensors system at three basic types of enzyme kinetics is discussed in the presence of diffusion. Enzyme kinetics is adopted to be first order, Michaelis-Menten and ping-pong mechanism. In this paper, approximate analytical solutions are obtained for the non-linear equations under steady-state conditions by using the new Homotopy pertur-bation method. Simple and closed forms of analytical expressions for concen-trations of substrate, product and co-substrate and corresponding current re-sponse have been derived for all possible values of parameters. Furthermore, the numerical simulation of the problem is also reported here by using Matlab program. Good agreement between analytical and numerical results is noted.
Keywords
Diagnostic Biosensor, Bio Fuel, Enzyme, Kinetic, Non Linear Equations, Reaction/Diffusion Equation, Homotopy Perturbation Method
1. Introduction
A biosensor is an analytical device used for the detection of an analyte that com-bines a biological component with a physicochemical detector [1] [2]. The earli-er biosensors wearli-ere catalytic systems that integrated especially enzymes with transducers that converted the biological response into an electronic signal. The next generation of biosensors, took advantage of different biological elements, such as antibodies, receptors (natural or synthetic), or nucleic acids [3] [4].
Biosensors for environmental application include the detection of harmful bacteria or pesticides in air, water, or food. New technologies are likely to en-compass all-printed systems capitalising on the printed electronics revolution How to cite this paper: Preethi, K.P.T.,
Meena, V. and Poovazhaki, R. (2017) Reli-able Method for Steady-State Concentra-tions and Current over the Diagnostic Bio- sensor Transducers. American Journal of Analytical Chemistry, 8, 493-513.
https://doi.org/10.4236/ajac.2017.87036
Received: April 19, 2017 Accepted: July 9, 2017 Published: July 12, 2017
Copyright © 2017 by authors and Scientific Research Publishing Inc. This work is licensed under the Creative Commons Attribution International License (CC BY 4.0).
and systems with high compatibility with future mobile technology such as tab-lets and 4G phones [5].
Rangelova et al. [6] [7] [8] described the models in biosensors and investi-gated the influence of the diffusion and kinetic parameters on the response of the biosensor. Tothil et al., [9] deals with the recent developments in biosensors and their potential use in the agricultural diagnostic market. Mishra et al.[10] reviewed various cancer biomarkers in saliva and compared the biomarkers effi-cacy with traditional diagnostics and state-of-the-art bioelectronics. Cortina et al.
[11] presented the development and validation of a portable, robust and inex-pensive electrochemical magnetic biosensor.
Lawal et al.[12] summarized the fabrication of carbon nanotubes-based elec-trochemical biosensors. They also discussed the synthesis, along with the appli-cation of carbon nanotubes to the assembly of carbon nanotube-based electro-chemical sensors, its analytical performance and future expectations. Recently Gruhl et al.[13] described the latest applications of biosensors in diagnostic ap-plications. In this paper the current state and future trends of biosensors are presented. Also Mascini et al.[3] reviewed the application of biosensor sin med-ical diagnostics, taking into account several crucial features.
The numerical method of solving the system of partial differential equations is to make calculation at all intervals of substrates concentration and at different diffusion and enzymatic reaction rates. The diffusion equations [14], containing a nonlinear term related to the enzymatic reaction, are carried out using the im-plicit difference scheme [15]. In recent years, analytical solutions are reported for various types of biosensors [16] [17] [18] [19]. The analytical results of diag-nostic biosensor are relevant because their solutions describe important applica-tions such as bioreactors and biofuel cells, among others [20] [21].
To the researcher’s knowledge no rigorous analytical solution of substrate concentration product with concentration profiles co-substrate concentration and corresponding current response has been derived for all possible values of parameters under steady-state conditions [22]. The purpose of this communica-tion is to derive approximate analytical expressions for the steady-state concen-trations and current over the diagnostic of biosensor transducers for first order, Michaelis-Menten and ping-pong kinetics using Homotopy perturbation me-thod.
2. Mathematical Description of the Boundary Value Problem
Only biosensors systems will be investigated in the active membrane, because it is known that the concentrations of substrate S x
( )
, Product P x( )
andco-substrate C x
( )
in other two membranes are changed linearly. Biosensorsbio-sensor systems in the dynamic mode has the following form [22]:
(
)
(
)
(
)
2 2 2
2 2 2
d 1 d 1 d
, 0, , 0, , 0
d d d
S P C
S C S C S C
x −ϑ = λ x −ϑ = µρ x −ϑ = (1)
The non-dimensional coordinates, variables and parameters are as follows:
[ ]
[ ]
[ ]
[ ]
(
)
(
2)
, , , , ,
, , and
o
S C P S
m S
S S S
P C C S
S C P S
x S C P S
l K K K K
V K
D D K
D D K I D
δ
λ µ ρ φ
= = = = =
= = = =
(1a)
where D DS, C &DP are diffusion coefficients for substrate, co-substrate and product. Ki denotes the reaction constant for concentration profiles (i=S P C, , ), respectively. Vm is the enzyme rate and δ represents the coordinate distance. The diagnosis of the biosensor system depends on the enzyme kinetics and the enzyme reaction as well as on the basic transducer. The kinetics is distinguished in to three kinds:
First order kinetic:
(
)
2,
S C S
ϑ
=φ
(2)Michaelis-Menten kinetic:
(
,)
21 S S C S φ ϑ =
+ (3) Two substrateping-pong kinetic:
(
,)
21 1 1 S S C S C φ ϑ =
+ + (4)
The three types of biosensors can be described with the following system of differential equations:
Inhibitor First-order kinetic Michaelis-Menten kinetic Ping-pong kinetic
Substrate 2 2 2 d 0 d S S x −φ = (5)
2 2 2 d 0 d 1 S S x S φ − =
+ (8)
2 2
2
d
0
d 1 1 1
S
x S C
φ
− =
+ + (11)
Product 22 2
1 d 0 d 1 P S x S φ
λ + + = (6)
2 2 2 1 d 0 d 1 P S x S φ
λ + + = (9)
2 2
2
1 d
0
d 1 1 1
P
x S C
φ
λ + + + = (12)
Co Substrate 2 2 2 1 d 0 d C S x φ
µρ − = (7)
2 2 2 1 d 0 d 1 C S x S φ
µρ − + = (10)
2 2
2
1 d
0
d 1 1 1
C
x S C
φ
µρ − + + = (13)
Equations (5)-(13) are subjected to the following boundary conditions:
( )
0( )
( )
00, , 0,
x= S x =s P x = C x =c
( )
( )
d
1, 0, 0, 0
d S
x P x C x
x
= = = = (14)
where l represents the thickness of active membrane,
φ
2 is the Thieleco-substrate and ρ is reaction rate constant for co-substrate. The initial cur-rent of the biosensor system is recorded normally in substrate, product and co-substrate concentrations at the electrode and are as follows:
0 d d S S S I nFAD δ δ = =
(15)
0 d d P P P I nFAD δ δ = =
(16)
0 d d C C C I nFAD δ δ = =
(17) where n is the number of electrons taking part in electrochemical reaction, F
is the Faraday’s number, and A is the area of the electrode surface [m2].
Analytical Solutions of Concentrations of Substrate, Product
and Co-Substrate under Steady-State Condition Using the New
Homotopy Perturbation Method
Recently, many authors have applied the HPM to solve the various non-linear problem in engineering sciences [23]-[28]. This method is a combination of Homotopy in topology and classic perturbation techniques. The HPM has uni-queness in its applicability, accuracy, and efficiency. Recently, a new approach of HPM with zeroth iteration has been applied to solve the nonlinear problem. In this work, a new approach to Homotopy perturbation method is used (Appen- dix A and Appendix B) to solve the nonlinear differential Equations (5)-(13). Using this method, the analytical expression of the concentration of substrate
( )
S x , Product P x
( )
and co-substrate C x( )
can be obtained as follows: The first order kinetic Equations (18)-(20) represent the simple and closed form of analytical expressions of concentrations of substrate, product and co- substrate for all possible values of the parameters. By using Equations (5)-(7) with boundary conditions (14), the following relation is also obtained:First order kinetic
Inhibitors Analytical solutions Figures Current Solutions Figures
Substrate ( ) 0 1 2
2 x
S x = +s A −x
(18) 1(a) 1 1
S S S I l A nFAD
ψ = = − (21) -
Product ( ) 1
(
2)
2 A
P x =−λ x −x (19)
1(b) and 1(c) 1
1 2 P P P I l A nFAD λ
ψ = = (22) 6(a)
Co
substrate ( )
(
)
( )2 1
0 1
2 A
C x =µρ x −x +c −x
(20)
1(d) and 1(f)
1 1 2 0
C C C I l A c nFAD µρ ψ = = − +
(23)
7(a) and 7(b)
Michaelis-Menten kinetic:
Inhibitors Analytical solutions Figures Current solutions Figures
Substrate ( ) 0 2 2
2 x
S x = +s A −x
(24) 2(a) 2 2
S S S I l A nFAD
ψ = = − (27) -
Product ( ) 2
(
2)
2A
P x =−λ x −x (25)
2(b) and 2(c) 2
2 2 P P P I l A nFAD λ
ψ = = (28) 6(b)
Co substrate ( )
(
)
( )2 2
0 1
2 A
C x =µρ x −x +c −x
(26)
2(d) and 2(f)
2 2 2 0
C C C I l A c nFAD µρ ψ = = − +
(29)
7(c) and 7(d)
The Ping pong kinetic: Equations (30)-(32) represent the simple and closed forms of analytical expressions of concentrations of substrate, product and co- substrate for all possible values of the parameters. By using Equations (11)-(13) with boundary conditions (14), the following relation is also obtained:
Ping pong kinetic:
Inhibitors Analytical solutions Figures Current solutions Figures
Substrate ( ) 0 3 2
2 x
S x = +s A −x
(30) 3(a) 3 3
S S S I l A nFAD
ψ = = − (33) -
Product ( ) 3
(
2)
2A
P x =−λ x −x (31) 3(b)
and 3(c) 3 32
P P P I l A nFAD λ
ψ = = (34) 6(c)
Co
substrate ( )
(
)
( )2 3
0 1
2 A
C x =µρ x −x +c −x
(32) 3(d)-(f)
3 3 0
2
C C
C
I l
A d c nFAD
µρ ψ = = − +
(35)
7(e) and 7(f)
where 2
1 0
A=φs ,
2 0 2 0 1 s A s φ =
+ and ( ) ( ) 2 3
0 0
.
1 1 1
A
s c
φ =
+ +
3. Numerical Simulation
The system of non-linear differential Equations (5)-(13) with boundary conditions (14) have been solved numerically using MATLAB software. A MATLAB script pdex4 is provided in Appendix C. In Figure 4, Tables 1-3 the numerical solu-tions are compared with the analytical results. The maximum average relative error between our analytical and numerical result is 0.94% for first order kinetic, 0.91% for Michaelis–Menten kinetic and 1.54% for Ping pong kinetic.
4. Results and Discussion
Table 1. Comparison of dimensionless concentrations S x P x
( ) ( )
, andC x( )
(Equa-tions (18)-(20)) and numerical simulation for first order kinetics when fixed value of
2
0.3, 10, 1 and 1
φ = λ= µ= ρ= .
Substrate Product Co-substrate
x This Work Equation (18) Numerical soln Error % of
This Work Equation
(19)
Numerical soln Error % of
This Work Equation
(20)
Numerical soln Error % of
[image:6.595.211.538.346.513.2]0.0 1.0000 1.0000 0.00 0.0000 0.0000 0.00 1.0000 1.0000 0.00 0.2 0.9512 0.9530 0.18 0.2400 0.2383 0.17 0.7760 0.7748 0.15 0.4 0.9139 0.9133 0.06 0.3600 0.3685 0.23 0.5640 0.5631 0.15 0.6 0.8875 0.8859 0.19 0.3600 0.3565 0.98 0.3640 0.3617 0.63 0.8 0.8719 0.8715 0.04 0.2400 0.2419 0.78 0.1760 0.1751 0.51 1.0 0.8667 0.8667 0.00 0.0000 0.0000 0.00 0.0000 0.0000 0.00 Average % error 0.94 Average % error 0.43 Average % error 0.29
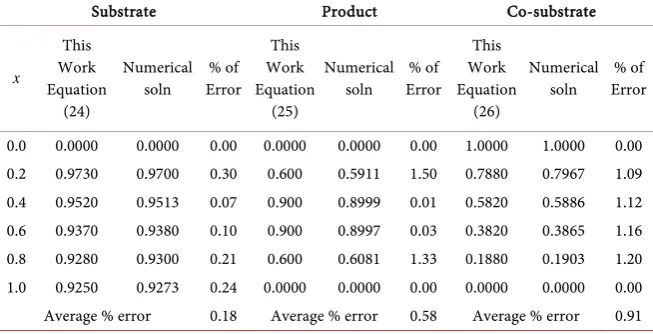
Table 2. Comparison of dimensionless concentrations S x P x
( ) ( )
, andC x( )
(Equation(24)-(26)) and numerical simulation for Michaelis-Menten kinetics when fixed value of
2
0.3, 50, 1 and 1
φ = λ= µ= ρ= .
Substrate Product Co-substrate
x This Work Equation (24) Numerical soln Error % of
This Work Equation
(25)
Numerical soln Error % of
This Work Equation
(26)
Numerical soln Error % of
0.0 0.0000 0.0000 0.00 0.0000 0.0000 0.00 1.0000 1.0000 0.00 0.2 0.9730 0.9700 0.30 0.600 0.5911 1.50 0.7880 0.7967 1.09 0.4 0.9520 0.9513 0.07 0.900 0.8999 0.01 0.5820 0.5886 1.12 0.6 0.9370 0.9380 0.10 0.900 0.8997 0.03 0.3820 0.3865 1.16 0.8 0.9280 0.9300 0.21 0.600 0.6081 1.33 0.1880 0.1903 1.20 1.0 0.9250 0.9273 0.24 0.0000 0.0000 0.00 0.0000 0.0000 0.00 Average % error 0.18 Average % error 0.58 Average % error 0.91
Table 3. Comparison of dimensionless concentrations S x P x
( ) ( )
, andC x( )
(Equa-tions (30)-(32)) and numerical simulation for ping pong kinetics when fixed value of
2
0.1, 10, 10 and 1
φ = λ= µ= ρ= .
Substrate Product Co-substrate
x This Work Equation (30) Numerical soln Error % of
This Work Equation
(31)
Numerical soln Error % of
This Work Equation
(32)
Numerical soln Error % of
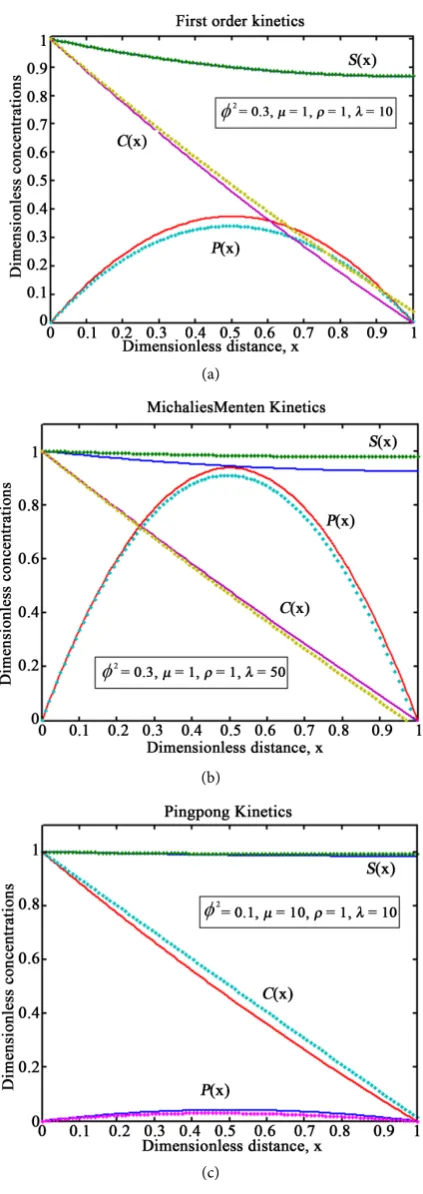
[image:6.595.211.538.574.738.2]Figures 1-3 show the plots of all the concentrations versus dimensionless dis-tance x for various values of parameters. For φ >2 1, biosensors act in diffu-sion regime, and for 2
1
φ < , the biosensors act in rule of limiting kinetic. Reac-tion rate constant for substrate KS is dependable from enzyme concentration and characterized enzyme. There are different enzymes for various tissues, where as reaction rate constant is permanent for the given tissue. The strong af-finity between enzyme and substrate shows low value of kinetics and poor affin-ity shows high value.
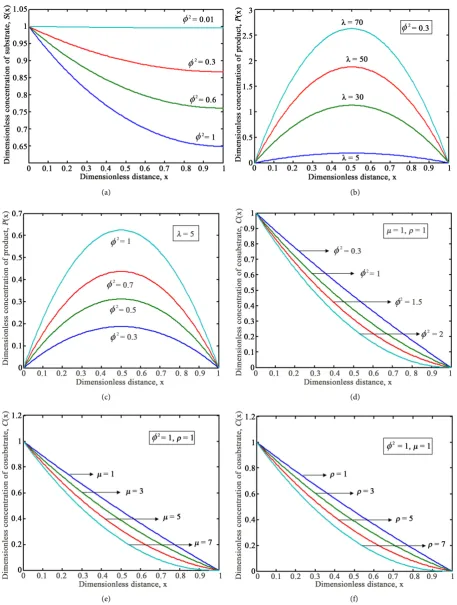
The substrate concentration S x
( )
approaches unity at x=0. The substrate concentration increases with decreasing Thiele module. When the ratio of diffu-sion coefficientλ increases, the Thiele module increases the product. The con-centration of co-substrate increases, when Thiele module decreases. If the ratio of diffusion coefficient µ and ratio of reaction rate constant ρ increases, the concentration of co-substrate decreases.Figure 4 focuses the concentration on the first-order kinetics, Michaelis- Menten kinetics, and ping-pong kinetic mechanism of the substrate S x
( )
,product P x
( )
and co-substrate C x( )
for particular values of parameters.The analytical results are compared with the numerical results as given in Tables 1-3 for fixed values of parameters and satisfactory agreement is noted. In all the cases, the average relative error is less than 1.54%.
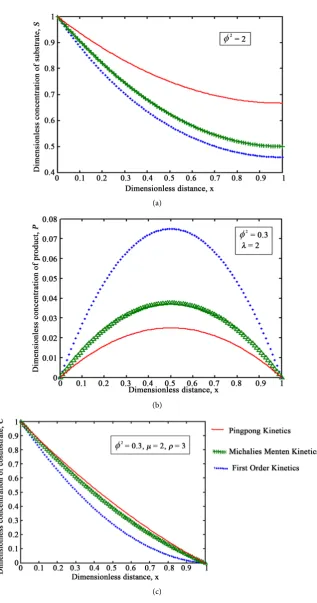
Figure 5 represents the concentration of the substrate, product and co-sub- strate vursus distance for the first-order kinetics, Michaelis–Menten kinetics, and ping-pong kinetic mechanism for particular values of parameters. From this figure, it is inferred that the concentration of the ping-pong kinetics largely cor-responds to the other two mechanisms. But for the co substrate, the concentra-tion does not show much difference. From these Figure, it is concluded that the dimensionless concentration of substrate and co-substrateis greater for the Ping-Pong than the first order and M-M kinetics.
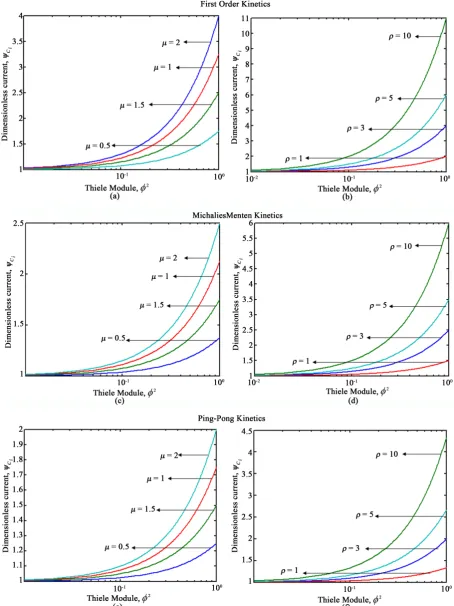
Figure 6 and Figure 7 represent the dimensionless current profiles of product and co-substrate for various values of dimensionless parameters. The current depends on the product and co-substrate gradient at the electrode surface. DS has no influenced over biosensor response, but DC and DP has been increas-ing the value of the diffusion constant DC and DP leads to small values of response time.
4. Conclusion
(a) (b)
(c) (d)
[image:8.595.71.529.68.674.2](e) (f)
Figure 1. (a)-(f) Plot of dimensionless concentrations of the substrate S x
( )
, product P x( )
and co-substrate C x( )
versusdimensionless distance x of the first-order kinetics are calculated using Equations (18), (19) and (20), respectively for different values of the Thiele modulus φ2, Diffusion coefficient of λ, Reaction rate constant for co-substrate µ, and Diffusion
(a) (b)
(c) (d)
[image:9.595.71.528.59.671.2](e) (f)
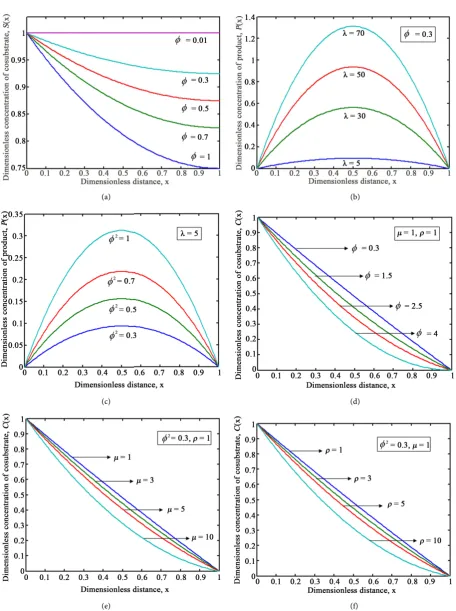
Figure 2. Plot of dimensionless concentrations of the substrate S x
( )
, product P x( )
and co-substrate C x( )
versusdimen-sionless distance x of the Michalies menten kinetics are calculated using Equations (24), (25) and (26), respectively for different values of the Thiele modulus φ2, Diffusion coefficient of λ, Reaction rate constant for co-substrate µ, and Diffusion
(a) (b)
(c) (d)
[image:10.595.70.532.60.678.2](e) (f)
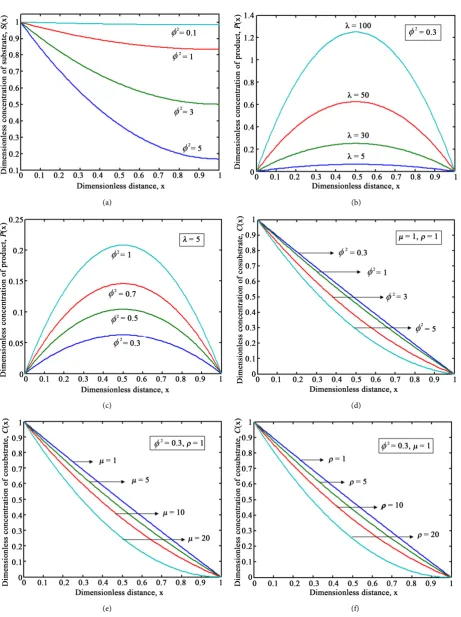
Figure 3. (a)-(f) Plot of dimensionless concentrations of the substrate S x
( )
, product P x( )
and co-substrate C x( )
versusdimensionless distance x of the Michalies menten kinetics are calculated using Equations (30), (31) and (32),respectively for dif-ferent values of the Thiele modulus φ2, Diffusion coefficient of λ, Reaction rate constant for co-substrate µ, and Diffusion
(a)
(b)
[image:11.595.267.479.65.663.2](c)
Figure 4. Concentration of substrate S x
( )
, Product P x( )
and co-substrate C x( )
(a)
(b)
[image:12.595.215.533.59.663.2](c)
Figure 5. Concentration of substrate S x
( )
, Product P x( )
and co-substrate C x( )
(a)
(b)
[image:13.595.257.489.66.684.2](c)
Figure 6. Generalised graph of the dimensionless current for product ψPi versus Thiele
module φ2 of first order, Michalies-Menten and ping-pong kineticare represented using
Figure 7. Generalised graph of the dimensionless current for co-substrate product ψCi versus Thiele module
2
of the procedure to other systems nonlinear equation in various type of biosen-sor seems to be possible.
References
[1] Thevenot, D.R., Toth, K., Durst, R.A. and Wilson, G.S. (2001) Electrochemical Bio-sensors: Recommended Definitions and Classification. Biosensors and Bioelectron-ics, 16, 121-131.
[2] Newman, J.D., Tigwell, L.J., Turner, A.P.F. and Warner, P.J. (2004) Biosensors—A Clearer View. Cranfield University Publication.
[3] Mascini, M. and Tombelli, S. (2008) Biosensors for Biomarkers in Medical Diagnos-tics. Biomarkers, 13, 637-657. https://doi.org/10.1080/13547500802645905
[4] Zhang, Y., Yang, D., Weng, L. and Wang, L. (2013) Early Lung Cancer Diagnosis by Biosensors. International Journal of Molecular Sciences, 14, 15479-15509.
https://doi.org/10.3390/ijms140815479
[5] Turner, A.P. (2013) Biosensors: Sense and Sensibility. Chemical Society Review, 42, 3184-3196.
[6] Rangelova, V., Katsarova, P. and Iliev, K.J. (2007) Influence of Parameters over Biosensors Response in Dynamic Mode at Different Enzyme Kinetic. Annals of the Faculty of Engineering Hunedoara—Journal of Engineering, 5, 105-112.
[7] Rangelova, V. (2006) Modeling Amperometric Biosensor with Cyclic Reaction. An-nals of the Faculty of Engineering Hunedoara—Journal of Engineering, 5, 116-122. [8] Rangelova, V., Pandelova, A. and Stoiyanov, N. (2011) Inhibitor Multienzyme
Bio-sensor System in Dynamic Mode—Phosphate Measurement. Annals of the Faculty of Engineering Hunedoara—Journal of Engineering, 9, 83-86.
[9] Tothill, I.E. (2001) Biosensors Developments and Potential Applications in the Agricultural Diagnosis Sector. Computers and Electronics in Agriculture, 30, 205- 218.
[10] Mishra, S., Saadat, D., Kwon, O., Lee, Y., Choi, W.S., Kim, J.H. and Yeo, W.H. (2016) Recent Advances in Salivary Cancer Diagnostics Enabled by Biosensors and Bioelectronics. Biosensors and Bioelectronics, 81, 181-197.
[11] Cortina, M.E., Melli, L.J., Roberti, M., Mass, M., Longinotti, G., Tropea, S., Lloret, P., Serantes, D.A.R., Salomón, F., Lloret, M., Caillava, A.J., Restuccia, S., Altcheh, J., Buscaglia, C.A., Malatto, L., Ugalde, J.E., Fraigi, L., Moina, C., Ybarra, G., Ciocchini, A.E. and Comerci, D.J. (2016) Electrochemical Magnetic Microbeads-Based Bio-sensor for Point-of-Care Sero-Diagnosis of Infectious Diseases. Biosensors and Bio-electronics, 80, 24-33.
[12] Lawal, A.T. (2016) Synthesis and Utilization of Carbon Nanotubes for Fabrication of Electrochemical Biosensors. Materials Research Bulletin, 73, 308-350.
[13] Gruhl, F.J., Rapp, B.E. and Länge, K. (2013) Biosensors for Diagnostic Applications. In: Seitz, H. and Schumacher, S., Eds., Molecular Diagnostics. Advances in Bio-chemical Engineering/Biotechnology, Vol. 133, Springer, Berlin, Heidelberg, 115- 148. https://doi.org/10.1007/10_2011_130
[14] Baronas, R., Ivanauskas, F. and Kulys, J. (1999) Modelling a Biosensor Based on the Heterogeneous Microreactor. Journal of Mathematical Chemistry, 25, 245-252.
https://doi.org/10.1023/A:1019192618843
[15] Ames, W.F. (1977) Numerical Methods for Partial Differential Equations. 2nd Edi-tion, Academic Press, New York.
Potentiometric Biosensors and System of Nonlinear Equations—Homotopy Per-turbation Approach. Journal of Electroanalytical Chemistry, 644, 50-59.
[17] Loghambal, S. and Rajendran, L. (2011) Mathematical Modeling in Amperometric Oxidase Enzyme-Membrane Electrodes. Journal of Membrane Science, 373, 20-28. [18] Manimozhi, P., Subbiah, A. and Rajendran, L. (2010) Solution of Steady-State
Sub-strate Concentration in the Action of Biosensor Response at Mixed Enzyme Kinet-ics. Sensors and ActuatorsB: Chemical, 147, 290-297.
[19] Venugopal, K., Eswari, A. and Rajendran, L. (2011) Mathematical Model for Steady State Current at PPO-Modified Micro-Cylinder Biosensors. Journal of Biomedical Science and Engineering, 4, 631-641. https://doi.org/10.4236/jbise.2011.49079
[20] Kirthiga, O.M. and Rajendran, L. (2015) Approximate Analytical Solution for Non-Linear Reaction Diffusion Equations in a Mono-Enzymatic Biosensor Involv-ing Michaelis-Menten Kinetics. Journal of Electroanalytical Chemistry, 751, 119- 127.
[21] Saravanakumara, K., Rajendrana, L. and Sangaranarayananb, M.V. (2015) Cur-rent-Potential Response and Concentration Profiles of Redoxpolymer-Mediated Enzyme Catalysis in Biofuel Cells—Estimation of Michaelis-Menten Constants.
Chemical Physics Letters, 621, 117-123.
[22] Katzarova, P., Rangelova, V. and Kuneva, S. (2006) Two Parameters Diagnostic of Biosensor Transducers. Biotechnology & Biotechnological Equipment, 20, 190-194.
https://doi.org/10.1080/13102818.2006.10817331
[23] Öziş, T. and Yildirim, A. (2007) A Comparative Study of He’s Homotopy Perturba-tion Method for Determining Frequency-Amplitude RelaPerturba-tion of a Nonlinear Oscil-lator with Discontinuities. International Journal of Nonlinear Sciences and Numer-ical Simulation, 8, 243-248. https://doi.org/10.1515/IJNSNS.2007.8.2.243
[24] Mousa, M.M. and Ragab, S.F. (2008) Application of the Homotopy Perturbation Method to Linear and Nonlinear Schrödinger Equations. Zeitschrift fur Naturfor-schung, 63, 140-144.
[25] He, J.H. (1999) Homotopy Perturbation Technique. Computer Methods in Applied Mechanics and Engineering, 178, 257-262.
[26] Rajendran, L. and Anitha, S. (2013) Reply to “Comments on Analytical Solution of Amperometric Enzymatic Reactions Based on HPM”. Electrochimica Acta, 102, 474-476.
[27] Meena, V., Indira, K., Kumar, S. and Rajendran, L. (2014) A New Mathematical Model for Effectiveness Factors in Biofilm under Toxic Conditions. Alexandria En-gineering Journal, 53, 917-928.
Appendix A
Approximate analytical solutions for Equations (8)-(10) (Michaelis-Men- ten kinetic) using HPM:
In order to solve Equation (8-10) by means of the new HPM, first the Zeroth order deformation equation is constructed.
(
)
22 22 2d d
1
1
d d
S S S
p p S x x φ − = − +
(A1)
(
)
22 22 2d d
1
1
d d
P P S
p p S x x φ − = − +
(A2)
(
)
22 22 2d d
1
1
d d
C C S
p p S x x φ − = − +
(A3) The approximate solutions of Equations (A1), (A2) and (A3) are as follows
2
0 1 2
2
0 1 2
2
0 1 2
S S pS p S
P P pP p P
C C pC p C
= + + + = + + + = + + + (A4)
Substituting (A4) in Equation (A1) and equating the like powers of p, we get 2 0 0 2 d : 0 d S p
x = (A5) 2
2
1 1 0
2 0 d : 1 d S S p S x λφ − =
+ (A6) Substituting (A4) in Equation (A2) and equating the like powers of p, we get
2 0 0 2 d : 0 d P p
x = (A7) 2
2
1 1 0
2 0 d : 1 d S P p S x λφ =
+ (A8)
Substituting (A4) in Equation (A3) and equating the like powers of p, we get 2 0 0 2 d : 0 d C p
x = (A9) 2
2
1 1 0
2 0 d : 1 d S P p S x µρφ − =
+ (A10)
The boundary conditions in Equation (14) becomes
(
)
(
) (
)
(
)
(
)
(
)
0
0 0 0 0
0 0 0
d
0 , , 0 0, 0
d
and 0 , 0
S
S x s x l P x P x l
x
C x c C x l
= = = = = = =
= = = = (A11)
and
(
)
(
) (
)
(
)
(
)
(
)
d
0 0, , 0 0, 0
d
and 0 0, 0 for all 1, 2, 3,
i
i i i
i i
S
S x x l P x P x l
x
C x C x l i
= = = = = = =
Now by applying the boundary conditions (A11) in (A5), (A7) and (A9), we get
( )
0 0
S x =s (A13)
( )
0 0
P x = (A14)
( )
(
)
0 0 1
C x =c −x (A15)
Substituting the values of S P0, 0 and C0 in Equation (A6), (A8) and (A10), and respectively by solving the equations using the boundary conditions (A12), the following results are obtained:
( )
2 21
0 1 0 2
S x x
x
S S
φ
= −
+ (A16)
( )
(
2 0)
(
2)
10
2 1
S
P x x x
S λφ −
= −
+ (A17)
( )
(
2 0)
(
2)
10
2 1
S
C x x x
S µρφ
= −
+ (A18)
Adding Equations (A13) and (A16), we get Equation (24) in the text. Similarly, Equation (25) and Equation (26) are got in the text.
Appendix B
Approximate analytical solutions for Equations (11-13) (ping-pong ki-netic) using HPM:
In order to solve Equations (11-13) by means of the new HPM, first the Ze-roth order deformation equation is constructed.
(
)
22 22 2d d
1
1 1 1
d d S S p p S C x x φ − = − + +
(B1)
(
)
22 22 2d d
1
1 1 1
d d C C p p S C x x φ − = − + +
(B2)
(
)
22 22 2d d
1
1 1 1
d d P P p p S C x x φ − = + + +
(B3) The approximate solutions of Equations (B1), (B2) and (B3) are as follows
2
0 1 2
2
0 1 2
2
0 1 2
S S pS p S
P P pP p P
C C pC p C
= + + + = + + + = + + + (B4)
Substituting (B4) in Equations (B1) and equating the like powers of p, we get 2 0 0 2 d : 0 d S p
x = (B5)
2 2 1 1 2 0 0 d :
1 1 1
d S p s c x φ =
Substituting (B4) in Equation (B2) and equating the like powers of p, we get 2 0 0 2 d : 0 d P p
x = (B7)
2 2 1 1 2 0 0 d :
1 1 1
d P p s c x λφ − =
+ + (B8)
Substituting (B4) in Equation (B3) and equating the like powers of p, we get 2 0 0 2 d : 0 d C p
x = (B9)
2 2 1 1 2 0 0 d :
1 1 1
d C p s c x µρφ =
+ + (B10)
The boundary conditions in Equation (14) becomes
(
)
(
) (
)
(
)
(
)
(
)
0
0 0 0 0
0 0 0
d
0 , , 0 0, 0
d
and 0 , 0
S
S x s x l P x P x l
x
C x c C x l
= = = = = = =
= = = = (B11)
and
(
)
(
)
(
)
(
)
(
)
d
0 0, , ( 0) 0, 0
d
and 0 0, 0 for all 1, 2, 3,
i
i i i
i i
S
S x x l P x P x l
x
C x C x l i
= = = = = = =
= = = = = (B12)
Now by applying the boundary conditions (B11) in (B5), (B7) and (B9), we get
( )
0 0
S x =s (B13)
( )
0 0
P x = (B14)
( )
(
)
0 0 1
C x =c −x (B15)
Substituting the values of S P0, 0 and C0 in Equation (B6), (B8) and (B10), and solving the equations using the boundary conditions (B12), the following results are obtained:
( )
2 21
0 0
1 1 1 2
x
S x x
s c
φ
= −
+ + (B16)
( )
(
2)
(
2)
1
0 0
2 1 1 1
P x x x
s c
φ λ −
= −
+ + (B17)
( )
(
2)
(
2)
1
0 0
2 1 1 1
C x x x
s c
φ µρ −
= −
+ + (B18)
Adding Equations (B13) and (B16), we get Equation (30) in the text. Similarly, Equation (31) and Equation (32) are got in the text.
Appendix C
function pdex4 m = 0;
x = linspace(0,1); t=linspace(0,100000);
sol = pdepe(m,@pdex4pde,@pdex4ic,@pdex4bc,x,t); u1 = sol(:,:,1);
u2 = sol(:,:,2); u3 = sol(:,:,3); figure
plot(x,u1(end,:)) title('u1(x,t)') xlabel('Distance x') ylabel('u1(x,2)')
%--- figure
plot(x,u2(end,:)) title('u2(x,t)') xlabel('Distance x') ylabel('u2(x,2)')
% --- figure
plot(x,u3(end,:)) title('u3(x,t)') xlabel('Distance x') ylabel('u3(x,2)')
%--- function [c,f,s] = pdex4pde(x,t,u,DuDx)
c = [1; 1; 1];
f = [1; 1; 1] .* DuDx; l=0.1;mu=0.5;q=1;p=5; F=-q^2*u(1);
F1=l*q^2*u(1); F2=-mu*p*q^2*u(1); s=[F; F1; F2];
% --- function u0 = pdex4ic(x);
u0 = [1; 1; 1];
% --- function [pl,ql,pr,qr]=pdex4bc(xl,ul,xr,ur,t)
pl = [ul(1)-1;ul(2)-0;ul(3)-1]; ql = [0; 0; 0];
Nomenclature
Symbol
1, 2, 3
A A A Dimensionless parameters
[ ]
S Concentration of substrate (mmol)[ ]
P Concentration of substrate (mmol)]
[
C
Concentration of substrate (mmol)S Dimensionless concentration of substrate (mmol) P Dimensionless concentration of product (mmol) C Dimensionless concentration of co-substrate (mmol)
0
s Initial concentration of substrate (mmol)
0
p Initial concentration of product (mmol)
0
c Initial concentration of co-substrate (mmol) i
K Reaction rate constant (mmol) i
D Diffusion coefficient (m2/s) m
V Enzymatic rate (mmol/s) i
I Output current n Number of electrons F Faraday’s number (C/mol) A Area of the electrode surface(m2) l Dimensionless distance
Greek symbols
λ Diffusion coefficient of substrate and product (Dimensionless) µ Diffusion coefficient of substrate and co-substrate (Dimensionless) ρ Reaction rate constant for substrate and co-substrate (Dimensionless)
2
φ
Thiele Module (Dimensionless) δ dimension distance (m)i
ψ Current (Dimensionless) Subscripts i=S P C, ,
Submit or recommend next manuscript to SCIRP and we will provide best service for you:
Accepting pre-submission inquiries through Email, Facebook, LinkedIn, Twitter, etc. A wide selection of journals (inclusive of 9 subjects, more than 200 journals)
Providing 24-hour high-quality service User-friendly online submission system Fair and swift peer-review system
Efficient typesetting and proofreading procedure
Display of the result of downloads and visits, as well as the number of cited articles Maximum dissemination of your research work
Submit your manuscript at: http://papersubmission.scirp.org/