ISSN Online: 2169-9674 ISSN Print: 2169-9658
DOI: 10.4236/ojd.2017.63007 Jul. 31, 2017 89 Open Journal of Depression
Can We Find Any Sustained Neurofunctional
Alteration in Remitted Depressive Patients
with a History of Modified Electroconvulsive
Therapy?
Ryo Saito
1, Kazuyuki Fujihara
1, Masato Kasagi
1, Tomokazu Motegi
1, Yusuke Suzuki
1,
Kosuke Narita
1*, Koichi Ujita
2, Masato Fukuda
11Department of Psychiatry and Neuroscience, Gunma University Graduate School of Medicine, Gunma, Japan
2Department of Diagnostic Radiology and Nuclear Medicine, Gunma University Graduate School of Medicine, Gunma, Japan
Abstract
Background and Aim: Recent magnetic resonance imaging (MRI) studies have revealed structural and functional differences in the human brain before and after an electroconvulsive therapy (ECT) series in patients with depres-sion. The hippocampus is one of the well-documented subcortical areas that show an increase in cortical volume following an ECT series. Moreover, some resting-state functional MRI studies have shown that an ECT series alters the connectivities of the hippocampus with several brain areas. However, it re-mains unknown whether ECT can induce some sustained neurofunctional al-terations in the human brain. Methods: In this study of the depressive pa-tients with and without a history of modified ECT (N = 5 and 9, respectively) using a cross-sectional design, we investigated the functional connectivity between the left and right hippocampi in terms of blood-oxygenation-level dependent signal changes with time by resting-state functional MRI. Results: Voxel-based morphometry showed no significant structural differences in hippocampal volume between the ECT and non-ECT groups. The ECT group showed a significantly lower functional connectivity between the same brain areas than the non-ECT group (p < 0.01). Conclusions: Although their clini-cal significance remains unclear, our results suggest that an ECT series induc-es a sustained neurofunctional alteration in the human brain.
Keywords
Resting-State Functional MRI, Modified Electroconvulsive Therapy, Depression, Hippocampus, Connectivity
How to cite this paper: Saito, R., Fujihara, K., Kasagi, M., Motegi, T., Suzuki, Y., Na-rita, K., Ujita, K., & Fukuda, M. (2017). Can We Find Any Sustained Neurofunctional Alteration in Remitted Depressive Patients with a History of Modified Electroconvul-sive Therapy? Open Journal of Depression, 6, 89-99.
https://doi.org/10.4236/ojd.2017.63007
Received: June 20, 2017 Accepted: July 28, 2017 Published: July 31, 2017
Copyright © 2017 by authors and Scientific Research Publishing Inc. This work is licensed under the Creative Commons Attribution International License (CC BY 4.0).
DOI: 10.4236/ojd.2017.63007 90 Open Journal of Depression
1. Introduction
The hippocampus (HPC), which is located in the subcortical cortex, is one of the key regions that play significant roles in both cognition and mood function in patients with major depressive disorder (Duman, 2004; Sapolsky, 2004; Snyder, Soumier, Brewer, Pickel, & Cameron, 2011). Several previous studies have shown a smaller gray matter (GM) volume of the left and/or right HPC in de-pressive patients than in healthy controls (Bell-McGinty et al., 2002; Steffens et al., 2000; Mervaala et al., 2000). Consistently, memory functions and neuroplas-ticity in HPC have been shown by animal and human research to be likely im-paired by stress (Videbech & Ravnkilde, 2004; Kim & Diamond, 2002).
Electroconvulsive therapy (ECT) is one of the major methods of treating drug-resistant depression. Recent neuroimaging studies have revealed structural and functional differences in the human brain before and after an ECT series
(Dukart et al., 2014; Jorgensen et al., 2016; Ota et al., 2015). Some studies have shown an increase in the GM volume of bilateral HPCs after ECT (Jorgensen et al., 2016; Ota et al., 2015); others have shown that an ECT series significantly contributes to the increase in the GM volume of the right HPC, but not to that of the left HPC (Dukart et al., 2014; Abbott et al., 2014). Moreover, recent func-tional magnetic resonance imaging (MRI) studies of ECT in depression have shown some laterality of neuronal connectivity of HPC. That is, the right hippo-campal connectivity with the left superior temporal lobe increased after an ECT series and correlated with the amelioration of depressive symptom, but no such increase in the left hippocampal connectivity with any brain regions was found
(Abbott et al., 2014).
The left and right HPCs are linked anatomically and functionally. Moreover, several significant differences in morphology and neuronal circuitry are ob-served between the left and right HPCs (Goto et al., 2010), e.g., GM volume and NMDA receptor distribution. Thus, it is possible that anatomical and functional differences in response to ECT series can exist between the left and right HPCs. On the basis of this assumption, ECT might alter the connectivity between the left and right HPCs, but knowledge about this alteration is still limited. In addi-tion, most of the previous studies of morphological or functional alterations af-ter ECT were conducted with short observational durations from a week to a few months, and there are only a few research studies focusing on the long-term ef-fect of ECT on a patient’s brain.
DOI: 10.4236/ojd.2017.63007 91 Open Journal of Depression
2. Methods
2.1. Subjects
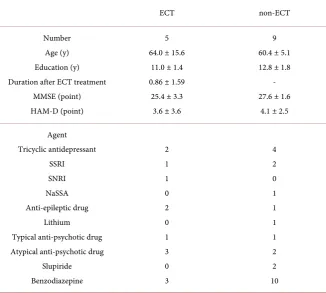
Five remitted depressive patients with a history of modified ECT [aged 51 - 85 years (mean, 64.0 ± 15.6 years); all females] and nine remitted depressive pa-tients without a history of ECT [aged 54 - 68 years (mean, 60.4 ± 5.1 years); all males] were enrolled in this study between April and September in 2014 in Gunma University Hospital (7 inpatients and 7 outpatients). The details of de-mographic data were shown in Table 1. All the subjects enrolled in this study were right-handed as assessed using the Edinburgh Handedness Inventory
[image:3.595.208.535.399.692.2](Oldfield, 1971). For the evaluation of their past and current psychological con-ditions, the DSM-IV-TR Axis I Disorder (American Psychiatric Association, 2000) was used. We used the Hamilton depression Rating Scale (HAM-D) to as-sess their depression grade (Hamilton, 1967). To attenuate the effect of severity of depressive symptoms on the analysis of MRI data, only those who showed HAM-D scores below 10 (i.e., defined as remitted condition) were enrolled as subjects in this study. Moreover, the Japanese version of Mini-Mental State Ex-amination (MMSE) was conducted for cognitive function assessment (Folstein, Folstein, & McHugh, 1975; Ideno, Takayama, Hayashi, Takagi, & Sugai, 2012). All the subjects in the ECT and non-ECT groups had taken antidepressants
Table 1. Demographic characteristics of study subjects.
ECT non-ECT
Number Age (y) Education (y) Duration after ECT treatment
MMSE (point) HAM-D (point)
5 64.0 ± 15.6
11.0 ± 1.4 0.86 ± 1.59
25.4 ± 3.3 3.6 ± 3.6
9 60.4 ± 5.1 12.8 ± 1.8
- 27.6 ± 1.6
4.1 ± 2.5
Agent Tricyclic antidepressant SSRI SNRI NaSSA Anti-epileptic drug Lithium Typical anti-psychotic drug Atypical anti-psychotic drug
Slupiride Benzodiazepine 2 1 1 0 2 0 1 3 0 3 4 2 0 1 1 1 1 2 2 10
DOI: 10.4236/ojd.2017.63007 92 Open Journal of Depression
and/or psychotropic agents (see Table 1). All the subjects provided their written informed consent. The study protocol was approved by the Ethics Committee of Gunma University. This research has an observational and retrospective study design, and the patients had received treatments based only on clinical signific-ance.
2.2. ECT Methods
All the patients were administered modified ECT 3 times a week using a brief-pulse square wave ECT device (Thymatron System IV, Somatics LLC, Lake Bluff, IL, USA). In all the patients, propofol was administered for anesthesia in-duction, and succinylcholine for muscle relaxation. All the patients were admi-nistered modified ECT bilaterally by bitemporal electrode placement at an ener-gy dosage 1.5 times above the seizure threshold. The seizure threshold is defined as the minimum stimulus dosage required generating an EEG seizure for at least 25 s. The initial dosage was determined by the half-age method.
2.3. T1-Weighted Anatomical Imaging and Functional MRI Data
Acquisition
Brain MRI was performed using Siemens 3-T Trio with a 12-channel head coil (Siemens, Erlangen, Germany) in Gunma University Hospital. High-resolution T1-weighted anatomical images [magnetization-prepared rapid acquisition with gradient echo (MP-RAGE) sequence] were acquired as follows: repetition time = 2000 ms; echo time = 2 ms; inversion time = 990 ms; flip angle = 9 degrees; field of view = 256 × 256 mm2; matrix size = 256 × 256; voxel size = 1 × 1 × 1 mm3.
Functional images in the resting and task states were collected using an echo- planar imaging (EPI) sequence (TR = 2500 ms, TE = 25 ms, flip angle = 90˚, FOV = 220 mm, matrix size = 64 × 64 with pixel dimensions of 3 × 3 mm2 for
256 times). Thirty-five axial slices with a thickness of 4 mm and an interslice gap of zero were acquired.
2.4. Measurements of GM Volumes in Left and Right HPCs
by T1-Weighted Imaging
For measurements of GM volumes in the left and right HPCs in each subject, T1-weighted volumetric images were analyzed using SPM8 (Wellcome Depart-ment of Cognitive Neurology, London, UK) impleDepart-mented in Matlab 2015a (MathWorks, Natick, MA, USA) to carry out VBM8
DOI: 10.4236/ojd.2017.63007 93 Open Journal of Depression
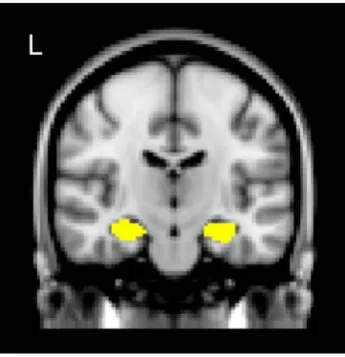
intracranial volume, as well as the regional GM volume expansion/contraction that occurs during nonlinear transformation. The aim of the modulation step was to render the final VBM statistical data reflective of the “volume” change rather than the “concentration” change in GM. GM image segments were in-spected for segmentation artifacts, then smoothed using an isotropic Gaussian kernel of 12 mm full width at half maximum (FWHM), to accommodate indi-vidual differences in the sulcal and gyral anatomy, and to meet the distributional assumptions of the general linear models necessary for statistical analysis. An absolute threshold mask of 0.10 was used to avoid possible edge effects around the border between GM and the white matter. Finally, we determined the GM volumes in the left and right HPCs, respectively, as follows: the mean signal in-tensities on T1-weighted images were extracted from the left or right HPC using the Harvard-Oxford Subcortical Structural Atlas from Version 6.0, which is part of the FMRIB’s Software Library (FSL, http://www.fmrib.ox.ac.uk/fsl), using a probability threshold mask of 60 (Figure 1). In addition, the left and right cere-bral hemispheres were also estimated as control ROIs, using the atlas of AAL (http://www.gin.cnrs.fr/AAL).
2.5. Functional Connectivity between Left and Right HPCs
in Terms of BOLD Signal Changes with Time
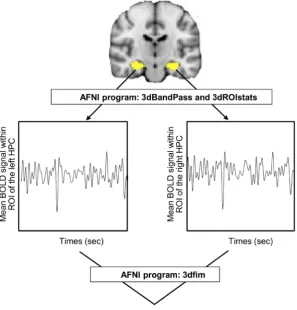
The obtained resting-state functional MRI data were analyzed using a temporal band-pass filter from 0.008 to 0.09 Hz with the AFNI program
[image:5.595.287.460.516.695.2](http://afni.nimh.nih.gov/afni) (Cox, 1996): 3 dB and pass (Figure 2). Then, we extracted the mean BOLD signal changes with time within each ROI in the left or right HPC in each subject using the AFNI program: 3dROIstats. Pearson’s product-moment correlation coefficient was used as an index of connectivity between the left and right HPCs in each subject, which was computed in terms of the mean BOLD signal changes with time within the above-mentioned ROIs, i.e., the left and right hemispheres of the cerebrum and HPC using the AFNI
Figure 1. ROI masks (yellow) of left and right hippocampi (HPCs) determined on the
DOI: 10.4236/ojd.2017.63007 94 Open Journal of Depression
Figure 2. Methods for calculating correlation coefficient “r” between left and right
hip-pocampi (HPCs) in terms of blood-oxygenation-level-dependent (BOLD) signals with time.
program: 3 dfim.
2.6. Statistical Analyses
Pearson’s correlation analysis was conducted to estimate the association between demographic characteristics and MRI data. The unpaired Student t-test was used for comparison between the ECT and non-ECT groups.
3. Results
No significant differences between the ECT and non-ECT groups were observed in age, years of education, and scores of HAM-D and MMSE. Moreover, mor-phometry showed no significant differences between the ECT and non-ECT groups in terms of the GM volume of all ROIs, i.e., the left and right hemis-pheres of the cerebrum and HPC. In both the ECT and non-ECT groups, age, years of education, and HAM-D and YMRS scores showed no significant associ-ations with GM volume or the correlation coefficient between time courses of BOLD signal changes in left and right HPC activities.
DOI: 10.4236/ojd.2017.63007 95 Open Journal of Depression
hemi-spheres in terms of BOLD signal changes using the resting-state functional MRI data of each subject, we found that all the subjects of both the ECT and non-ECT groups showed significant correlations between those brain areas (p < 0.001). Also, regarding the correlation between the left and right HPC activities, all the subjects of both the ECT and non-ECT groups showed significant corre-lations between those brain areas (p < 0.001). Pearson’s correlation analysis showed that the correlation between the left and right HPC activities no signifi-cantly correlated with age in both groups or each group of ECT and non-ECT (p > 0.05).
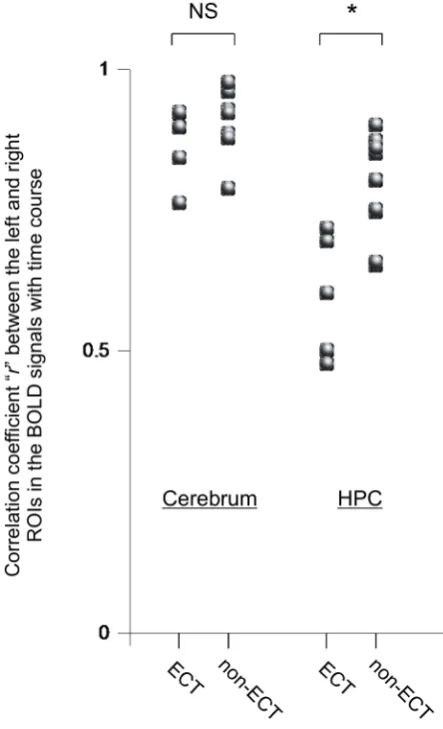
[image:7.595.260.482.309.674.2]The ECT group showed a significantly smaller correlation coefficient between the left and right HPCs than the non-ECT group (p < 0.01) (Figure 3: correla- tion coefficient r mean ± SD and range of ECT group and non-ECT group; 0.60 ± 0.10, 0.48 to 0.72 and 0.78 ± 0.09, 0.65 to 0.90, respectively). No significant differences in the correlation coefficient between the left and right cerebral he-mispheres were observed between the ECT and non-ECT groups.
Figure 3. Comparison between ECT and non-ECT groups in correlation coefficient “r”
DOI: 10.4236/ojd.2017.63007 96 Open Journal of Depression
4. Discussion
Despite the high effectiveness of ECT, the mechanism of ECT is still unknown. However, in recent years, the findings regarding the effects of ECT on brain vo-lume and neurofunction have gathered using Voxel-based morphometry and functional MRI. Although several previous research studies have shown the in-crease in the GM volume of HPC after ECT (Dukart et al., 2014; Jorgensen et al., 2016; Ota et al., 2015), the morphometry carried out in this study showed no significant differences between the ECT and non-ECT groups in the GM volume of all ROIs, i.e., the left and right hemi-spheres of the cerebrum and HPC. The observational durations after ECT in those previous studies [within 3 months
(Dukart et al., 2014), 1 - 4 weeks (Jorgensen et al., 2016), and 9.0 ± 14.6 days
(Ota et al., 2015)] were shorter than that in our study (0.86 ± 1.59 years). This might be a reason for the absence of a significant difference in GM volume be-tween the ECT and non-ECT groups in our study. Nordanskog’s study showed no significant difference between the GM volume of HPC before ECT and that 6 months after ECT (Nordanskog, Larsson, Larsson, & Johanson, 2014), which might support our finding.
In this study, the ECT group showed a significantly lower connectivity be-tween the left and right HPCs than the non-ECT group. On the other hand, no significant difference in the connectivity between the left and right cerebral he-mispheres was found between the ECT and non-ECT groups, which were meas-ured as control ROIs. These findings suggest that the depressive subjects with a history of ECT show sustained neurofunctional alterations, and that is greater asymmetry between bilateral hippocampal activities than those without a history of ECT.
The left and right HPCs are directly connected by the hippocampal commis-sure (Wilson, Culver, Waddington, & Gazzaniga, 1975), and their activities show definite synchronization (Goto et al., 2010). Consistently, all the subjects enrolled in this study showed significant correlations between the left and right HPCs in terms of the BOLD signal changes with time in resting-state functional MRI. On the other hand, the above-mentioned difference between the ECT and non-ECT groups in the connectivity between the left and right HPCs was ob-served in this study. The pathophysiological mechanisms underlying our find-ings are difficult to explain, because to the best of our knowledge there are no studies in which the connectivity between the left and right HPCs have been in-vestigated in subjects with a history of ECT. It can be speculated that the func-tional difference between the left and right HPCs affected our results, as shown by the laterality of NMDA receptor distribution in the HPCs in a previous study
neces-DOI: 10.4236/ojd.2017.63007 97 Open Journal of Depression
sary.
There were several limitations in this study. The power value was 0.08 in this study that was not enough to avoid type II error, owing to its small sample size. Furthermore, we were unable to analyze the causal relationship, that is, the effect of an ECT series on functional brain activities over a natural course, because of the cross-sectional design of this study. The ECT methods also lacked uniformi-ty. Furthermore, the associations of psychological and cognitive functions with connectivity between the left and right HPCs should be investigated in detail, because HPC plays significant roles in the functions. Future studies using a lon-gitudinal design having a large number of subjects and psychological and tive assessments will be required. Moreover, previous studies showed that cogni-tive functions were declined immediately after ECT than baseline (Bodnar et al., 2016), but did not change significantly 6 months or 12 months after ECT
(Nordanskog, Larsson, Larsson, & Johanson, 2014). Future longitudinal design research with a longer observation period over one year is needed.
In summary, the results of our study suggest that long-term neurofunctional alterations of connectivity between the left and right HPCs may occur. Whether an ECT series can cause neurofunctional alteration in the human brain is a very important issue clinically. Therefore, it is necessary that knowledge gained from studies such as this continue to be accumulated in the future.
Acknowledgements
KN acknowledges the support from JSPS KAKENHI grants (Numbers JP 23591695 and 15KK0295).
References
Abbott, C. C., Jones, T., Lemke, N. T., Gallegos, P., McClintock, S. M., Mayer, A. R., & Calhoun, V. D. (2014). Hippocampal Structural and Functional Changes Associated with Electroconvulsive Therapy Response. Translational Psychiatry, 4, e483.
https://doi.org/10.1038/tp.2014.124
American Psychiatric Association (2000). Diagnostic and Statistical Manual of Mental Disorders (4th Editon, text rev.). Washington, DC: Author.
Bell-McGinty, S., Butters, M. A., Meltzer, C. C., Greer, P. J., Reynolds, C. F., & Becker, J. T. (2002). Brain Morphometric Abnormalities in Geriatric Depression: Long-Term Neurobiological Effects of Illness Duration. American Journal of Psychiatry, 159, 1424- 1427. https://doi.org/10.1176/appi.ajp.159.8.1424
Bodnar, A., Krzywotulski, M., Lewandowska, A., Chlopocka-Wozniak, M., Bartkowska- Sniatkowska, A., Michalak, M., & Rybakowski, J. K. (2016). Electroconvulsive Therapy and Cognitive Functions in Treatment-Resistant Depression. The World Journal of Bi-ological Psychiatry, 17, 159-164. https://doi.org/10.3109/15622975.2015.1091501 Cox, R. W. (1996). AFNI: Software for Analysis and Visualization of Functional Magnetic
Resonance Neuroimages. Computers and Biomedical Research, 29, 162-173.
https://doi.org/10.1006/cbmr.1996.0014
DOI: 10.4236/ojd.2017.63007 98 Open Journal of Depression in Mood Disorders. Proceedings of the National Academy of Sciences of the United States of America, 111, 1156-1161. https://doi.org/10.1073/pnas.1321399111
Duman, R. S. (2004). Depression: A Case of Neuronal Life and Death? Biological Psy-chiatry, 56, 140-145. https://doi.org/10.1016/j.biopsych.2004.02.033
Folstein, M. F., Folstein, S. E., & McHugh, P. R. (1975). Mini-Mental State: A Practical Method for Grading the Cognitive State of Patients for the Clinician. Journal of Psy-chiatric Research, 12, 189-198. https://doi.org/10.1016/0022-3956(75)90026-6 Goto, K., Kurashima, R., Gokan, H., Inoue, N., Ito, I., & Watanabe, S. (2010). Left-Right
Asymmetry Defect in the Hippocampal Circuitry Impairs Spatial Learning and Work-ing Memory in iv Mice. PLoS ONE, 5, e15468.
https://doi.org/10.1371/journal.pone.0015468
Hamilton, M. (1967). Development of a Rating Scale for Primary Depressive Illness. Brit-ish Journal of Social and Clinical Psychology, 6, 278-296.
https://doi.org/10.1111/j.2044-8260.1967.tb00530.x
Ideno, Y., Takayama, M., Hayashi, K., Takagi, H., & Sugai, Y. (2012). Evaluation of a Japanese Version of the Mini-Mental State Examination in Elderly Persons. Geriatrics & Gerontology International, 12, 310-316.
https://doi.org/10.1111/j.1447-0594.2011.00772.x
Jorgensen, A., Magnusson, P., Hanson, L. G., Kirkegaard, T., Benveniste, H., Lee, H., Jor-gensen, M. B. et al. (2016). Regional Brain Volumes, Diffusivity, and Metabolite Changes after Electroconvulsive Therapy for Severe Depression. Acta Psychiatrica Scandinavica, 133, 154-164.https://doi.org/10.1111/acps.12462
Kim, J. J., & Diamond, D. M. (2002). The Stressed Hippocampus, Synaptic Plasticity and Lost Memories. Nature Reviews. Neuroscience, 3, 453-462.
Mervaala, E., Föhr, J., Könönen, M., Valkonen-Korhonen, M., Vainio, P., Partanen, K., Lehtonen, J. et al. (2000). Quantitative MRI of the Hippocampus and Amygdala in Se-vere Depression. Psychological Medicine, 30, 117-125.
https://doi.org/10.1017/S0033291799001567
Michael, N., Erfurth, A., Ohrmann, P., Arolt, V., Heindel, W., & Pfleiderer, B. (2003). Metabolic Changes within the Left Dorsolateral Prefrontal Cortex Occurring with Electroconvulsive Therapy in Patients with Treatment Resistant Unipolar Depression.
Psychological Medicine, 33, 1277-1284.
https://doi.org/10.1017/S0033291703007931
Nordanskog, P., Larsson, M. R., Larsson, E. M., & Johanson, A. (2014). Hippocampal Volume in Relation to Clinical and Cognitive Outcome after Electroconvulsive Thera-py in Depression. Acta Psychiatrica Scandinavica, 129, 303-311.
https://doi.org/10.1111/acps.12150
Oldfield, R. C. (1971). The Assessment and Analysis of Handedness: The Edinburgh In-ventory. Neuropsychologia, 9, 97-113.
Ota, M., Noda, T., Sato, N., Okazaki, M., Ishikawa, M., Hattori, K., Kunugi, H. et al. (2015). Effect of Electroconvulsive Therapy on Gray Matter Volume in Major Depres-sive Disorder. Journal of Affective Disorders, 186, 186-191.
Park, H. G., Yu, H. S., Park, S., Ahn, Y. M., Kim, Y. S., & Kim, S. H. (2014). Repeated Treatment with Electroconvulsive Seizures Induces HDAC2 Expression and Down- Regulation of NMDA Receptor-Related Genes through Histone Deacetylation in the Rat Frontal Cortex. The International Journal of Neuropsychopharmacology, 17, 1487- 1500.https://doi.org/10.1017/S1461145714000248
DOI: 10.4236/ojd.2017.63007 99 Open Journal of Depression Snyder, J. S., Soumier, A., Brewer, M., Pickel, J., & Cameron, H. A. (2011). Adult Hippo-campal Neurogenesis Buffers Stress Responses and Depressive Behaviour. Nature, 476, 458-461. https://doi.org/10.1038/nature10287
Steffens, D. C., Byrum, C. E., McQuoid, D. R., Greenberg, D. L., Payne, M. E., Blitching-ton, T. F., Krishnan, K. R. R. et al. (2000). Hippocampal Volume in Geriatric Depres-sion. Biological Psychiatry, 48, 301-309.
Videbech, P., & Ravnkilde, B. (2004). Hippocampal Volume and Depression: A Meta- Analysis of MRI Studies. The American Journal of Psychiatry, 161, 1957-1966.
https://doi.org/10.1176/appi.ajp.161.11.1957
Wilson, D. H., Culver, C., Waddington, M., & Gazzaniga, M. (1975). Disconnection of the Cerebral Hemispheres. An Alternative to Hemispherectomy for the Control of In-tractable Seizures. Neurology, 25, 1149-1153.
https://doi.org/10.1212/WNL.25.12.1149
Submit or recommend next manuscript to SCIRP and we will provide best service for you:
Accepting pre-submission inquiries through Email, Facebook, LinkedIn, Twitter, etc. A wide selection of journals (inclusive of 9 subjects, more than 200 journals)
Providing 24-hour high-quality service User-friendly online submission system Fair and swift peer-review system
Efficient typesetting and proofreading procedure
Display of the result of downloads and visits, as well as the number of cited articles Maximum dissemination of your research work