Working Paper 11
The Unorganised Worker: Problems at Work, Routes to Support and Views on Representation
The Unrepresented Worker Survey 2004
Who experiences problems at work, what problems do they experience, what do they do about them and what happens as a result?
Anna Pollert & Andy Charlwood
2008
ISBN: 978-1-86043-435-8
ANNA POLLERT ANDY CHARLWOOD
Centre for Employment Studies Research The York Management School Bristol Business School University of York University of the West of England
Contents
Acknowledgements... iii
Executive summary ... 1
1. Introduction ... 5
2. The nature of the problems. ... 11
3. What do unrepresented workers do about problems at work?... 35
4. Vulnerable Workers and Trade Unions. ... 50
5. Voice, resolution and exit: what happened to workers with problems?... 59
6. Conclusions. ... 66
Technical Appendix ... 71
List of Tables
Table 2.1: The nature of problems ...12
Table 2.2: Overlap of problems over 3 years, in rank order of problem occurrence ...13
Table 2.3: Number of problems experienced in screened job...13
Table 2.4: Pay problems by types ...14
Table 2.5: Work relations problems by types ...15
Table 2.6: Workload problems by types ...15
Table 2.7: Working hours problems by types ...16
Table 2.8: Job security problems by types ...16
Table 2.9: Contract/job description-related problems by types ...17
Table 2.10: Health and safety problems by types ...18
Table 2.11: Time-off problems by types ...18
Table 2.12: Opportunities problems by types...19
Table 2.13: Discrimination problems by types...20
Table 2.14: Percentage in each problem area who thought that this problem infringed their rights .23 Table 2.15: Incidence of all problems in one job by individual, job and workplace characteristics...24
Table 2.16: Comparison of percentage of respondents with each problem in workplaces with and without grievance/disciplinary procedures...30
Table 2.17: Comparison of percentage of respondents with each problem in workplaces with and without information and consultation procedures ...32
18Table 3.1: Sources of advice, percentage of sample ...36
19Table 3.2: Advice was given, percentage of those who sought advice...38
20Table 3.3: Did the respondent take action on their main problem?...41
21Table 3.4: Respondents, number of problems in screened job, and percentage who acted ...41
22Table 3.5: What actions did respondents take? ...42
23Table 3.6: What did workers do when they joined with others? ...47
24Table 4.1: Reasons for never having joined a trade union...52
25Table 4.2: Reasons for having left union membership ...52
26Table 4.3: General attitudes towards trade unions, percent ...53
27Table 4.4: Reasons for not wanting to join a union ...56
28Table 5.1: Were respondents who left the screened job less likely to take action?...61
29Table 5.2: Outcomes by the presence of workplace grievance procedures and consultation ...63
30Table A1: List of problems...73
31Table A2: Screening and exclusion stages of unrepresented worker sample achievement...78
Acknowledgements
This report is based on an ESRC funded research project, The Unorganised
Worker, Routes to Support and Views on Representation (Grant R000239679, Anna Pollert). The survey was conducted by Anna Pollert and IFF in 2004. Thanks to Gill Dix and Margaret Fox at ACAS for their support and advice at the outset of the project, IFF and particularly Zehra Koroglu for creative and collaborative involvement in questionnaire design, and to research fellows Michael Fisher and Surhan Cam. The dataset is deposited at the Economic and Social Data Service UK Data Archive. Working Papers 1-7 on this project can be found at http://www.uwe.ac.uk/bbs/research/cesr/workingpapers.shtml, website of the Centre for Employment Studies Research, Bristol Business School, University of the West of England. Further statistical analysis, presented here, was conducted by Anna Pollert and Andy Charlwood, who bear all responsibility for interpretation and conclusions.
Executive summary
This report is based on a survey, the Unrepresented Worker Survey (URWS), conducted in 2004 of 501 low-paid, non-unionised workers who had experienced problems at work in the previous three years.
Before selecting only those who earned below the median and were not unionised, the survey found that almost half of those contacted reported experiencing a problem at work in the previous three years. This is similar to the 42 per cent having had a problem in the previous five years found in a recent government commissioned study (Casebourne et al. 2006) and suggests that problems at work are widespread in the British workforce.
The majority of the sample, 58 per cent, had never been union members, 34 per cent had been members at some time and 6 per cent were members when they had their problems, but had no union recognition or representation.
The majority (61 per cent) took advice about their main problem as soon as it started. Women, disabled workers and those who perceived their rights to have been violated were more likely to have sought advice. Several sources of advice were sought, with a third approaching managers and friends and work colleagues. A significant minority sought help from Citizens’ Advice (13 per cent), but few approached trade unions, ACAS or Law Centres (5, 3 and 1 per cent respectively). Workers were most strongly influenced by the advice of friends or colleagues (20 per cent), followed by family and friends (16 per cent). Managers had greatest influence for only a tenth of respondents. Over half were advised to seek managers informally and only 23 per cent to use the grievance procedure, with only 13.7 per cent receiving that advice from line managers. A little over half of respondent found it easy or very easy to obtain advice, but carers, the disabled, ethnic minorities and those who felt that their problem represented a violation of their rights were less likely to have found it easy to get advice.
Eighty six per cent of workers with problems took action to try to resolve them – a finding which contradicts the common assumption that low-paid, non-unionised workers with problems at work simply leave or remain passive. Most attempted informal resolution within the workplace and very few used recourse to the law.
The most common form of action was to make an informal approach to a line manager or senior manager (69 and 43 per cent of the sample respectively). Only 12 per cent used the formal grievance procedure and a mere 2 per cent began Employment Tribunal application. Acting with external support was rare: 9 per cent of the sample went to a Citizens Advice Bureau, 6 per cent approached a trade union, and 8 per cent sought help from friends and family.
This result indicates that worker collectivism persists despite the emphasis on individualism at work through Human Resource Management and wider employment policies and ideology.
For most (79 per cent) of those who participated in informal collective action, this meant discussing what to do about the shared problem with co-workers. However, almost a fifth (19 per cent) went as a group to management, and a further 13 per cent arranged a ‘group meeting to discuss what we could do’. Attempts by workers to exercise collective power, for example by withholding their labour, were very rare.
Although only 6 per cent of respondents approached a union for help with their problem, when asked later in the questionnaire about their views on unions, 52 per cent believed that a union could have helped them resolve their problem and 40 per cent would join one as a result of their problem.
A key finding was that, despite attempts at workplace resolution, almost half (47 per cent) had no conclusion at all to these endeavours. Of the 38 per cent who had any result, only half were satisfied. Over the whole sample this meant that only 16 per cent of vulnerable workers with problems at work and 18.6 per cent of those who tried to take steps to resolve them had a satisfactory outcome.
Within the previous three years of employment to which the survey referred, 58 per cent of the sample reported problems in the current job and 42 per cent referred to problems in a previous job (16 per cent to problems in the most recent job and 26 per cent in a job previous to that). Thus, labour turnover was generally high. It is important to note, however, that the same proportions (86 per cent) of those who had quit their job and of those who were in the current one had taken action to resolve their problem. This shows that in general, workers do not leave a job with difficulties without first trying to resolve them. However, quit rates were 65 per cent higher for respondents who failed to achieve a satisfactory resolution to their problem than they were for respondents who had achieved a satisfactory outcome.
There was little relationship between the form of action taken and satisfactory resolution, although respondents who went to trade unions and Citizens’ Advice Bureaux were less likely to achieve satisfactory resolutions. This suggests that more severe problems, perceived to breach rights or require outside intervention, were even less likely to reach satisfactory settlement.
In workplaces with regular consultation and communication between employees and management, problems were more likely to be resolved, and to be resolved satisfactorily. However, respondents who worked in a workplace with a formal grievance procedure were not significantly more likely to get a conclusion or a satisfactory resolution than those who worked in a workplace without such a procedure, although they had a lower probability of quitting. While causality cannot be inferred from this, the result suggests that grievance procedures serve managers better than they serve workers in that workers remain in their jobs despite poor problem resolution.
1. Introduction
The issue of ‘vulnerable employment’ has gained prominence in government discourse in the wake of tragedies, such as the drowning of eighteen exploited Chinese migrant cockle-pickers in Morecambe Bay in February 2004 (Guardian
February 7 2004). It has become part of the public policy agenda since the ‘Warwick Agreement’ between trade unions and the Labour Party, which mentioned vulnerable employment as an area on which the government would take action and led to the 2006 parliamentary policy statement, ‘Success at Work: Protecting vulnerable workers, supporting good employers’ (DTI 2006). Tragedies like Morecambe Bay have led to an increasing awareness of the plight of migrant workers in particular areas of the economy. However, vulnerable employment is not confined to migrant workers (although they may be amongst the most vulnerable), but a pervasive feature of the modern British labour market. Neo-liberalism has dominated British policies since the 1980s, with financial performance, shareholder demands and private sector competition and values pervading every sector, including public service provision. The current New Labour government remains committed to maintaining a ‘flexible’ labour force, and although it has enacted new individual employment rights, many European employment Directives have been restrictively applied and the preference remains for voluntary employer codes of practice to statutory employment regulation (Smith and Morton 2001; 2006).
For these, the asymmetry of the capitalist employment relationship between employee and employer is mitigated only by statutory individual rights, without the benefit either of union support or a statutory enforcement body. Workers without employee status are further disadvantaged by not being covered by unfair dismissal laws. Hence, the focus of this study is on these non-unionised employees and workers - the majority of Britain’s labour force. UK union density, while appearing to stabilise in recent years, continues to decline: in 2006 28.4 per cent of employees were union members, down 0.6 percentage points from 2005. In the private sector, membership fell by the same amount to just 16.6 per cent (Grainger and Crowther 2007: 1). For the past decade, only a third of UK employees have been covered by collective agreements on pay, and in the private sector, which comprises 80 per cent of employment (Labour Market Trends 2006), only 19.6 per cent (Grainger and Crowther 2007: 37).
The government recently defined vulnerability as a function of the risk of adverse treatment and capacity to defend ones self against it. It maintains that a vulnerable worker is ‘someone working in an environment where the risk of being denied employment rights is high and who does not have the capacity or means to protect themselves from that abuse. Both factors need to be present. A worker may be susceptible to vulnerability, but that is only significant if an employer exploits that vulnerability’ (DTI 2006: 25). We argue that this is a narrow position and confines vulnerability to those already victims of abuse, rather than those exposed to unfair treatment because they are weak. Furthermore, it begs the question as to what predisposes to the risk of unfair treatment and low capacity to defend oneself. We argue that a more robust analytical approach is required to assess vulnerability. Basing this on the consideration of power relations in the workplace, lack of union representation is the first dimension of vulnerability. Second is lack of ‘skill’1 as a measure of weak labour market power associated with disposability.
1
Changes to the structure of the labour market over the last 25 years suggest that vulnerable employment is increasing, with an increase in both the number and proportion of low paid, replaceable, ‘lousy jobs’ (Goos and Manning 2007). At the same time, the scaling back of the welfare state since 1980 has increased the costs of job loss.
A proxy for weak bargaining power, both in terms of lack of collective representation and poor labour market strength, is low pay. Thus, a strong indication of vulnerability is absence of union membership combined with low pay. If this is defined as earning below median earnings, then, according to the Labour Force Survey, around 40 per cent of the British workforce could be defined as vulnerable. This is a higher percentage than the ‘one in five’ who are defined as vulnerable by the TUC, which uses a narrower low-pay definition, as those in the bottom third of the hourly income distribution (TUC 2006: 7). The lower paid (earning below the median), non-unionised worker is the basis of vulnerability in the Unrepresented Worker Survey (URWS) reported here.
The URWS gathered evidence on types of employment problems experienced by low paid, non-unionised workers, how they responded to them and the outcomes to attempted resolution. The Technical Appendix (A1 and A2) discusses how low pay was calculated, the definition of non-unionism and the concept of ‘problems’. Respondents had suffered from any of ten problems, including being paid unfairly, being threatened with dismissal, being bullied or subjected to undue stress or being asked to work in an unsafe environment. The overwhelming majority of the sample of 501 respondents (86 per cent) reported that they tried to do something to solve their main problem, but only 16 per cent reported a satisfactory outcome. These findings suggest to us that vulnerability is a pervasive feature of employment for lower paid, non-unionised workers, both in the types of problems and their poor rate of resolution.
While a face-to-face household survey would have been ideal, the method chosen within our budget constraints was a national telephone survey. Our sample was drawn from a regionally representative random sample of households. These were then screened by telephone to select a person who had been in employment in the previous three years, had experienced a problem at work, was low-paid (earning below the median) and was not a union member. The use of a fixed-line telephone survey may have introduced some sampling bias because not all households have telephones, and some households have signed up to the telephone preference service. Some of the most vulnerable workers, for example young and migrant workers in short-term accommodation, are likely to be omitted by a telephone survey. Of the 18,270 telephone contacts made, 52 per cent of households agreed to participate in the survey. However only 49 per cent of these contained workers and of these, 57 per cent of households were screened out because the respondent did not think the household contained a worker who matched the qualifying criteria for the survey (i.e. having had a problem at work, earned below median earnings and was not represented by a union).
The potential sample questioned at this stage was 1,971 workers. Forty nine per cent of these (966 workers) reported that they had experienced one of ten problems at work cited by the survey. While caution is needed in applying these figures to the population as a whole, they do suggest that problems at work are a relatively common experience, affecting some half of workers. Our finding is similar to that of a government commissioned survey, which found that 42 per cent of employees had experienced a problem in the previous five years
(Casebourne et al. 2006: 98). Once we excluded workers with workplace
One key challenge was the definition of a ‘problem at work’. A person’s perception of a problem depends on a subjective threshold of tolerance and expectations. Cognitive testing of the phrase ‘problem at work’ indicated that some people did not define serious workplace issues as ‘problems’ and only further probing revealed that these were indeed ‘problems’ in terms of the ten areas we considered relevant. This was because of low norms and expectations about workplace experience, and because some people were unwilling to admit to having a ‘problem’. Consequently, at the screening stage, respondents were asked about whether they had experienced a ‘difficulty, worry or concern’ at work and were then presented with a list of ten examples, which excluded trivial issues. Since we wished to glean information on experiences that caused worry, distress or a sense of unfairness, and were serious enough to warrant strategies to try to resolve them, the problem(s) could be a critical incident or a chronic situation. Respondents were first asked about all problems they had experienced in any job in the past three years, to give an indication of a broad spectrum of difficulties. To narrow the questionnaire, they were then asked to focus upon one job in which they had their main problems. These were then examined in greater detail. Finally, respondents were asked to select the main problem they considered for remedy, and whether they sought advice and took any action to solve it.
We investigated how well our sample corresponded to the labour force as a whole, as captured by the Labour Force Survey (LFS) at the time - 2004 (details Appendix A3). Chi squared tests2 were used to investigate whether there were any statistically significant differences between the characteristics of the Unrepresented Worker Survey (the URWS), the workforce as a whole and a sub-sample of the LFS who were not union members and earned less than median earnings (Table A3).
2
Briefly, women were over-represented in the URWS compared with their share of the workforce as a whole, but this was similar to their over-representation in the non-unionised, low-paid section of the labour force – a finding of little surprise in view of the gender wage-gap of 17.1 per cent between full-time men and women’s hourly earnings and the 38.4 per cent gap between part-time female and full-time male hourly earnings (EOC, 2006: 20). While young workers (under 24 years) had a higher presence in the low paid, non-unionised section of the LFS than in the workforce as a whole, this over-representation was not reflected in the URWS – possibly because of under-sampling. Ethnic minority workers were more likely to appear in the URWS compared to the workforce as a whole and all low paid unrepresented workers in the LFS. URWS respondents were also more likely to work in the private sector than the LFS in general, but had a similar representation to low-paid, non-unionised workers in the LFS. There were more retail, hotel and restaurants workers in the URWS than the LFS as a whole although not low-paid non-unionised workers in the LFS, and more health and social services workers than in both the LFS and the low-paid unorganised among them. Construction workers, however, were less likely in the URWS than in either the whole or the sub-sample of the LFS. Our respondents were also more likely to work in smaller workplaces (below 25 workers), and in unskilled and semi-skilled manual and personal services occupations, to have non-standard employment contracts and to have been in their job for six months or less.
These differences may arise for one of three reasons. First, some workers with a given characteristic are more likely to experience a problem. Second, as a result of sampling error in the URWS - for example younger workers may be harder to contact by fixed telephone line. Third, because reporting a problem depends on subjective definition of a ‘problem’ and readiness to talk about it, a process which depends on norms and expectations, which may vary systematically by workers’ job, workplace and demographic characteristics.
workers’ previous experience and attitudes towards unions influence the way they dealt with problems? Chapter Five looks at the outcomes of attempts to resolve problems: did workers achieve satisfactory resolutions or not and what is the relationship between voice, resolution and exit? Chapter Six concludes. The nature of the URWS sample and conceptual and methodological issues are detailed in the Appendix.
In addition to exploring the nature of problems, who experiences them, how they respond and their success in resolving them, three threads run through the paper. First is an interest in how former experience of unions, if any, affects workers’ response to their problems. Second, is an interest in whether the existence of institutional procedures for workplace dispute resolution and for management-worker consultation related to problems, how they were dealt with and degree of resolution. Third, is an interest in whether respondents felt that the problem that they experienced was a violation of their rights. Overall, 55 per cent of respondents felt that their rights had been breached in one or more of the problems that they had experienced, and 40 per cent of all problems were perceived as rights violations.
2. The nature of the problems
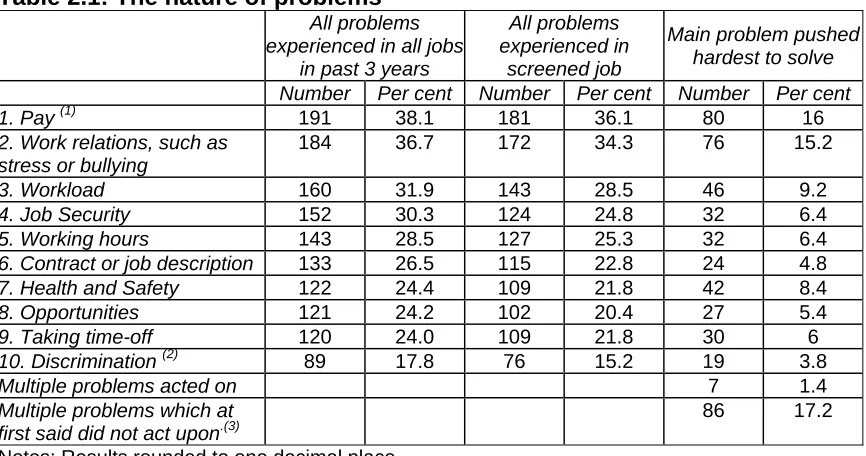
In this section, we set out in more detail the nature of the problems experienced by our respondents. One notable finding is that multiple problems are common. We then investigate the extent to which respondents felt that their main problem was a violation of their rights. Finally, we explore whether particular problems were more or less common for particular types of workers in particular types of work settings.
2.1 Analysis of all problems
Table 2.1: The nature of problems All problems experienced in all jobs
in past 3 years
All problems experienced in
screened job
Main problem pushed hardest to solve Number Per cent Number Per cent Number Per cent
1. Pay (1) 191 38.1 181 36.1 80 16
2. Work relations, such as stress or bullying
184 36.7 172 34.3 76 15.2
3. Workload 160 31.9 143 28.5 46 9.2
4. Job Security 152 30.3 124 24.8 32 6.4
5. Working hours 143 28.5 127 25.3 32 6.4
6. Contract or job description 133 26.5 115 22.8 24 4.8
7. Health and Safety 122 24.4 109 21.8 42 8.4
8. Opportunities 121 24.2 102 20.4 27 5.4
9. Taking time-off 120 24.0 109 21.8 30 6
10. Discrimination (2) 89 17.8 76 15.2 19 3.8
Multiple problems acted on 7 1.4
Multiple problems which at first said did not act upon.(3)
86 17.2
Notes: Results rounded to one decimal place.
(1)
Such as not being paid the correct amount, not being paid regularly, or not receiving pay for holidays or overtime etc
(2)
Towards yourself.
(3)
When asked about action, some people could not separate out their problems. These were called ‘multiple problems’. This group comprises the 86 people who at first said they did not try to do anything about their main problem, so were not asked about it and hence detail is lost. However, they were still asked if they took advice. After this, it transpired that 16 of these did in fact take action, reducing the ‘non-actors’ from 86 to 70 (14 per cent of the sample).
It then asked respondents to focus on one job (the screened job) and identify the problems in that one, as well as detail the key aspects of these. It finally asked about one problem (the main problem) which the worker ‘pushed hardest’ to resolve in terms of possible advice and action taken – bearing in mind that some might have decided no to do anything. Table 2.1 summarises responses to these questions about the nature of problems and demonstrates their frequency.
Overlapping problems
Over the three years of recall of different jobs, nobody in our sample experienced
only one problem. Table 2.2 illustrates overlaps. Generally, overlaps are fairly
evenly spread. Between a quarter and a third of any of the ten problem groups
also experienced each of the other of the ten problems. In many cases the
overlap is even greater, with around half of the sample experiencing problems in
workload and work relations (primarily stress and bullying, see Section 2.2); job
job security; health and safety and work relations; job opportunities and job
security; difficulty with taking time off, working hours and work relations; and
[image:17.612.94.580.186.460.2]discrimination and work relations (57 per cent overlap), job security and pay.
Table 2.2: Overlap of problems over 3 years, in rank order of problem occurrence
Job Security
Pay
Oppor-tunities
Discrimi-nation Time off
Working Hours
Work Load
Health &
Safety Contract
Work Relations
N= 191 71 46 44 51 71 62 49 57 58
Pay
Row (%) 100.0 37.2 24.1 23.0 26.7 37.2 32.5 25.7 29.8 30.4
N= 58 69 47 51 55 60 73 59 58 184
Stress
Row (%) 31.5 37.5 25.5 27.7 29.9 32.6 39.7 32.1 31.5 100.0
N= 62 49 52 31 54 67 160 48 54 73
Work
Load Row (%) 38.8 30.6 32.5 19.4 33.8 41.9 100.0 30.0 33.8 45.6
N= 71 152 58 47 45 59 49 50 50 69
Job security
Row (%) 46.7 100.0 38.2 30.9 29.6 38.8 32.2 32.9 32.9 45.4
N= 71 59 42 30 59 143 67 49 60 60
Working
hours Row (%) 49.7 41.3 29.4 21.0 41.3 100.0 46.9 34.3 42.0 42.0
N= 57 64 51 35 44 60 54 42 133 58
Contract
Row (%) 42.9 48.1 38.3 26.3 33.1 45.1 40.6 31.6 100.0 43.6
N= 49 50 38 27 37 49 48 122 42 59
Health &
Safety Row (%) 40.2 41.0 31.1 22.1 30.3 40.2 39.3 100.0 34.4 48.4
N= 46 58 121 32 35 42 52 38 51 47
Opportunities
Row (%) 38.0 47.9 100.0 26.4 28.9 34.7 43.0 31.4 42.1 38.8
N= 51 45 35 31 120 59 54 37 44 55
Time off
Row (%) 42.5 37.5 29.2 25.8 100.0 49.2 45.0 30.8 36.7 45.8
N= 44 47 32 89 31 30 31 27 35 51
Discrimi-nation Row (%) 49.4 52.8 36.0 100.0 34.8 33.7 34.8 30.3 39.3 57.3 Note: Numbers in bold are total in that problem area.
Focusing on the one screened job with the main problems, two fifths of the sample had one problem, a fifth had two problems and fewer still had three or four problems (Table 2.3). Only 4 per cent had more than six problems.
Table 2.3: Number of problems experienced in screened job Number of Problems in Screened Job
(Total (n)=501)
% of Sample with number of problems in screened job
[image:17.612.80.532.582.681.2]2.2 The nature of problems in the screened job
The URWS then went on to ask more about the nature of problems experienced in the respondent’s main job. The following section summarises these results.
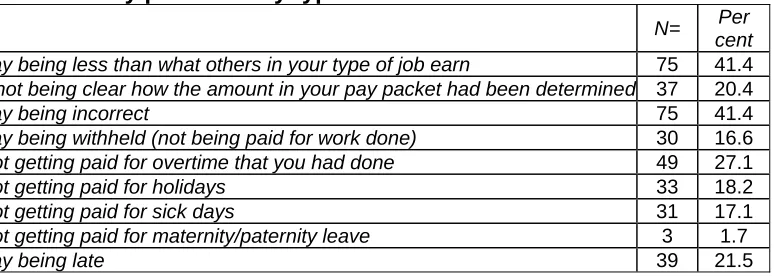
1. Problems with pay (36 per cent of sample).
[image:18.612.101.488.289.428.2]Two areas, ‘pay being less than others in your type of job’, and ‘pay being incorrect’, stand out as the major forms of pay problems among those with a pay problem (Table 2.4).
Table 2.4: Pay problems by types
Per cent N=
Pay being less than what others in your type of job earn 75 41.4 It not being clear how the amount in your pay packet had been determined 37 20.4
Pay being incorrect 75 41.4
Pay being withheld (not being paid for work done) 30 16.6 Not getting paid for overtime that you had done 49 27.1
Not getting paid for holidays 33 18.2
Not getting paid for sick days 31 17.1
Not getting paid for maternity/paternity leave 3 1.7
Pay being late 39 21.5
Not getting paid for overtime, pay being late and being unclear about how the pay
packet was determined were further important problems for 27, 21 and 20 per
cent of these workers, while not getting paid holidays or sick-pay affected a
further 18 and 17 per cent.
2. Problems with work relations (34 per cent of sample)
The largest category here was stress (70 per cent), followed by ‘management
taking advantage or bullying’ (55 per cent), with a substantial group (27 per cent)
Table 2.5: Work relations problems by types
N= Percent
Stress 121 70.3
Management taking advantage or bullying me 94 54.7
Bullying by other workers 47 27.3
Management attitude/lack of support (unprompted) 7 4.1 Workload pressure/unrealistic expectation (unprompted) 5 2.9 Attitudes and behaviour of other staff/colleagues (unprompted) 4 2.3
Other 5 2.9
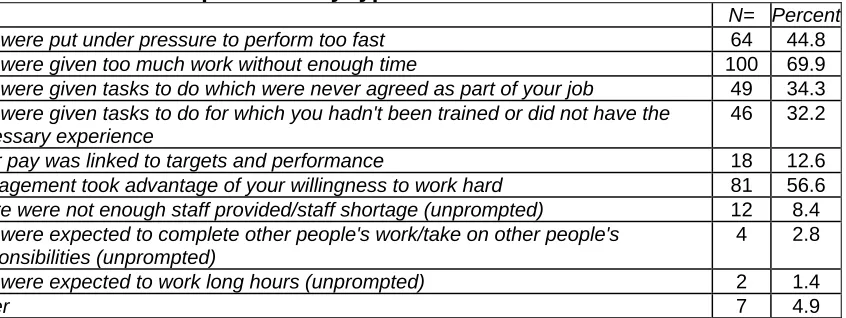
3. Problems with workload (29 per cent of sample)
The three largest types of workload problems were ‘too much work without
enough time (70 per cent), ‘management took advantage of willingness to work
hard’ (57 per cent) - which may be the same problem as that reported under
work-relations as ‘management taking advantage or bullying’ – and ‘put under
pressure to perform too fast’ (45 per cent) (Table 2.6).
Table 2.6: Workload problems by types
N= Percent You were put under pressure to perform too fast 64 44.8 You were given too much work without enough time 100 69.9 You were given tasks to do which were never agreed as part of your job 49 34.3 You were given tasks to do for which you hadn't been trained or did not have the
necessary experience
46 32.2
Your pay was linked to targets and performance 18 12.6 Management took advantage of your willingness to work hard 81 56.6 There were not enough staff provided/staff shortage (unprompted) 12 8.4 You were expected to complete other people's work/take on other people's
responsibilities (unprompted)
4 2.8
You were expected to work long hours (unprompted) 2 1.4
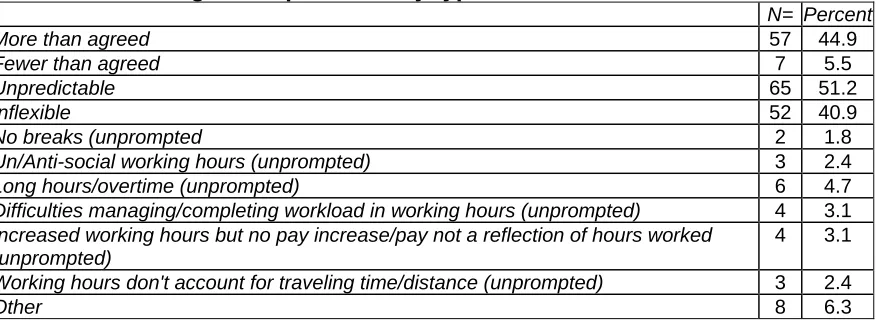
[image:19.612.106.529.374.533.2]4. Problems with Working Hours (25 per cent of the sample)
The most frequently cited working-hours problems were unpredictable hours,
working more hours than agreed and hours being inflexible, although there were
[image:20.612.94.532.196.357.2]a few examples of unprompted forms too (Table 2.7).
Table 2.7: Working hours problems by types
N= Percent
More than agreed 57 44.9
Fewer than agreed 7 5.5
Unpredictable 65 51.2
Inflexible 52 40.9
No breaks (unprompted 2 1.8
Un/Anti-social working hours (unprompted) 3 2.4
Long hours/overtime (unprompted) 6 4.7
Difficulties managing/completing workload in working hours (unprompted) 4 3.1 Increased working hours but no pay increase/pay not a reflection of hours worked
(unprompted)
4 3.1
Working hours don't account for traveling time/distance (unprompted) 3 2.4
Other 8 6.3
5. Job security problems (25 per cent of the sample)
It should be noted that this question was hardened following cognitive testing, to
reduce a general malaise about security, so as to focus on an identifiable period
of fear or worry about or in a job. For the majority of workers with an insecurity
problem (59 per cent), ‘a fear that you might lose your job (e.g. be made
redundant)’ dominated (Table 2.8).
Table 2.8: Job security problems by types
N= Percent A worry that you might lose your job (e.g. be made redundant) 73 58.9
Being threatened unfairly with dismissal 36 29.0
Actually being dismissed or sacked 19 15.3
Being forced to quit because of changes in your job description 16 12.9 Being forced to quit because of changes in your pay 9 7.3 Uncertainty or lack of working hours/issues with contract renewal/temporary or agency
staff 13 10.5
A second major problem, reported by almost a third within this problem area, was
worry about unfair dismissal (29 per cent), while 15 per cent were actually
unfairly dismissed.
6. Contract or job description problems (23 per cent of the sample)
There were four major areas of contract or job description problems (Table 2.9).
The most-cited was lack of formal or written contract (44 per cent) – a high
percentage, considering this is illegal after 2 months’ employment - but almost as
important was being asked to do tasks which were not specified in the contract or
job description (41 per cent) – a clear contribution to workplace conflict. Related
difficulties, experienced by over a third, were over pay or conditions being
different from those agreed in the contract and the associated problem of the job
description containing things which were not mentioned at the job interview.
Table 2.9: Contract/job description-related problems by types
N= Percent Not being given a formal contract or written job description 50 43.9
Not getting a contract renewed 13 11.4
Being asked to undertake tasks not specified in my contract or job description 47 41.2 Pay or conditions not matching what was agreed (including working hours) 39 34.2 Things being in my contract or job description that/was not told about at the interview 32 28.1 Changes have been made to job description/contract (unprompted) 7 6.1 Disagree/unhappy with terms in contract (unprompted) 5 4.4 Contract or job description not clear or specific enough (unprompted) 3 2.6
Other 3 2.6
Don't know 1 0.9
There thus seems a high degree of employer failure to provide a written
7. Problems with health and safety (22 per cent of the sample)
In the area of Health and Safety, strikingly high percentages of the respondents
cited all four forms of this problem (Table 2.10), around half agreeing that the
working environment was unsafe or dangerous, that there was inadequate health
and safety training, and that there was managerial negligence, and a further 42
[image:22.612.91.448.231.363.2]per cent saying they were asked to do unsafe or dangerous tasks.
Table 2.10: Health and safety problems by types
N= Percent
Managerial negligence 53 48.6
Being asked to do unsafe or dangerous jobs or tasks 46 42.2 The work environment in general was unsafe or dangerous 59 54.1 There was inadequate health and safety training 55 50.5 Poor/faulty/inadequate equipment provided (unprompted) 9 8.3 Poor/insufficient facilities (unprompted) 5 4.6 Working unsupervised/being left alone (unprompted) 2 1.8 Dealing with aggressive customers/don't feel safe (unprompted) 1 .9
Other 3 2.8
A further 8 percent added the unprompted problems of being provided with poor,
faulty or inadequate equipment. It is worth pointing out that, over three years,
over 40 per cent of those with health and safety problems also had problems with
pay, job security, working hours, and 48 per cent with work relations/stress.
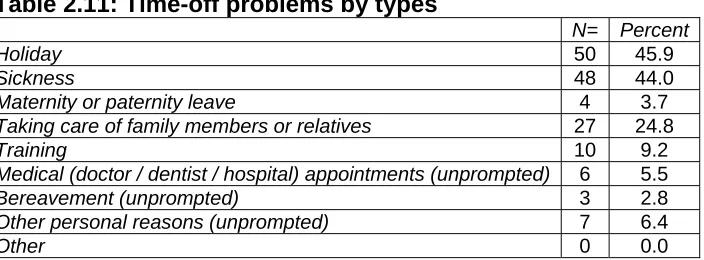
8. Problems with taking time off (22 per cent of the sample)
Table 2.11: Time-off problems by types
N= Percent
Holiday 50 45.9
Sickness 48 44.0
Maternity or paternity leave 4 3.7
Taking care of family members or relatives 27 24.8
Training 10 9.2
Medical (doctor / dentist / hospital) appointments (unprompted) 6 5.5
Bereavement (unprompted) 3 2.8
Other personal reasons (unprompted) 7 6.4
[image:22.612.93.445.513.643.2]Taking time off was as important to the respondents as health and safety, and
two issues dominated this area (Table 2.11): holidays (for 46 per cent) and
sickness (for 44 per cent). A further quarter also had problems taking time off for
family issues.
9. Problems with opportunities (20 per cent of the sample)
Opportunities problems, slightly less likely to be raised in the screened job than
when three years were considered, were still reported by a fifth of the sample.
This problem displayed the greatest concentration in one form: that of ‘limited
opportunities for job progression or promotion’, reported by 84 per cent of this
group (Table 2.12).
Table 2.12: Opportunities problems by types
N= Percent Limited opportunities for job progression or promotion 86 84.3 Limited opportunities for training to help me do the job better 54 52.9 Limited opportunities for training to help develop my career 63 61.8 Opportunity for progression/training only available to certain employees (unprompted) 5 4.9
Other 6 5.9
Almost two thirds also cited limited training opportunities to help develop a
career, and over half, problems with training opportunities to help do a better job.
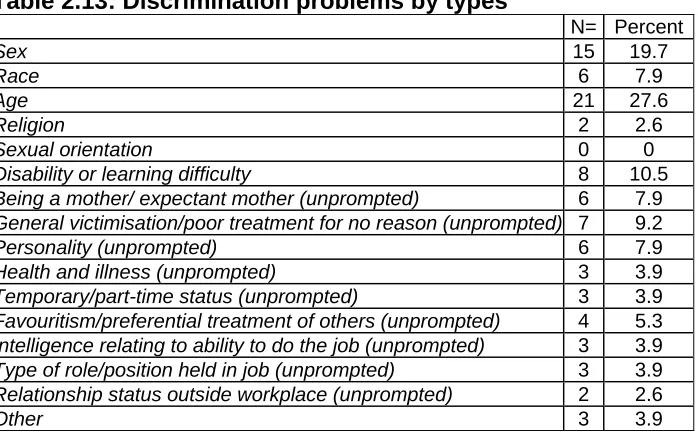
10. Problems with discrimination (15 per cent of the sample)
Two findings stand out in this problem area: one is its generally low reportage,
and second is the order of importance of types of discrimination, with age the
foremost (28 per cent), followed by sex discrimination (20 per cent), disability (11
per cent), race (8 per cent) and religious discrimination (3 per cent) (Table 2.13).
Thus, it seems that a perception of discrimination is low and may not be related
to its legal status – at the time of research, age discrimination was not unlawful,
although from October 2006 it was outlawed under the EU Framework Directive,
Table 2.13: Discrimination problems by types
N= Percent
Sex 15 19.7
Race 6 7.9
Age 21 27.6
Religion 2 2.6
Sexual orientation 0 0
Disability or learning difficulty 8 10.5 Being a mother/ expectant mother (unprompted) 6 7.9 General victimisation/poor treatment for no reason (unprompted) 7 9.2
Personality (unprompted) 6 7.9
Health and illness (unprompted) 3 3.9
Temporary/part-time status (unprompted) 3 3.9 Favouritism/preferential treatment of others (unprompted) 4 5.3 Intelligence relating to ability to do the job (unprompted) 3 3.9 Type of role/position held in job (unprompted) 3 3.9 Relationship status outside workplace (unprompted) 2 2.6
Other 3 3.9
Also striking is the large number of unprompted additions, some in relatively large
numbers. Thus, discrimination on grounds of being a mother, or being pregnant
(both illegal under sex discrimination law, although not reported as such in this
survey, indicating lack of knowledge of rights) is as high as race discrimination.
Other quite frequent forms of ‘discrimination’ are more correctly defined as
victimisation and include ‘general victimisations’ (9 per cent) and ‘personality’ (8
per cent).
The three most common specific problems as a percentage of all 501
respondents (each experienced by at least fifty respondents) were: stress (24 per
cent of all respondents), being given too much work without enough time (20 per
cent of respondents) and management taking advantage and bullying me (18.8
per cent of the sample). These details of problems indicate a working
environment for between two fifths and a quarter of vulnerable non-unionised
workers of work intensification and management bullying. Those suffering each
Pay related: being paid less than others doing the same type of job (14.7 per cent of all respondents) and being paid the incorrect amount (14.7 per cent of
respondents). Work-relations related: stress (24 per cent of respondents) and management taking advantage of, or bullying the respondent (18.8 per cent of
respondents). Workload related: being given too much work without enough time (20 per cent of respondents), management taking advantage of willingness
to work hard (16.2 per cent of respondents) and being put under pressure to
perform to fast (12.8 per cent of respondents). Working hours related: working unpredictable hours (13 per cent of respondents), working more hours than
agreed (11.4 per cent of respondents), or inflexible hours (10.4 per cent of
respondents).
Job security related: worry about losing their job, (that is, being made redundant) (14.6 per cent of respondents). Contract related: not being given a formal contract or job description (10 per cent of respondents). Health and Safety related: working in a generally unsafe or dangerous environment (11.8 per cent of respondents), inadequate health and safety training (11 per cent of
respondents) and managerial negligence (10.6 per cent of respondents).
Problems with taking time off: problems related to holiday entitlements (10 per cent of respondents). Opportunities related problems: limited opportunities for promotion or progression (17.2 per cent of respondents), limited opportunities for
training to help with career development (12.6 per cent of respondents) and
2.3 Infringement of rights
Of further interest in terms of perceptions of these problems is a sense of
injustice about them, an issue of relevance to ‘mobilisation theory’ (Kelly, 1998),
which we take up later in considering collective action as a route to their
resolution. Respondents were asked ‘Do you feel your problems were an
infringement of your rights?’ This question was deliberately framed to probe
beyond a sense or knowledge of legal rights alone, although responses will
include infringement of employment law. However, it touches on rights in terms of
fairness and legitimacy – a dimension of the Government’s employment policy,
as expressed in, for example, reference to ‘fair treatment of employees’ in its
White Paper ‘Fairness at Work’ (DTI, 1998: 1.9). In total, 278 people thought that
one or more of their problems were an infringement of their rights (55 per cent).
Forty per cent of all problems experienced by our respondents were viewed as
rights infringements.
Table 2.14 below shows those people who thought their problem an infringement
of their rights as a percentage of those who experienced that problem. This
shows that the highest percentages within each problem area who regarded that
problem as an infringement of their rights were among those who experienced
problems with pay, work relations, health and safety and discrimination. The
lowest were among those whose problems concerned job security and
Table 2.14: Percentage in each problem area who thought that this problem infringed their rights (screened job)
Problem Total in
problem area
Total who believe this problem infringement of
rights
Per cent of those with that problem who felt it was an
infringement of rights
Total problems 1257 507 40.3
Pay 181 85 47.0*
Work relations, such as stress or bullying
172 81 47.0*
Workload 143 55 38.5
Working hours 127 60 47.2
Job Security 124 40 32.3*
Contract or job description
114 50 44.0
Health and Safety 109 55 50.5**
Taking time-off 109 45 41.3
Opportunities 102 25 24.5***
Discrimination 76 41 54.0**
Notes: results rounded to one decimal place. * = statistically significant at the 10 per cent level ** = statistically significant at the 5 per cent level *** = statistically significant at the 1 per cent level
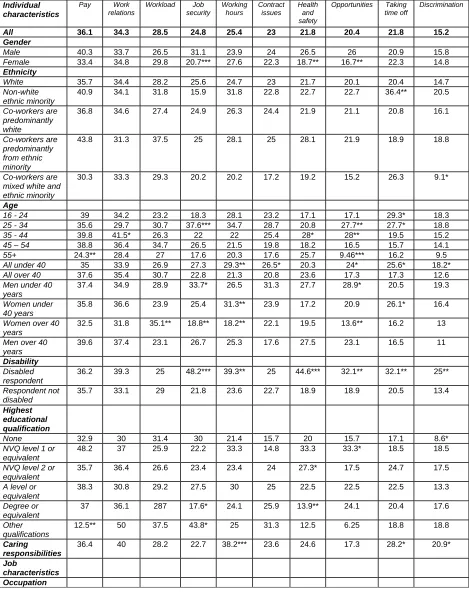
2.4 Are some problems more common for particular groups of workers?
Table 2.15: Incidence of all problems in one job by individual, job and workplace characteristics Individual characteristics Pay Work relations Workload Job security Working hours Contract issues Health and safety Opportunities Taking time off Discrimination
All 36.1 34.3 28.5 24.8 25.4 23 21.8 20.4 21.8 15.2
Gender
Male 40.3 33.7 26.5 31.1 23.9 24 26.5 26 20.9 15.8
Female 33.4 34.8 29.8 20.7*** 27.6 22.3 18.7** 16.7** 22.3 14.8
Ethnicity
White 35.7 34.4 28.2 25.6 24.7 23 21.7 20.1 20.4 14.7
Non-white ethnic minority
40.9 34.1 31.8 15.9 31.8 22.8 22.7 22.7 36.4** 20.5
Co-workers are predominantly white
36.8 34.6 27.4 24.9 26.3 24.4 21.9 21.1 20.8 16.1
Co-workers are predominantly from ethnic minority
43.8 31.3 37.5 25 28.1 25 28.1 21.9 18.9 18.8
Co-workers are mixed white and ethnic minority
30.3 33.3 29.3 20.2 20.2 17.2 19.2 15.2 26.3 9.1*
Age
16 - 24 39 34.2 23.2 18.3 28.1 23.2 17.1 17.1 29.3* 18.3
25 - 34 35.6 29.7 30.7 37.6*** 34.7 28.7 20.8 27.7** 27.7* 18.8
35 - 44 39.8 41.5* 26.3 22 22 25.4 28* 28** 19.5 15.2
45 – 54 38.8 36.4 34.7 26.5 21.5 19.8 18.2 16.5 15.7 14.1
55+ 24.3** 28.4 27 17.6 20.3 17.6 25.7 9.46*** 16.2 9.5
All under 40 35 33.9 26.9 27.3 29.3** 26.5* 20.3 24* 25.6* 18.2*
All over 40 37.6 35.4 30.7 22.8 21.3 20.8 23.6 17.3 17.3 12.6
Men under 40 years
37.4 34.9 28.9 33.7* 26.5 31.3 27.7 28.9* 20.5 19.3
Women under 40 years
35.8 36.6 23.9 25.4 31.3** 23.9 17.2 20.9 26.1* 16.4
Women over 40 years
32.5 31.8 35.1** 18.8** 18.2** 22.1 19.5 13.6** 16.2 13
Men over 40 years
39.6 37.4 23.1 26.7 25.3 17.6 27.5 23.1 16.5 11
Disability
Disabled respondent
36.2 39.3 25 48.2*** 39.3** 25 44.6*** 32.1** 32.1** 25**
Respondent not disabled
35.7 33.1 29 21.8 23.6 22.7 18.9 18.9 20.5 13.4
Highest educational qualification
None 32.9 30 31.4 30 21.4 15.7 20 15.7 17.1 8.6*
NVQ level 1 or equivalent
48.2 37 25.9 22.2 33.3 14.8 33.3 33.3* 18.5 18.5
NVQ level 2 or equivalent
35.7 36.4 26.6 23.4 23.4 24 27.3* 17.5 24.7 17.5
A level or equivalent
38.3 30.8 29.2 27.5 30 25 22.5 22.5 22.5 13.3
Degree or equivalent
37 36.1 287 17.6* 24.1 25.9 13.9** 24.1 20.4 17.6
Other qualifications
12.5** 50 37.5 43.8* 25 31.3 12.5 6.25 18.8 18.8
Caring responsibilities
36.4 40 28.2 22.7 38.2*** 23.6 24.6 17.3 28.2* 20.9*
Job
Individual characteristics Pay Work relations Workload Job security Working hours Contract issues Health and safety Opportunities Taking time off Discrimination Managerial and senior professional
45.5 45.6 36.4 30.3 30.3 27.3 27.3 21.2 27.3 9.1
Professional 55* 35 20 35 35 25 5* 20 20 25
Associate professional
30.8 41 43.6** 25.6 20.5 28.2 25.6 18 20.5 18
Administrative and clerical
25.3** 41.8 36.3* 23.1 13.2*** 23.1 17.6 23.4 22 17.6
Skilled manual 29.7 29.7 29.7 43.2*** 40.5** 21.6 29.7 29.7 18.9 8.1
All 36.1 34.3 28.5 24.8 25.4 23 21.8 20.4 21.8 15.2
Sales occupations
39.5 38.3 30.9 13.6** 25.9 24.7 21 12.4* 21 12.4
Personal and professional services occupations
34.4 25 23.4 18.8 34.4 25 12.5* 15.6 32.8 15.6
Semi-skilled manual occupations
29.7 23.4 17 27.7 23.4 14.9 31.9* 14.9 19.2 8.5
Unskilled 47.6* 31.7 18.3 26.8 24.4 20.7 26.8 24.4 17.1 20.8
Pay
Pay quartile 1 (lowest paid)
41.7* 36.5 22.6 31.3 32.2* 25.2 20.9 13.9** 23.5 17.4
Pay quartile 2 36 23.4*** 27 20.7 30.6 18.9 22.5 18.9 22.5 12.6
Pay quartile 3 29.9 40.2 32.5 24.8 24.8 25.6 22.2 26.5 22.2 17.1
Pay quartile 4 (highest paid)
33.3 40.2 31.6 24.8 16.2*** 21.4 23.1 24.8 17.1 13.7
Job tenure at time of problem
< 6 months 44.4*** 31.6 26.7 25.7 29.4 25.1 21.9 17.1 24.1 16
6 months – 1 year
31.5 35.2 20.4 16.7 24.1 16.7 18.5 24 33.3** 22.2
1 – 2 years 30.4 34.2 25.3 25.8 20.3 26.6 17.7 - 20.3 13.9
2 – 5 years 28* 42* 34 31 28 21 31** 29** 21 13
5 – 10 years 34.9 37.2 41.9** 16.3 21 14 18.6 7** 14 7
> 10 years 37.1 22.9 25.8 20 17.1 31.4 14.3 8.6* 8.6** 20
Gender and work
Man, colleagues mainly men
37.3 34.6 22.7 31.8** 31.8** 27.3 32.7*** 27.3** 22.7 11.8
Man, colleagues gender mixed
30.5 40.5* 27.5 19.1 20.6 21.4 22.1 14.5* 18.3 14.5
Woman, colleagues mainly women
36.5 32.7 34.6** 18.2** 27 22.6 17* 16.4 25.2 13.8
Woman, colleagues gender mixed
37.2 31.3 32.3 21.9 25 22.4 17.2* 18.9 22.5 16.2
All, mainly men 37.8 32.2 22.4* 33.6*** 28 25.9 29.4*** 28*** 23.8 15.4
All, mixed 33.9 36.3 26.9 21.1 21.6 21.6 18.7 17 17* 15.2
All, mainly women
36.5 33.7 34.8** 19.9* 26 22.1 18.2 17.1 24.9 14.9
Non-permanent employment contract
35.4 19.3** 17.5 21.1 24.6 21.1 10.5** 14 12.3* 22.8*
Part-time job 36.5 23.4*** 15*** 15.9*** 27.1 23.4 13.1** 8.4*** 24.3 13.1
Full-time job 35.4 37.5*** 32.3*** 27.4*** 24.5 14.3 24 24 20.9 15.8
Individual characteristics Pay Work relations Workload Job security Working hours Contract issues Health and safety Opportunities Taking time off Discrimination Industry
Manufacturing 28.6 34.3 27.1 25.7 27.1 14.3 28.6 25.8 22.9 10
Construction 31.3 37.5 12.5 62.5*** 31.3 21.4 68.6 37.5 25 25
Wholesale and retail
38.5 22*** 24.2 23.1 30.8 25 56.3 13.9** 27.5 12.1
Hotels and restaurants
38.2 32.4 29.4 35.3 29.4 23.1 19.8 17.7 20.6 11.8
Transport and communications
50 25 25 33.3 16.7 14.7 11.8 20.8 12.5 20.8
Financial intermediation
41.2 52.9 35.3 17.7 29.4 29.2 25 17.7 23.5 29.4
Other business services
40.9 40.9 27.3 29.6 27.3 23.5 11.8 25 18.2 25*
Public administration
31 37.9 37.9 24.1 13.8 22.7 20.5 41.4*** 6.9* 20.7
Education 41 41 30.8 20.5 15.4 24.1 20.7 25.6 18 7.7
Health and social work
28.9 45.8*** 37.4** 13.3*** 27.2 28.2 10.3 14.5 27.7 15.7
Other community services
41.9 29 22.6 29 25.8 24.1 27.7 16.1 29 16.1
Sector
Public sector 29.6 37.5 39.8*** 17.1* 12.5*** 23.9 15.9 25 10.2*** 15.9
Private sector 39.2* 29.9*** 25.2 79.2 29.9*** 23.1 23.7 19 25.2*** 15
Private company working in the public sector
35.4 46.2** 26.2 27.7 20 18.5 20 20 18.5 10.8
Voluntary sector 20.8 54.2** 37.5 30.3 20.8 33.3 20.8 25 25 29.2*
Workplace size
Fewer than 10 employees
45.9** 32.1 24.8 30.3 22.9 23.9 19.3 12.8** 25.7 13.8
10 - 24 39 30.5 24.2 23.2 31.6 16.8* 19 19 21.1 13.7
25 – employees 49 employees
33.3 41.7 26.4 22.2 20.8 23.5 29.2 26.4 20.8 20.8*
50 – 249 employees
28.6** 36.1 33.8 20.3 27.8 23.3 21.8 21.8 15.8 11.3
250 - 499 employees
36 28 28 32 28 24 20 28 40** 12
500+ employees
35.3 35.3 35.3 29.4 26.5 35.3* 26.5 32.4* 20.6 20.6
Union Experience
Union member 43.7 50* 43.8* 34.4 34.4 43.8*** 25 31.3 15.6 34.4***
Former union members
27.9*** 37.8 25.6 25 20.3 20.4 24.4 17.4 20.4 13.6
Never union member
40.4*** 30.8 28.4 23.3 27.1 22.3 19.9 20.9 23.6 13.7
All 36.1 34.3 28.5 24.8 25.4 23 21.8 20.4 21.8 15.2
* statistically significant at the 10% level or better ** statistically significant at the 5% level or better
1. Problems with pay
Groups of workers more likely to experience pay problems were those working in micro-workplaces (fewer than 10 workers), professional occupations, unskilled occupations, the lowest earning quartile of our sample and those who had been in their job for less than six months when they experienced a problem. Those in medium sized workplaces (50-249 workers), administrative and clerical occupations, those over 55 years old and those with ‘other’ qualifications were less likely to experience pay problems. Former union members were less likely to have experienced pay problems, while those who had never been union members were more likely to have experienced them.
2. Problems with work relations
Workers more likely to experience problems with work relations included those who had been in the job between two and five years when they experienced the problem, men who worked in jobs which were done by both men and women, those in the health and social work sector, those working for private companies that operated in the public sector and workers in the voluntary sector. Work relations problems were less likely for those in the second pay quartile, workers with non-permanent contracts, part-time workers, workers in the wholesale and retail industry and private sector workers. Union members were more likely to have experienced a work relations problem.
3. Problems with workload
4. Problems with job security
Job security problems were more likely to be experienced by disabled workers, those with ‘other’ qualifications, skilled manual workers, those doing work which was exclusively or predominantly done by men, men aged under 40, disabled workers, full-time workers and those in the construction industry. Workers less likely to experience problems related to job security included women, particularly women aged 40 or over, those doing jobs predominantly done by women, those educated to degree level, those in sales occupations, part-time workers, those in the health and social work sector and the public sector.
5. Problems with working hours
Problems with working hours were more likely for workers with a disability, skilled manual workers, the lowest paid quartile of the survey, men doing work that was undertaken predominantly by men, those with caring responsibilities and workers in the private sector. Workers less likely to experience these problems included those aged 40 and over, especially women aged over 40, administrative and clerical occupations, the highest paid quartile of the survey and those in the public sector.
6. Contract issues
Contract issues were more likely to be a problem for those aged 40 and under and among union members.
7. Problems with health and safety
8. Problems with opportunities
Workers more likely to experience problems with opportunities included those with a disability, workers in large workplaces (over 500 workers), those educated to NVQ level one or equivalent, those with two to five years in their job, men doing work predominantly done by men and those working in public administration. Problems with opportunities were less likely for women, especially women aged 40 and over, workers in sales occupations, the lowest paid quartile of the survey, those with five or more years in their job, men in gender mixed work, part-time workers, those in the retail and wholesale industry and workers in small workplaces that employ fewer than ten people.
9. Problems with taking time off
Workers more likely to experience problems taking time off included workers with a disability, ethnic minority respondents, those with caring responsibilities, women under 40 and all workers below 35 years old, workers who had been in their job for between 6 months and one year and private sector employees. This sort of problem was less likely for those who had been in their job for ten years or more, non-permanent employees, public sector workers and those employed in public administration and those aged 40 and over.
10. Problems with discrimination
2.5 Institutional context
[image:34.612.89.510.301.470.2]The final question addressed by this section of the report is whether the way in which the workplace is managed is associated with workers’ chances of experiencing different type of problems. Specifically, does working in a workplace with a formal grievance or disciplinary procedure or with mechanisms for consulting with employees on a regular basis significantly alter the chances of employees experiencing different types of problems compared to employees who work in workplaces without these practices? (Tables 2.16 and 2.17).
Table 2.16: Comparison of percentage of respondents with each problem in workplaces with and without grievance/disciplinary procedures
Workplace has
Grievance/Disciplinary procedure
Workplace has No Grievance/Disciplinary
procedure
Pay related problem 30.7 44.6***
Job security problem 19.4 33.3***
Opportunities problem 20.7 19.6
Discrimination problem 13.6 17.9
Problem with taking time off 19.1 26.8
Problem with working hours 23.6 28.6
Workload problems 30.4 25.6
Health and safety problem 21.7 22.6
Contract/ job description problem
23.6 22
Work relations problem 36.6 30.4
* statistically significant at the 10% level or better ** statistically significant at the 5% level or better *** statistically significant at the 1% level or better Results rounded to one decimal place
By contrast, just 62 per cent of our sample reported that their workplace had such a procedure. Information here was dependent on worker respondents’ knowledge or understanding of the existence of such procedures and/or mechanisms3. Although only 4.8 per cent of respondents said they did not know whether there were any set rules for how problems between employer and staff should be dealt with, it could be that those who said there were none were unaware of them because they were not publicised, and existed purely for legal compliance reasons. There are thus limitations to the reliability of our information on such procedures.
Nevertheless, our results do suggest that a significant proportion of vulnerable workers do not have access to grievance procedures, either because they do not exist at their workplace, or because their employer does not provide adequate information. Interestingly, respondents were less likely to experience problems with pay and job security if they reported working in a workplace that had a grievance or disciplinary procedure.
Sixty per cent of our sample reported working in a workplace where employees met regularly with management to discuss workplace issues. Again, it appears that most workers knew whether or not such procedures existed, since only 3.2 per cent did not know if there were regular meetings between staff or their representative to discuss workplace issues. Again, those who said there were none may have said so because nobody had brought this to their attention. It is difficult to gauge how well this figure corresponds with the Workplace
3
Employment Relations Survey, because the questions are not directly comparable4.
Table 2.17: Comparison of percentage of respondents with each problem in workplaces with and without information and consultation procedures
Regular meetings to discuss workplace issues
No regular meetings to discuss workplace issues
Pay related problem 32.8 42.5**
Job security problem 20.7 31.2***
Opportunities problem 19.4 23.1
Discrimination problem 11.4 19.4**
Problem with taking time off 17.7 27.4**
Problem with working hours 20.1 35***
Workload problems 27.4 31.2
Health and safety problem 19.4 26.9
Contract/ job description problem
20.7 26.9
Work relations problem 33.1 37.6
* statistically significant at the 10% level or better ** statistically significant at the 5% level or better *** statistically significant at the 1% level or better Results rounded to one decimal place
Workers were less likely to report problems with pay, job security, discrimination, taking time off or working hours if they reported regular meetings with management at their workplace.
4
2.6 Identifying a main problem ‘pushed hardest’.
Commentary so far has addressed several problems, first over three years, then in one screened job. Subsequent analysis focuses on what people did about a
main problem they ‘pushed hardest’ to try to solve. It is worth noting, at this point, that while most pushed hardest on the problems most frequently reported, there were exceptions. Thus, the three most frequently reported problems – on pay, work relations and workload were also those selected as the main ones ‘pushed hardest’ (Table 2.1). However, Health and Safety, the seventh most frequent as one of several, came fourth in terms of a ‘main problem’. This suggests that where it arises as a problem, it might lead to stronger attempts at resolution. In fact, as analysis of actions shows, this is not the case, which suggests Health and Safety is regarded as a key problem, but ‘pushing it hardest’ as a psychological priority is not the same as action. ‘Taking time off’ also rose in frequency as a main problem compared to its general frequency.
Summary and conclusions
Different patterns of greater vulnerability to experience these ten problems show some variation by workplace, industry and worker characteristics. For example, unskilled workers, the lowest paid and those with only a few months service are the most likely to have pay problems. Workers with disabilities are more likely to suffer six of the ten problems. Work relations problems, such as stress and bullying, are more likely for those with two to five years’ service, in health and social work, companies contracted to the public sector and in mixed-sex workplaces. Older women working in mainly female environments, workers in clerical and administrative jobs and (again) in health, social work and the wider public sector, are most vulnerable to workload problems. Insecurity and working-hours problems are especially likely for workers with disabilities, skilled manual full-time workers, those in the construction industry and workers who work in mainly male workplaces. Health and safety problems are also more likely to be experienced in male working environments and among the semi-skilled. Problems with taking time off are, not surprisingly, more likely among those with caring responsibilities, younger women as well as among ethnic minority and disabled workers, those with short tenure and private sector employees in general. Discrimination problems (the most frequent expression of which being age and sex, along with general victimisation) was more likely for those with disabilities, caring responsibilities and non-permanent employees.
3. What do unrepresented workers do about problems at work?
What do vulnerable workers do when they experience a problem at work? The industrial relations literature has typically conceptualized workers’ choices in terms of ‘exit’, ‘voice’ or ‘loyalty’ (Hirschman 1970; Freeman and Medoff 1984). The aim of this chapter is to take a more nuanced look at the way in which workers who lack a formal collective voice at work respond to problems. Do they simply ‘suffer in silence’ (Boroff and Lewin 1997: 60), do they seek to do something about their problems, or do they leave? Overall, 86 per cent of our respondents tried to do something about their problems (exercised informal or individual voice), but a large number of them also left the job in which they experienced the problems – 42 per cent of respondents were no longer in the same job.
3.1 Seeking advice
Who Took Advice?
Sixty one per cent of our sample sought advice about the problem that they pushed hardest to do something about. A series of regression analyses were used to investigate whether there was any relationship between types of problems, personal, job and workplace characteristics5 and a propensity to seek advice.
Looking first at the relationship between problems and seeking advice, respondents who had pushed hardest to solve multiple questions were the omitted reference category for regression analysis. Compared to this group, respondents whose main problem related to pay, opportunities, discrimination, workload, health and safety, contract issues and work relations were more likely to seek advice, while those whose problems concerned job security, taking time off or working hours were no more or less likely to seek advice.
In simple models, without further controls, the lowest paid, semi-skilled and unskilled manual occupations, part-time workers and those in small workplaces were less likely to seek advice. However, once controls were added, these results were no longer statistically significant. In the models with controls, women and disabled workers were more likely to seek advice. Those who perceived their rights to have been violated were also significantly more likely to have sought advice. Union experience had no influence on propensity to seek advice.
From whom did they take advice?
From whom did respondents seek advice? Table 3.1 summarises the main
sources of advice and which source of advice respondents thought to be the most influential.
18Table 3.1: Sources of advice, percentage of sample
Source of advice Most influential advice
34.3 11.7 Senior manager
5
Friends and colleagues at work 33.0 19.5
Line manager 31.0 10.2
Family or friends outside of work 22.2 16.4
Citizens Advice Bureau 12.8 4.7
Trade union 5.2 3.1
Others in a similar situation 4.6 -
Personnel/ HR department 3.9 -
Professional body 2.9 -
ACAS 2.9 5.5
Base observations 306 128
[image:41.612.85.529.71.195.2]Note – column totals do not sum to 100 per cent because respondents could select multiple sources of advice and the table does not include sources of advice which less than two per cent of respondents used/ found influential.
Table 3.1 shows that senior managers were the most common source of advice, closely followed by friends and colleagues at work and their line managers. Interestingly, however, advice provided by friends and colleagues at work, rather than by managers, was considered the most influential by our respondents. Overall, about one in five of those who sought advice (i.e. 12 per cent of all vulnerable workers with problems) went to an independent, external source of advice, such as a trade union, ACAS, a Citizens Advice Bureau (CAB), solicitor or Law Centre, professional body, but the single most important external recourse was the CAB (12.8 per cent of those who sought advice went to a CAB, and 4.7 per cent rated this as the most influential advice they received).
Ease of obtaining advice