Data quality problems in discrete event simulation of
manufacturing operations
BOKRANTZ, Jon, SKOOGH, Anders, LA¨MKULL, Dan, HANNA, Atieh and PERERA, Terrence
Available from Sheffield Hallam University Research Archive (SHURA) at:
http://shura.shu.ac.uk/17549/
This document is the author deposited version. You are advised to consult the publisher's version if you wish to cite from it.
Published version
BOKRANTZ, Jon, SKOOGH, Anders, LA¨MKULL, Dan, HANNA, Atieh and PERERA, Terrence (2018). Data quality problems in discrete event simulation of manufacturing operations. Simulation: Transactions of the Society for Modeling and Simulation International 1–17, 94 (11), 1009-1025.
Copyright and re-use policy
See http://shura.shu.ac.uk/information.html
Article type: Original research
Corresponding Author: Jon Bokrantz
Postal address: Department of Industrial and Materials Science, Chalmers University of Technology, 412 96 Gothenburg, Sweden
Email and Phone: [email protected], +46 (0)31 – 772 36 14
Received: March 24, 2017. Revised: June 30, 2017. Accepted: October 19, 2017.
Data Quality Problems in Discrete Event
Simulation of Manufacturing Operations
Jon Bokrantz
1, Anders Skoogh
1, Dan Lämkull
2, Hanna Atieh
3,
Terrence Perera
41
Chalmers University of Technology, Gothenburg, Sweden 2
Volvo Car Group, Torslanda, Sweden 3
Volvo Group Trucks Operations, Gothenburg, Sweden 4
Sheffield Hallam University, Sheffield, UK
Abstract
Keywords
Discrete event simulation; data quality; data collection; input data management; manufacturing; maintenance
1. Introduction
Today’s business environment within the automotive industry is extremely competitive. In order to gain a competitive advantage, automotive companies must meet high and rapidly changing customer demands, which requires fast development of flexible, high performance, and cost-effective production systems. This in turn, creates a strong need for short lead times in product realization projects and continuous improvements of production efficiency. To meet these challenges, automotive companies utilize various virtual tools and methods for product and production development, for example Discrete Event Simulation (DES) 1.
data collection methodologies, is that they stem from a project-based approach to simulation. Standalone simulation projects are often run over the course of several months 3, in which lengthy data collection phases are often acceptable. However, there has been a major shift in the application of DES in manufacturing during the past decade from production system design to daily operations. Today, common application areas are operations and maintenance planning and scheduling, and real-time control is expected to be the next leading area 2.
Using DES as a daily manufacturing engineering tool on a close to real-time basis completely changes the demands on data collection. Ideally, high quality production data should be available and ready to use in simulation at any given time. This is impossible to achieve by purely relying on project-based data collection methodologies. To meet these new demands, research has focused on areas such as automation of input data management 12, 13 and interoperability between data sources and simulation models, e.g., Core Manufacturing Simulation Data (CMSD) 14, 15. In fact, the four possible ways of processing and storing data to be used in simulation are thoroughly explained by Robertson and Perera 7, and Skoogh et al. 16 observed an increase in the number of industrial examples of automated input data management during the past decade. For an overview of input data management research, see the review in Barlas and Heavey 17.
collected data are already of high quality. Input data management to DES is a multi-faceted problem that also includes a number of inherent issues in the data collection process. Numerous authors have mentioned such issues and highlighted problems along several simulation data quality dimensions, e.g., accuracy, timeliness, and reputation 16, 18
, and some studies have described problems along these dimensions such as missing data, limited access to data sources, and low quality of collected data 19. However, there is still a lack of empirical studies describing such simulation data quality problems from a practitioners’ perspective. Although it has been acknowledged that research on data quality in simulation relates to the broader context of data quality in information systems 20
, studies within the domain-specific simulation realm usually fail to describe the connection between simulation data quality problems and an organization’s overall process for generating, storing, and using data. There is an extensive body of literature on data quality in information systems that has received little attention in simulation publications, e.g., 21-23. Similarly, several publications have focused on improving the quality of maintenance data, e.g., 24, 25, which is not only a fundamental input to manufacturing simulation when modelling variation in machine breakdowns, but a necessity for using DES in maintenance scheduling 2.
quality problems from a practitioners’ perspective, the organizations’ overall process for generating, storing, and using data, and relationships between this overall process and simulation data quality problems. This is achieved through a multiple-case study within the automotive industry. From the empirical and theoretical knowledge gained throughout the study, this paper also contributes with a set of practical guidelines that can support manufacturing companies in improving data quality in DES.
2. Previous literature on data quality
Important factors for improving simulation data quality are presented in this section, with a particular focus on theory covering simulation data validation, data quality dimensions, and roles, responsibilities, and relationships within an organization’s process for generating, storing and using data.
2.1 Data quality dimensions
A key factor in any simulation application is working in an organized manner. However, even the most well performed simulation studies can be rejected if one fails to achieve acceptability of the results. To improve acceptability, Balci 26 suggests striving for high credibility of the simulation results by relying on a hierarchy of credibility assessment stages. Within these stages, data validation is included. Sargent 27 defines simulation data validity as “ensuring that the data necessary for model building, model evaluation and testing, and conducting the model experiments to solve the problem, are adequate and correct”. Therefore, any validation activity requires a structured methodology 18
practical approach is face validation through collaboration with process experts 11. Validation and verification of input data can also be partly automated 9, e.g., by using the Generic Data Management (GDM)-Tool 12. However, Sargent 27 argues that unfortunately, there is not much that can be done to determine whether data are correct. Nonetheless, Balci et al. 18 suggest that in order to achieve credibility of data, it is critical to assess 11 data quality dimensions: Accessibility, Accuracy, Clarity, Completeness, Consistency, Currency, Precision, Relevance, Resolution, Reputation, and Traceability. These dimensions can be seen as guiding criteria to achieve high quality simulation data, and in this study we adhere to the definitions of these 11 dimensions provided in Balci et al. 18.
completely or mostly unfit for use 33, or a situation in which the content or medium of information does not meet the requirements of its producers, consumers, or users 30. In this study, we relax this definition and define simulation data quality problems as difficulties along data quality dimensions that aggravate the input data management procedure.
2.2 Relativity of data quality
The data quality area has recognized a particularly challenging aspect of data quality: relativity - what can be considered good data for one user might not be sufficient for another. Several related perspectives on this relativity are available. For example, data quality cannot be assessed independently of the users 29 because users evaluate data quality in relation to their specific tasks 33. Further, the same data could be needed at any time for multiple tasks with different and ever-changing quality requirements, which makes achieving high quality data like tracking an ever-moving target. Therefore, solving data quality problems requires continuous consideration of the entire range of concerns present among all users, and achieving high quality data goes beyond good data requirement specifications. Instead, there is a need for flexible data collection systems with data that can be easily aggregated and manipulated for a wide variety of users 33.
activities and therefore proposes a generic framework that describes the appropriate data structure. Similarly, in the case of long-life cycle simulation models, data integrity needs to be checked continuously 6, and if regular updates of data are needed, a suitable process should be in place or prepared 28.
2.2 Roles, responsibilities, and relationships in data production
processes
Knowledge and experience are essential in simulation and every simulation project team should include designated roles and responsibilities in order to avoid project failure, e.g., leadership, client, modelling, system experts, data providers etc. 3, 26. But in contrast to literature regarding simulation projects, most of the articles proposing data collection methodologies do not deliberately explain specific roles or responsibilities, e.g., 9, 11.
systems that meet the requirements of the consumers, then leave the responsibility of data quality to the consumers. Consumers on the other hand have felt responsible for data quality in systems they did not understand, or which were difficult to correct appropriately. In fact, all three roles are mutually dependent on each other. For example, data quality is dependent on the design of the data production process, but the designers do not control the actual use of the data. Because data quality is a function of its use, improving data quality also implies improving how it is used 37.
However, establishing these three roles and responsibilities is insufficient. There must also be properly functioning relationships among them, a topic studied by Lee and Strong 36
knowing-why is closely associated with data relevance, i.e., only they know whether the data are relevant. Interestingly, data custodians’ knowing-why is not highly associated with producing high quality data. Lee and Strong 36 thus conclude that the key role is held by the data producers, because they can serve as intermediaries between custodians and consumers. Therefore, the importance of knowing-why in data producers should be recognized and exploited in organizations.
2.3 Difference between simulation data collection and data
production processes
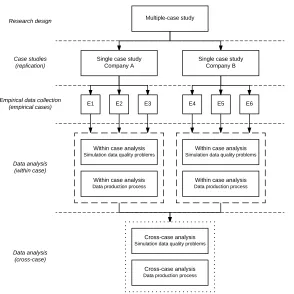
3. Methodology
Figure 1: Illustration of empirical research design.
3.1 Empirical data collection
case under investigation (e.g., involved persons 3, 26, data requirements 11, lead time of input data management 8, and clients’ perspectives on simulation credibility 18). The interviews with maintenance and automation engineers and information system managers included questions about e.g., formal roles and responsibilities for data quality 36, work procedures for collecting and implementing data requirements 37, and data validation 27. The templates were used consistently with all simulation analysts (E1-E6), but included minor alterations for subsequent interviews so as to align with the specific context of each empirical case. Direct observations primarily consisted of walkthroughs with the simulation analysts, which focused on describing both general input data management procedures as well as input data procedures used during the specific empirical case under investigation. Whenever possible, these observations were supported with plant visits where the simulation analyst further elaborated on the specific empirical case in situ. Collection of data from archival records included production data from monitoring systems used during the empirical cases as well as formal data production guideline documents used within the organizations (e.g., cycle-time definitions and data validation procedures).
data production process at the site. One limitation in this case is the lack of interviews with information system managers (i.e., Information Technology (IT) department), and this might have contributed to a limited understanding of the roles and responsibilities of data custodians. The following three empirical cases were investigated:
E1Determine the standalone throughput of a specific production line by verifying its
availability.
E2 Evaluate the performance of a new laser station by estimating technical
availability of all components that affect throughput.
E3 Determine the buffer size between the new laser station and the subsequent arc
weld station to ensure sufficient throughput.
In company B, the three empirical cases were geographically dispersed. First, an interview was conducted on site 1 with an R&D engineer working as a global simulation analyst (E4). Thereafter, interviews were conducted on site 2 with a simulation analyst and an automation engineer responsible for the production monitoring system (E5). Finally, interviews were conducted on site 3 with a simulation analyst, an automation engineering responsible for installation and validation of the production monitoring system, and an information system manager globally responsible for the production monitoring system used within company B (E6). The following three empirical cases were investigated:
E4 Evaluate different production strategies, e.g., buffers, personnel, and bottlenecks
E5 Quantify waiting times and experiment with alternative distribution logics in the
paint distribution system.
E6 Identify waiting times, bottlenecks and capacity losses, and experiment with new
logics for prioritization in a flow of material handling pallets.
3.2 Data analysis and presentation of findings
The three sources of empirical data were triangulated by developing converging lines of enquiry 38, which allows for stronger confirmation of constructs and hypotheses 39. Within-case analyses were conducted first to provide separate descriptions of the six cases 39. An analytical strategy of relying on theoretical propositions was adopted, which is a way of letting available theory guide the analysis and focus on the most significant parts of the study 38. First, theory on data quality dimensions (section 2.1) was used to code the empirical data on data quality problems in simulation. Second, theory on roles, responsibilities, and relationships (section 2.2) guided the analysis of data production processes. The empirical data were analyzed using analysis software Nvivo11, which enables a chain of evidence to be maintained by linking all empirical data to the theoretical propositions that served as the basis for the aim and design of the study 38.
This analytical strategy allowed for a consistent presentation of within-case data. For the descriptions of simulation data quality problems (section 4.1), Balci et al.’s 18
eleven simulation data quality dimensions were merged with Wang’s 22
proposed in Balci et al. 18 since they have been acknowledged and disseminated within the simulation domain (see original reference for definitions). This also supports the intent of developing guidelines and tools for improving data quality in DES in practice as fast as possible. The merging with Wang’s 22 four categories were chosen to support alignment in quality dimensions between the two research domains (DES and information systems).
In line with the interpretation of a data quality problem adopted in this study (see section 2.1), the empirical data on simulation data quality problems in each case study are presented within its corresponding data quality dimension. Note that a limitation of this research is that interdependencies between the eleven data quality dimensions, such as trade-offs or goal conflicts 30, are not explicitly studied. For the description of data production processes (section 4.2), the empirical data for each case study are presented in relation to the roles, responsibilities, and relationships proposed in theory (section 2.2). To facilitate a focus on the most significant aspects of the study, we concentrated on presenting 10 key characteristics of these processes 38.
gained throughout the study, a set of practical guidelines are presented that can support manufacturing companies in improving data quality in DES.
3.3 Generalizability of case study results
A misleading misconception is that one cannot generalize the findings from single case studies 40, and a common argument is that multiple-case studies yield more generalizable findings 38. However, any form of case study (single or multiple) supports scientific development via generalization by acting as supplement or alternatives to other methods. The collective use of methods for both breadth and depth are necessary for sound scientific development in any field 40. Therefore, case studies are necessary for specific research tasks where the problem is one of depth, such as using DES as a daily engineering tool in a practical real-world manufacturing context. Instead of relying on the number of cases, the decisive factor for generalizability is strategic selection of cases 40. Based on four criteria, this study identified and selected six cases that allowed for the current knowledge on data quality in DES to be extended from a practical real-world perspective, which is a prerequisite for developing practical solutions for solving data quality problems.
4. Results
differences are presented in this section. The presentation follows the analytical strategy explained in section 3.2.
4.1 Simulation data quality problems
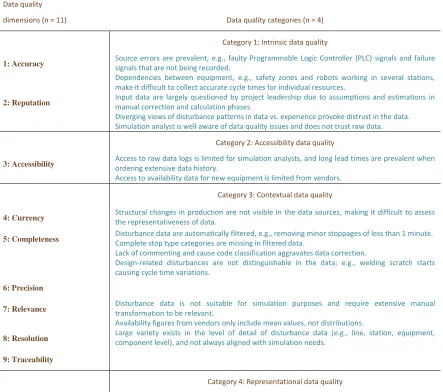
[image:20.612.87.530.315.707.2]Simulation data quality problems in regard to E1, E2, and E3 (company A) are presented in table 1.
Table 1. Data quality problems in E1, E2, E3:
Data quality
dimensions (n = 11) Data quality categories (n = 4)
Category 1: Intrinsic data quality
1: Accuracy Source errors are prevalent, e.g., faulty Programmable Logic Controller (PLC) signals and failure signals that are not being recorded. Dependencies between equipment, e.g., safety zones and robots working in several stations, make it difficult to collect accurate cycle times for individual resources.
2: Reputation Input data are largely questioned by project leadership due to assumptions and estimations in manual correction and calculation phases.
Diverging views of disturbance patterns in data vs. experience provoke distrust in the data. Simulation analyst is well aware of data quality issues and does not trust raw data.
Category 2: Accessibility data quality
3: Accessibility Access to raw data logs is limited for simulation analysts, and long lead times are prevalent when ordering extensive data history.
Access to availability data for new equipment is limited from vendors.
Category 3: Contextual data quality
4: Currency Structural changes in production are not visible in the data sources, making it difficult to assess the representativeness of data.
5: Completeness Disturbance data are automatically filtered, e.g., removing minor stoppages of less than 1 minute. Complete stop type categories are missing in filtered data. Lack of commenting and cause code classification aggravates data correction.
Design-related disturbances are not distinguishable in the data; e.g., welding scratch starts causing cycle time variations.
6: Precision
7: Relevance Disturbance data is not suitable for simulation purposes and require extensive manual transformation to be relevant. Availability figures from vendors only include mean values, not distributions.
8: Resolution Large variety exists in the level of detail of disturbance data (e.g., line, station, equipment, component level), and not always aligned with simulation needs.
9: Traceability
10: Clarity Raw disturbance logs are not designed to be understandable for data consumers. Inconsistent disturbance classifications and interpretations cause ambiguity, e.g., when determining what disturbances affect technical availability, or distinguishing between stopping and non-stopping disturbances.
11: Consistency Variety in cause codes and stop type categories between production areas. Spelling mistakes in manual data logs aggravate data correction
The data in table 1 illustrate a wide variety of simulation data quality problems. A total of 19 data quality problems are found, located within all four categories and along 9 out of 11 quality dimensions. There is great variety in the nature of these problems, illustrated by how they range from technical PLC issues (accuracy), data filtering processes (completeness), to organizational mistrust (reputation). To overcome these problems, the simulation analyst is obliged to consult various experts within the organization. For example, accessibility and completeness problems are solved together with the maintenance department (e.g., extracting more extensive data logs), clarity problems are solved together with equipment experts (e.g., manually analyzing disturbance classifications), and reputation problems are solved together with project leaders and equipment experts (e.g., rework of data transformation). The most common effects of these data quality problems are increased lead-time of input data management and lack of credibility in simulation results.
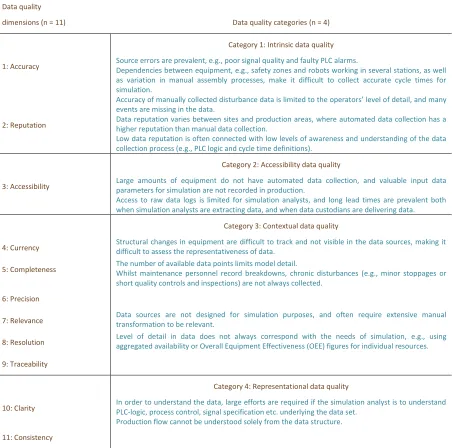
Table 2. Data quality problems in E4, E5, E6:
Data quality
dimensions (n = 11) Data quality categories (n = 4)
Category 1: Intrinsic data quality
1: Accuracy Source errors are prevalent, e.g., poor signal quality and faulty PLC alarms. Dependencies between equipment, e.g., safety zones and robots working in several stations, as well as variation in manual assembly processes, make it difficult to collect accurate cycle times for simulation.
Accuracy of manually collected disturbance data is limited to the operators’ level of detail, and many events are missing in the data.
2: Reputation Data reputation varies between sites and production areas, where automated data collection has a higher reputation than manual data collection. Low data reputation is often connected with low levels of awareness and understanding of the data collection process (e.g., PLC logic and cycle time definitions).
Category 2: Accessibility data quality
3: Accessibility Large amounts of equipment do not have automated data collection, and valuable input data parameters for simulation are not recorded in production. Access to raw data logs is limited for simulation analysts, and long lead times are prevalent both when simulation analysts are extracting data, and when data custodians are delivering data.
Category 3: Contextual data quality
4: Currency Structural changes in equipment are difficult to track and not visible in the data sources, making it difficult to assess the representativeness of data.
5: Completeness The number of available data points limits model detail. Whilst maintenance personnel record breakdowns, chronic disturbances (e.g., minor stoppages or short quality controls and inspections) are not always collected.
6: Precision
7: Relevance Data sources are not designed for simulation purposes, and often require extensive manual transformation to be relevant.
8: Resolution Level of detail in data does not always correspond with the needs of simulation, e.g., using aggregated availability or Overall Equipment Effectiveness (OEE) figures for individual resources.
9: Traceability
Category 4: Representational data quality
10: Clarity In order to understand the data, large efforts are required if the simulation analyst is to understand PLC-logic, process control, signal specification etc. underlying the data set. Production flow cannot be understood solely from the data structure.
11: Consistency
production and maintenance engineers to understand the flow and PLC logic (clarity), IT engineers to extract data (accessibility), or production managers to collect aggregated data (resolution). The most common effects of these data quality problems are increased lead-time of input data management and limitations to model complexity.
Table 3. Cross-case analysis of simulation data quality problems (E1-E6)
Similarities:
Input data management procedures are time-consuming and predominantly manual.
Simulation analysts need to consult various experts within the organization to resolve data quality problems.
Source errors (e.g., faulty PLC signals) are prevalent.
Dependencies between equipment (e.g., safety zones) influence cycle time data.
Accessibility is limited for simulation analysts, resulting in long-lead times for data collection.
Structural changes in production are difficult to track and not visible in the data.
Data on minor stoppages are often lacking.
Data sources are not designed for simulation purposes and require extensive data transformation.
Data resolution is not always in line with simulation requirements.
Considerable efforts are required for the simulation analyst to understand the logic of data sources and the data structure. No evidence for precision or traceability problems.
Differences:
Simulation input data are to a greater extent questioned in company A as compared to company B (i.e., difference in data reputation).
Evidence of consistency problems are found in company A, but not in company B.
Level of detail in data is higher in company A (component level in new monitoring systems) compared to company B (often aggregated availability or OEE data).
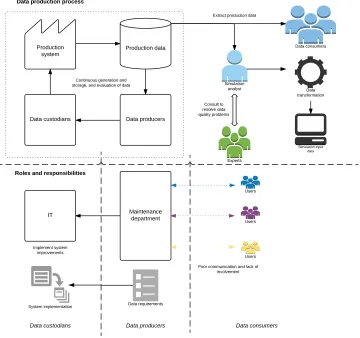
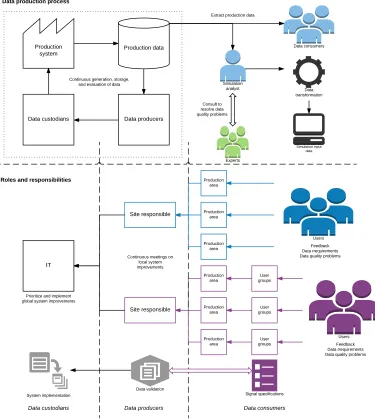
4.2 Data production processes
[image:24.612.135.495.251.589.2]The data collection processes at companies A and B are illustrated in this section, including descriptions of roles, responsibilities, and relationships. The data production process at company A is illustrated in figure 2, and the 10 most notable characteristics of the process are described in table 4.
Table 4. 10 key characteristics of the data production process in company A.
Poor communication between maintenance department and data consumers. Lack of structured process for collecting data requirements.
Lack of resources for data validation.
Low involvement of simulation analysts in data requirements for simulation.
Lack of involvement from shop-floor personnel, despite holding the responsibility for generating data. No education on information systems for data consumers.
Lack of time and resources for collaboration between custodians, producers, and consumers. Data consumers have difficulty in expressing data quality requirements.
User meetings have been previously prevalent and there is a wish to establish new user councils.
Equipment experts hold the knowledge on how to measure specific equipment (e.g., cycle times and disturbances).
Figure 2 shows a schematic illustration of the data production process in company A, including the current input data management procedures. The empirical data reveals the existing roles, responsibilities, and relationships. The role of data custodians is primarily held by the IT department, who are responsible for all factory IT. The central maintenance department also holds custodian responsibilities, e.g., in regard to servers, but acts primarily as a data producer responsible for collecting data requirements from users and communicating these with IT. Operative production personnel hold the end responsibility for generating data for the monitoring systems. Data consumers exist within the entire organization and include operators, maintenance and manufacturing engineers, simulation analysts etc. All information systems have various levels of user responsibilities (e.g., key users, super users, and local users).
figure 2). This is aggravated by the lack of structured processes, time, and resources for e.g., data requirement specifications, data validation, and education in IT systems. In sum, a substantial improvement potential can be found for the data production process in company A. However, it is important to note that a majority of the problematic characteristics in table 4 refers to a newly implemented monitoring system that faces many teething problems. In particular, the lack of strategies for implementing such systems can probably explain several of these characteristics.
Table 5. 10 key characteristics of the data production process in company B.
Data production has been problematic for a long time, but is now entering a new phase with many changes for the better. Global network of custodians and producers that holds regular meetings to discuss and communicate system improvements. Digital platform to manage implementation projects, collect data requirements, and report data quality problems (site 3). Continuous updates and improvements of monitoring systems.
Local users responsible for reporting feedback, requirements, and issues.
New, standardized signal specifications in all equipment to ensure consistency in data structures (site 2). Low involvement of simulation analyst in data requirement for simulation due to lack of experience (site 2). Emphasis on education within the user groups to increase trust in data (site 3).
Recently established data validation process that includes custodians, producers, and consumers, where operative personnel (consumers) are responsible for signal specification (site 3).
High involvement from simulation analyst in data requirements for simulation (e.g., flexible data collection and automatic filtering of simulation-relevant data) (site 3).
Large variety in data requirements makes it difficult for data custodians to prioritize between system improvements.
Table 6. Cross-case analysis of data production processes (companies A and B).
Similarities:
Largely similar roles and responsibilities for data custodians, producers, and consumers.
Advanced automated data collection systems where simulation data are primarily extracted from databases.
Wide variety of users within the organization (with different data requirements).
Low involvement from simulation analysts in communicating data requirements for simulation (except E6).
Differences:
The study in company A revolves primarily around a newly implemented monitoring system, whilst the study in company B revolves around a global system that has been used for over a decade.
Clearly established organizational structures for data production in company B.
Continuous meetings between data custodians and data producers on data requirements and system updates.
Closer collaboration between data producers and data consumers in company B compared to company A.
Data validation processes exist in company B (site 3), whilst company A lacks resources for data validation.
Education of data consumers present in company B (site 3), but lack of time and resources prevent this presence in company A. Digital platforms support the data production process in company B.
Different strategies when installing new equipment.
The cross-case analysis (table 6) shows that largely the same types of roles and responsibilities exist in the data production processes in companies A and B. However, as a whole, the empirical data indicates that company B has come further in developing a data production process capable of producing high quality data. In particular, roles and responsibilities are clearly described in organizational structures, strategies exist for data validation, and education is prevalent. Moreover, several of the differences between the two case companies revolve around communication, collaboration, and involvement from all three roles.
experience from use. Nevertheless, the two case studies provide an understanding of the differences between data production processes: those that are facing many problems (company A) and those that exhibit many promising features (company B).
5. Discussion
This study contributes with empirical descriptions of simulation data quality problems as well as data production processes and its relation to simulation data quality problems. Empirical descriptions of 33 simulation data quality problems are provided along 9 out of 11 simulation data quality dimensions (table 1 and 2) 18, 22. These descriptions depict a wide variety of quality problems, which implies that simulation data quality is a multi-faceted topic that involves both hard (technological) and soft (organizational) challenges. In addition, simulation practitioners interpret several data quality problems in a similar fashion (table 3). These findings act as support to several previous studies within simulation by providing a more in-depth understanding of data quality in DES. For example, the problems with data accessibility fortifies the fact that data collection is a particularly time-consuming activity for simulation analysts 6-8, 20; the problems with data clarity supports Skoogh and Johansson’s 8
findings of the high requirements on learning and understanding data sources; and the relevancy problems, which result in extensive manual data transformation, illustrate the value of both automated input data management and CMSD 9, 12-16.
stoppages are often missing since these stoppages are not the primary concern of maintenance engineers (table 3), but such data are crucial to simulation analysts in order to model variation in machine breakdowns. Similarly, data resolutions fulfil the requirements of production and maintenance engineers (e.g., aggregated OEE figures) but do not align with the requirements of simulation (table 1 and 2). Further, data custodians have difficulties in prioritizing between system updates due to large variety in data requirements (table 5). These findings provide additional support for the need to develop generic data structures and flexible information systems that are useful for a variety of activities, including simulation 33, 35.
Roles and responsibilities within the studied data production processes are largely similar (figure 2 and 3, table 6), i.e., production, maintenance, and automation engineers are data producers that generate data, IT engineers are data custodians that store data, and simulation analysts are data consumers that use data 23, 36. However, the context of the six cases (especially the life-span of the monitoring systems) resulted in a tendency showing the empirical descriptions of the data production process in company A to be predominantly negative, whilst the descriptions in company B are predominantly positive. Awareness of this polarity (evident in the cross-case differences in table 6) enables the results of this study to be used as tentative guidance for further understanding of how simulation data quality problems are associated with both weaknesses and strengths within an organization’s data production process.
In the general sense, company A lacks a well-established and structured data production process, which manifests itself through a number of hurdles having to be surmounted in order to achieve high quality data: poor communication and collaboration, lack of time, resources and clear strategies, and failure in utilizing existing knowledge within the organization (table 4). In such an organization, it is hardly surprising to find simulation data quality problems along dimensions such as reputation, accessibility, and relevance (table 1). A specific example is the relevance problems that are likely to be associated with the lack of involvement from the simulation analyst 36.
education within the user groups (E6, table 5) increases knowing-why in both data producers and data consumers, which is, according to Lee and Strong 36, associated with higher data quality. Similarly, the continuous meetings between producers and consumers (E5 and E6) as well as the digital platform for feedback, data requirements, and problem reporting (E6) are likely to support data producers in at least two ways: understanding the needs of data consumers 36 and understanding how data are used, which is valuable for improving the design of data production 37. Furthermore, the interviewed data producers in E6 experience that better knowledge of the data production process amongst data consumers is associated with higher levels of data reputation (table 5). Finally, the data validation process in E6, which rest upon decentralization of responsibilities to data consumers, is a particularly promising feature 21. In sum, these examples illustrate that data production processes which exhibiting well-established roles and responsibilities, cross-functional knowledge, and inter-disciplinary collaboration, are likely to be associated with higher levels of simulation data quality 36. Naturally, we propose that future research should invest in studying these associations causally in order to develop methodologies that proactively prevent simulation data quality problems.
perceived as having a key role that should be recognized and exploited in manufacturing companies. This is further strengthened by the observation of increased use of DES for maintenance scheduling 2. Therefore, researchers interested in simulation data quality within the manufacturing industry can benefit from relating their work to research into quality of maintenance data, e.g., 24, 25.
Throughout this study, we observed another role of particular importance to simulation data quality: the simulation analyst. From general data quality theory, it is known that data quality cannot be assessed independently of data consumers 29, 33, 36 and involvement from data consumers is necessary for data validation 21. However, this study provides a deeper view on a situation where simulation analysts are, in most cases, not actively involved in the data production process. This observed passivity of simulation analysts relates to the difference in mind-set between data collection in simulation literature and data production in data quality literature (section 2.3). We believe this difference in mind-set is not a matter of semantics. Instead, the existence of simulation data quality problems across various dimensions may very well be a result of this passive attitude towards simulation data collection. Therefore, we pledge not only extended methodologies, but also a prevailing mind-set within simulation not to passively collect
data, but to actively participate in producing data.
5.2 Practical guidelines for improving data quality in DES
Table 7. Practical guidelines for improving data quality in DES.
Practical guidelines for input data management to DES
In every simulation assignment, impress upon the client that high quality data are a necessity to successful simulation.
Given that production data are of high quality, input data management should be automated using a standardized process for transforming raw data to simulation input data (using e.g., GDM-Tool).
Broader alternatives to data standards should be explored beyond CMSD, e.g., adapting ISA95/STEP ISO 10303 standards to enable PLM-systems to hold detailed data for simulation (mean and statistical distribution).
Simulation data validation must be separated from simulation model validation, where simulation analysts validate both data and models using separate procedures and methods.
Practical guidelines for the role of simulation analysts in the data production process
Take an active role, e.g., adopt a leading position in a user council.
Simulation analysts should be the driving force in achieving credibility of simulation data, which involves providing final decision makers regarding simulation results with insights on the data production process and building a trust in the process’s ability to produce credible simulation input data.
Educate the organization on how raw data logs are necessary to achieving input data with both means and statistical distributions; aggregated data are insufficient for modelling e.g., variation in machine breakdowns.
Continuously identify, formulate, and communicate simulation data quality problems and simulation data requirements to data producers and custodians.
Co-operate particularly with data producers, with a focus on expressing simulation data requirements and explaining how data are used in simulation.
In cases of limited data accessibility, explore the possibilities of collaborating with equipment vendors in order to access extended data sets from the whole product population.
Practical guidelines for the data production process
Establish clear roles and responsibilities (custodians, producers, consumers) and foster inter-disciplinary communication and collaboration.
Educate all roles on what, how, and why data are being generated, stored, and used. Pay attention to the full range of needs among all users.
Develop flexible data collection systems that are useful for a large variety of users, with data that are easily understood and manipulated.
Validate production data using formal data validation procedures that incorporate all necessary competence, including the users. Production monitoring systems are commonly implemented as IT-projects, resulting in little value for data users. Instead, design and implement systems with a user-driven approach, in which all potential data users with vested interest are involved.
Decouple manual operator data collection from automated data collection systems. Operators should be involved in designing the system, but the system should perform the data collection.
Make a conscious choice on the extent and duration for storing historical data based on the requirements of the users.
Support the data production process with meetings, forums, and digital platforms to enable continuous evaluation and improvement.
Produce data on minor stoppages, since this is a necessity for both simulation and various forms of production data analytics. Correct coding of root causes to production disturbances is necessary for all types of use of production data (including simulation), e.g., distinguishing between equipment failure, operator error, or lack of input material.
Track and visualize structural production system changes in the data (e.g., root version handling when changes are introduced in products or production processes).
operationalizing measures of data quality and its dimensions specifically within the context of DES. To this end, the empirical knowledge gained from this study can be used as input. Second, future work needs to be directed towards developing practical solutions for solving simulation data quality problems, where additional studies can focus on the effectiveness of the proposed guidelines as well as provide extended support on how they can be implemented and accomplished most effectively.
6. Conclusions
By means of a multiple-case study within the automotive industry, this study contributes with empirical descriptions of simulation data quality problems from a practitioners’ perspective, data production processes, and its relation to simulation data quality problems. These empirical descriptions extend the present knowledge on data quality in DES in a practical real-world manufacturing context, which is a prerequisite for developing practical solutions for solving data quality problems.
perspective. This includes problems that simulation analysts are experiencing in similar fashion, such as limited accessibility, lack of data on minor stoppages, and data sources not being designed for simulation. Together, these descriptions span across 9 out of 11 dimensions and provide further understanding on underlying reasons for extensive lead times in input data management to DES.
Moreover, this paper presents empirical descriptions of the data production process in two automotive manufacturers. Specifically, by building on existing theories within the data quality area, we describe the roles, responsibilities, and relationships involved in achieving high quality production data (i.e., data producers, custodians, and consumers). Moreover, we describe how these relationships relate to simulation data quality problems, and provide examples for how the existences of simulation data quality problems are likely to be associated with the organizations’ data production processes (e.g., knowledge and education on data production processes, design of data structures, and data validation). In particular, we identify high involvement of simulation analysts in the data production process as a key aspect of achieving high quality production data to be used in simulation. Based on an observed difference between simulation literature and data quality literature, combined with the study’s empirical data, we suggest a prevailing mind-set within simulation not to passively collect data but to actively participate in
producing data.
throughout the study. These guidelines cover input data management to DES, the role of simulation practitioners in the data production process, and the data production process as a whole. They are relevant for manufacturing companies with advanced data collection systems and particularly in regards to breakdown input data.
As a final note, Orr 37 (p. 71) made a striking conclusion on the importance of data quality as early as 1998: “Because of the potential for year 2000 problems, every organization in the world that uses computers will have to confront the problems of data. This, coupled with the increased need for quality data for decision making, will make data quality a high priority item in every enterprise.” According to his prediction, well-functioning data production processes should be a common sight in manufacturing companies today, a situation not entirely supported by this study. In fact, considering the future realization of digitalized manufacturing (commonly spurred by the German initiative “Industrie 4.0”), moving towards using DES for real-time control 2, every organization is inevitably forced to manage big data quality problems. Therefore, we reiterate Orr’s 37 statement and argue that today, and even more so in the future, producing high quality data should be a top priority in every manufacturing company.
Acknowledgements
Funding
The research project “Streamlined Modeling and Decision Support for Fact-based Production Development (StreaMod)” is funded by VINNOVA, Swedish Agency for Innovation Systems [grant number 2013-04726]. This work has been performed within Sustainable Production Initiative and the Production Area of Advance at Chalmers. The support is greatly appreciated.
Author biography
JON BOKRANTZ is a PhD student within the area of Production Service & Maintenance Systems at the Department of Industrial and Materials Science, Chalmers University of Technology. Jon has a background in Production Engineering and his research focuses on maintenance in digitalized manufacturing. His email address is: [email protected]
DAN LÄMKULL, PhD, is Global Strategy Manager Ergonomics in the Department of Global Strategy and Process Development at Volvo Cars Manufacturing Engineering. He has been involved in Virtual Manufacturing research and development for more than twenty-four years. He received an MSc in Industrial Design from Luleå University of Technology, Sweden, in 1993 and a PhD in Virtual Manufacturing from Chalmers University of Technology in 2009. His current research includes Digital Human Modelling, Assembly and Disassembly Simulation, Virtual Operator Training, Lean Plant Design and Ergonomics. He has been involved in numerous research projects related to Virtual Manufacturing during the last thirteen years. In total, all projects have involved more than 20 industrial partners and ten academic partners. His e-mail address is [email protected].
ATIEH HANNA received her MSc. degree in Electrical Engineering from Chalmers University of Technology in 2001. Since then, she has been at Volvo Group Trucks, Gothenburg, Sweden, where she is currently research and development engineer within the Virtual Manufacturing. She participated in several research projects within production at Volvo Group Trucks Operations. Latest, she started her I.PhD study focusing on Design of Collaborative robots system. Her mail address is [email protected]
References
1. Jayaraman A and Gunal AK. Applications of discrete event simulation in the
design of automotive powertrain manufacturing systems. Proceedings of the 29th
Winter Simulation Conference. Altanta, GA1997, p. 758-64.
2. Negahban A and Smith JS. Simulation for manufacturing system design and
operation: Literature review and analysis. Journal of Manufacturing Systems. 2014;
33: 241-61.
3. Robinson S. Simulation: The Practice Of Model Development and Use.
Chichester: Wiley, 2004.
4. Banks J, Carson II J, Nelson B and Nicol D. Discrete-event system simulation.
4th ed. Upper Saddle River: Prentice-Hall, 2005.
5. Law AM. Simulation modeling and analysis. 5th ed. New York: McGraw-Hill,
2015.
6. Ülgen O, Black JJ, Johnsonbaugh B and Klunge R. Simulation methodology: A
practitioner’s perspective. Dearborn, MI: University of Michigan. 2006.
7. Robertson N and Perera T. Automated data collection for simulation?
Simulation Practice and Theory. 2002; 9: 349-64.
8. Skoogh A and Johansson B. Time-consumption analysis of input data
activities in discrete event simulation projects. Proceedings of the Swedish
Production Symposium. Gothenburg2007.
9. Perera T and Liyanage K. Methodology for rapid identification and collection
of input data in the simulation of manufacturing systems. Simulation Practice and
Theory. 2000; 7: 645-56.
10. Lehtonen J-M and Seppala U. A methodology for data gathering and analysis
in a logistics simulation project. Integrated manufacturing systems. 1997; 8: 351-8.
11. Skoogh A and Johansson B. A methodology for input data management in
discrete event simulation projects. Proceedings of the 40th Winter Simulation
Conference. Miami, FL: Winter Simulation Conference, 2008, p. 1727-35.
12. Skoogh A, Johansson B and Stahre J. Automated input data management:
evaluation of a concept for reduced time consumption in discrete event simulation.
Simulation: Transactions of the Society for Modeling and Simulation International. 2012; 88: 1279-93.
13. Khalek HA, Khoury SS, Aziz RF and Hakam MA. An Automated Input Data
Management Approach for Discrete Event Simulation Application in Slip-from
Operations. International Journal of Engineering Research and Applications. 2015; 5:
124-34.
14. Lee Y-TT, Riddick FH and Johansson BJI. Core Manufacturing Simulation
Data–a manufacturing simulation integration standard: overview and case studies.
International Journal of Computer Integrated Manufacturing. 2011; 24: 689-709.
15. Bloomfield R, Mazhari E, Hawkins J and Son Y-J. Interoperability of
manufacturing applications using the Core Manufacturing Simulation Data (CMSD)
standard information model. Computers & Industrial Engineering. 2012; 62:
16. Skoogh A, Perera T and Johansson B. Input data management in simulation–
Industrial practices and future trends. Simulation Modelling Practice and Theory.
2012; 29: 181-92.
17. Barlas P and Heavey C. Automation of input data to discrete event simulation
for manufacturing: A review. International Journal of Modeling, Simulation, and
Scientific Computing. 2016; 7: 1630001-27.
18. Balci O, Ormsby WF, Carr III JT and Saadi SD. Planning for verification,
validation, and accreditation of modeling and simulation applications. Proceedings of
the 32nd Winter Simulation Conference. Orlando, FL2000, p. 829-39.
19. Kuhnt S and Wenzel S. Information acquisition for modelling and simulation
of logistics networks. Journal of Simulation. 2010; 4: 109-15.
20. Bogon T, Timm IJ, Jessen U, et al. Towards assisted input and output data
analysis in manufacturing simulation: the EDASim approach. Proceedings of the 44th
Winter Simulation Conference. Berlin, Germany: IEEE, 2012, p. 1-13.
21. Wang RY, Storey VC and Firth CP. A framework for analysis of data quality
research. IEEE transactions on knowledge and data engineering. 1995; 7: 623-40.
22. Wang RY. A product perspective on total data quality management.
Communications of the ACM. 1998; 41: 58-65.
23. Batini C, Cappiello C, Francalanci C and Maurino A. Methodologies for data
quality assessment and improvement. ACM computing surveys (CSUR). 2009; 41: 16.
24. Lin S, Gao J, Koronios A and Chanana V. Developing a data quality framework
for asset management in engineering organisations. International Journal of
Information Quality. 2007; 1: 100-26.
25. Aljumaili M, Wandt K, Karim R and Tretten P. eMaintenance ontologies for
data quality support. Journal of Quality in Maintenance Engineering. 2015; 21:
358-74.
26. Balci O. Guidelines for successful simluation studies (tutorial session).
Proceedings of the 22nd Winter Simulation Conference. New Orleans, LA: IEEE Press, 1990, p. 25-32.
27. Sargent RG. Verification and validation of simulation models. Proceedings of
the 37th Winter Simulation Conference. Orlando, FL2005, p. 130-43.
28. Rabe M, Spieckermann S and Wenzel S. Verification and validation activities
within a new procedure model for V&V in production and logistics simulation.
Proceedings of the 39th Winter Simulation Conference. Austin, TX2009, p. 2509-19.
29. Wand Y and Wang RY. Anchoring data quality dimensions in ontological
foundations. Communications of the ACM. 1996; 39: 86-95.
30. Eppler MJ. Managing information quality: Increasing the value of information
in knowledge-intensive products and processes. Springer Science & Business Media, 2006.
31. Scannapieco M and Catarci T. Data quality under a computer science
perspective. Archivi & Computer. 2002; 2: 1-15.
32. Wang RY and Strong DM. Beyond accuracy: What data quality means to data
consumers. Journal of management information systems. 1996; 12: 5-33.
33. Strong DM, Lee YW and Wang RY. Data quality in context. Communications of
34. Williams EJ and Ülgen OM. Pitfalls in managing a simulation project.
Proceedings of the 44th Winter Simulation Conference. Berlin, Germany2012, p. 1-8.
35. Randell L. On discrete-event simulation and integration in the manufacturing
system development process. Lund University, Sweden, 2002.
36. Lee YW and Strong DM. Knowing-why about data processes and data quality.
Journal of Management Information Systems. 2003; 20: 13-39.
37. Orr K. Data quality and systems theory. Communications of the ACM. 1998;
41: 66-71.
38. Yin RK. Case study research: Design and methods. 5th ed. Thousand Oaks, CA:
Sage Publications, 2013.
39. Eisenhardt KM. Building theories from case study research. Academy of
management review. 1989; 14: 532-50.
40. Flyvbjerg B. Five misunderstandings about case-study research. Qualitative