Title Crop classification from full-year fully-polarimetric L-band UAVSAR time-series using the Random Forest algorithm
Article type Research Paper
Abstract
Accurate and timely information on the distribution of crop types is vital to agricultural management, ecosystem services valuation and food security assessment. Synthetic Aperture Radar (SAR) systems have become increasingly popular in the field of crop monitoring and classification. However, the potential of time-series polarimetric SAR data has not been explored extensively, with several open scientific questions (e.g. the optimal combination of image dates for crop classification) that need to be answered. In this research, the usefulness of full year (both 2011 and 2014) L-band fully-polarimetric Uninhabited Aerial Vehicle Synthetic Aperture Radar (UAVSAR) data in crop classification was fully investigated over an agricultural region with a heterogeneous distribution of crop categories. In total,11 crop classes including tree crops (almond and walnut), forage crops (grass, alfalfa, hay, and clover), a spring crop (winter wheat), and summer crops (corn, sunflower, tomato, and pepper), were discriminated using the Random Forest (RF) algorithm. The SAR input variables included raw linear polarization channels as well as polarimetric parameters derived from Cloude-Pottier (CP) and Freeman-Durden (FD) decompositions. Results showed clearly that the polarimetric parameters yielded much higher classification accuracies than linear polarizations. The combined use of all variables (linear polarizations and polarimetric parameters) produced the maximum overall accuracy of 90.50% and 84.93% for 2011 and 2014, respectively, with a significant increase of approximately 8 percentage points compared with linear polarizations alone. The variable importance provided by the RF illustrated that the polarimetric parameters had a far greater influence than linear polarizations, with the CP parameters being much more important than the FD parameters. The most important acquisitions were the images dated during the peak biomass stage (July and August) when the differences in structural characteristics between most crops were the largest. At the same time, the images in spring (April and May) and autumn (October) also contributed to the crop classification since they respectively provided unique information for discriminating fruit crops (almond and walnut) as well as summer crops (corn,
sunflower, and tomato). As a result, the combined use of only four acquisitions (dated May, July, August, and October for 2011 and April, June, August, and October for 2014) was adequate to achieve a nearly-optimal overall accuracy. In light of the promising classification accuracies demonstrated in this research, it becomes increasingly viable to provide accurate and up-to-date crops inventories over large areas based solely on multitemporal polarimetric SAR.
Keywords Crop classification; multitemporal SAR imagery; polarimetric SAR; Random Forest algorithm; UAVSAR.
Taxonomy Mapping, Multi-Temporal Image, Classification
Corresponding Author Huapeng Li
Cover letter.pdf [Cover Letter]
Response letter.pdf [Response to Reviewers] Highlights.pdf [Highlights]
Manuscript.pdf [Manuscript File] Fig1.pdf [Figure]
Fig2.pdf [Figure] Fig3.pdf [Figure] Fig4.pdf [Figure] Fig5.pdf [Figure] Fig6.pdf [Figure] Fig7.pdf [Figure] Fig 8.pdf [Figure] Table 1.pdf [Table] Table 2.pdf [Table] Table 3.pdf [Table] Table 4.pdf [Table] Table 5.pdf [Table]
Conflict of interest.pdf [Conflict of Interest] JAG Author statement.pdf [Author Statement]
International Journal of Applied Earth Observations and Geoinformation
On behalf of my co-authors, we thank you very much for giving us the opportunity to revise the manuscript, and we are grateful to editor and reviewers for their constructive comments and suggestions on our manuscript titled “Crop classification from full-year fully-polarimetric L-band UAVSAR time-series using the Random Forest algorithm” (Former Ref: JAG_2019_478_R1).
We have revised the manuscript carefully according to the comments, and highlighted the revisions in the revised manuscript using the blue text. In our point-by-point response letter attached below, the comments of editor and each reviewer are provided in plain text followed by our responses in blue text.
We trust that you will find the revised manuscript acceptable for publication in International Journal of Applied Earth Observations and Geoinformation.
Looking forward to hearing from you. Best wishes
Professor Peter M. Atkinson
Dean, Faculty of Science and Technology, Lancaster University,
Tel: 01524 595203
We are grateful to editor and reviewers for their constructive comments and suggestions, and have carefully revised the manuscript in response to their advice. The comments of editor and each reviewer in plain text followed by our responses in blue text are provided below.
Editor:
The reviewers recognize that the manuscript has been improved through the major revision, and identify a few final issues to resolve, which are detailed in the review reports. In addition to those comments, please:
1. Revise the research highlights to comply with JAG’s guidelines for authors: 3 to 5 bullet points (maximum 85 characters, including spaces, per bullet point).
Response (R): Thanks for this reminder. We have rewritten the highlights as suggested as follows:
"• Overall accuracy of crop classification reaches 85%-90% by using full year UAVSAR
• Polarimetric parameters contribute more than linear polarizations to crop mapping
• The CP parameters are much more important than the FD parameters for crop mapping
• The combined use of four acquisitions is adequate to achieve a nearly optimal accuracy".
2. Revise Figure 3, 4 and 5 to add north arrow, scale bars, colour scales/legends.
R: Yes, we have revised Figure 3 (a) and (c) to include north arrow and scale bar into the figures. There seems no need to revise Figures 4 and 5 since they are of the same location and spatial size as Figure 3 (a) and (c).
3. Revise Figure 6 to make the labels of the bars readable.
- All issues raised by the review have been satisfactorily addressed
Response (R): Many thanks for this positive feedback.
-Reviewer 2
Many thanks for providing us with these very careful and constructive comments. We have revised the manuscript carefully according to the comments and responded to them point by point as below.
1. In the abstract in line number 31, the use of the greatest word is not suitable. Change it to maximum overall accuracy.
Response (R): Agreed. We have replaced the word as suggested.
" …produced the maximum overall accuracy of 90.50% and 84.93% for 2011 and 2014…" (page 2, line 30-31).
2. There is a mismatch between the title and the work done. Authors are mentioning full-year data UAVSAR time-series data for crop identification. However, on line number 42, they are indicating that only four acquisitions are enough to do so. Hence, a full year SAR signature is not required. Therefore, they should change the title related to the crop classification/ identification phenomenon.
R: Many thanks for this suggestion. We found that the combined use of only four acquisitions was able to achieve nearly-optimal overall accuracy. However, such a conclusion was drawn based on the analysis of full year UAVSAR time-series (section 4.3). Moreover, the experimental results of classifications (section 4.1) and variable importance (section 4.2) were also achieved based on full year time-series. The current title thus seems to be suitable for this research.
follows:
" Besides, no further geometric corrections were made in view of the small spatial shifts (lower than half the pixel) across the time-series by checking the boundaries of some randomly selected crop fields. This high-precision spatial matching between acquisitions is essential to classification based on multitemporal UAVSAR. " (page 8-9, line 186-190).
4. The authors should also infer the cause of the decrease in overall accuracy by 6% from 2011 to 2014. It is not indicated.
R: Many thanks for this suggestion. We have elaborated this in the discussion section as follows:
"The overall accuracy of 2014 was lower than that of 2011 by about 6 percentage points. This is because July UAVSAR image that can make unique contributions to the separation of crop types (Li et al., 2019) was not included in the 2014 time-series (Table 1)." (page 18, line 425-428).
5. Authors are mentioning that among 81 variables, only 36 are most important (in line number 369). Why is it so? The cause is not given. Also, from line number 371 to 382, many parameters are written as important without the cause. The authors should investigate the cause of the importance of the parameters.
R: Many thanks for this feedback. We have discussed the cause of the importance for the employed variables in the discussion section as follows:
• Overall accuracy of crop classification reaches 85%-90% by using full year
UAVSAR
• Polarimetric parameters contribute more than linear polarizations to crop
mapping
• The CP parameters are much more important than the FD parameters for crop
mapping
• The combined use of four acquisitions is adequate to achieve a nearly optimal
1
Crop classification from full-year fully-polarimetric L-band UAVSAR time-series
2
using the Random Forest algorithm
3
4
Huapeng Li a, b, Ce Zhang b, c*, Shuqing Zhang a, Peter M. Atkinson d,*
5
6
aNortheast Institute of Geography and Agroecology, Chinese Academy of Sciences,
7
Changchun 130012, China; bLancaster Environment Centre, Lancaster University,
8
Lancaster LA1 4YQ, UK; cCentre for Ecology & Hydrology, Library Avenue, Bailrigg,
9
Lancaster LA1 4AP, UK; dFaculty of Science and Technology, Lancaster University,
10
Lancaster LA1 4YR, UK. 11
12
Abstract
13
Accurate and timely information on the distribution of crop types is vital to agricultural 14
management, ecosystem services valuation and food security assessment. Synthetic 15
Aperture Radar (SAR) systems have become increasingly popular in the field of crop 16
monitoring and classification. However, the potential of time-series polarimetric SAR 17
data has not been explored extensively, with several open scientific questions (e.g. the 18
optimal combination of image dates for crop classification) that need to be answered. In 19
this research, the usefulness of full year (both 2011 and 2014) L-band fully-polarimetric 20
Uninhabited Aerial Vehicle Synthetic Aperture Radar (UAVSAR) data in crop 21
classification was fully investigated over an agricultural region with a heterogeneous 22
distribution of crop categories. In total,11 crop classes including tree crops (almond and 23
walnut), forage crops (grass, alfalfa, hay, and clover), a spring crop (winter wheat), and 24
summer crops (corn, sunflower, tomato, and pepper), were discriminated using the 25
Random Forest (RF) algorithm. The SAR input variables included raw linear polarization 26
channels as well as polarimetric parameters derived from Cloude-Pottier (CP) and 27
Freeman-Durden (FD) decompositions. Results showed clearly that the polarimetric 28
parameters yielded much higher classification accuracies than linear polarizations. The 29
combined use of all variables (linear polarizations and polarimetric parameters) produced 30
the maximum overall accuracy of 90.50% and 84.93% for 2011 and 2014, respectively, 31
with a significant increase of approximately 8 percentage points compared with linear 32
polarizations alone. The variable importance provided by the RF illustrated that the 33
polarimetric parameters had a far greater influence than linear polarizations, with the CP 34
parameters being much more important than the FD parameters. The most important 35
acquisitions were the images dated during the peak biomass stage (July and August) when 36
the differences in structural characteristics between most crops were the largest. At the 37
same time, the images in spring (April and May) and autumn (October) also contributed 38
to the crop classification since they respectively provided unique information for 39
discriminating fruit crops (almond and walnut) as well as summer crops (corn, sunflower, 40
and tomato). As a result, the combined use of only four acquisitions (dated May, July, 41
August, and October for 2011 and April, June, August, and October for 2014) was 42
adequate to achieve a nearly-optimal overall accuracy. In light of the promising 43
classification accuracies demonstrated in this research, it becomes increasingly viable to 44
provide accurate and up-to-date crops inventories over large areas based solely on 45
Keywords: Crop classification; multitemporal SAR imagery; polarimetric SAR; Random 48
Forest algorithm; UAVSAR. 49
50
1. Introduction
51
52
Information on crop types and their spatial distribution is of great importance to 53
agricultural management, ecosystem services valuation and food security assessment 54
(Thenkabail et al., 2012; Bargiel, 2017). For example, detailed crop distribution data are 55
critical for assessing accurately agricultural water use at different spatial scales and 56
making effective policies to increase water use efficiency in agricultural areas (Zheng et 57
al., 2015). Agriculture is also a major source of greenhouse gas (GHG); high accuracy 58
modelling of GHG emissions from agriculture relies heavily on the detailed distribution 59
of crop types (Pena-Barragan et al., 2011). Besides, crop classification data is the 60
fundamental input to estimating agricultural production, which serves as an important 61
early warning indicator of famine (Thornton et al., 1997). As a result, crop maps are 62
updated routinely in many cropland regions by ground survey. However, this procedure 63
is usually labour intensive and expensive, and is impractical for many developing 64
countries. In addition, it is difficult to generate consistent and intercomparable data 65
between countries or even continents in consideration of the different ground field survey 66
methods adopted (Ozdogan and Woodcock, 2006). 67
Remote sensing, which provides routine coverage over large areas, could serve as a 68
cost-effective means of complementing or even replacing field survey. A large body of 69
studies has classified single or multiple crop types using optical images at medium spatial 70
Wardlow and Egbert, 2008). However, access to optical remotely sensed imagery relies 72
heavily on the weather conditions, which hugely limits the utility of such data in real 73
applications (Sonobe et al., 2014). Synthetic aperture radar (SAR) is an active sensor 74
which operates at relatively long wavelengths and which can penetrate cloud and haze. 75
As a result, SAR provides the best opportunity for monitoring crops through the growing 76
season as it is able to acquire data regardless of meteorological conditions (Sonobe et al., 77
2014). SAR imagery differs from reflectance measured by optical imagery, as SAR 78
characterizes the structural attributes as well as the dielectric properties of the vegetation 79
canopy which may be unique to each class, thus being valuable for crop discrimination 80
(McNairn et al., 2009). 81
Different from other land cover types, agricultural regions may experience great 82
variations during a short time depending on climatic conditions, soil properties, farmer’s 83
decisions, and so on (Wardlow and Egbert, 2008). Thus, crop areas with the same crop 84
type may have distinctive polarimetric (spectral) properties, whereas those with different 85
crop types often exhibit similar polarimetric behaviours (Li et al., 2019). This poses great 86
difficulties for single-date SAR image-based crop classification (Silva et al., 2009), which 87
can be improved by the utilization of image time series. As a certain crop type might be 88
correctly separated from others at specific crop stages (Jiao et al., 2014; Bargiel, 2017), 89
multi-temporal SAR data can thus improve crop classification results (Skriver et al., 90
2012). For example, Tso and Mather (1999) classified an agricultural area in Norfolk, UK 91
with seven ERS-1 SAR images, obtaining a classification accuracy of 75%; with six 92
scenes of ENVISAT ASAR images, Wang et al. (2010) mapped an agricultural area in 93
(e.g. Nguyen et al., 2016; Ndikumana et al., 2018). However, the SAR data used in these 96
works were restricted to single polarization (ERS-1 and Radarsat-1) or dual-polarization 97
mode (ENVISAT ASAR and Sentinel-1), thus without making full use of polarization 98
information. 99
Radar response to vegetation structure is polarization-dependent. Herein, horizontally 100
polarized waves (H) show good capability in penetrating the vegetation canopy, thus 101
achieving more information about surface soil condition by HH polarization. In contrast, 102
vertically polarized waves are very sensitive to vertical vegetation structure, which 103
explains the fact that VV polarization performs well in characterizing vertical vegetation 104
structure (Lin and Sarabandi, 1999). Moreover, the cross polarizations (HV and VH) 105
provide information about the total canopy volume that is complementary to the co-106
polarizations (HH and VV). The fully polarimetric SAR, with all types of polarizations, 107
can significantly improve the observed information dimension of agricultural targets 108
(McNairn and Brisco, 2004). In addition, polarimetric parameters that provide unique 109
information for crop discrimination can be generated with full polarimetric (HH, HV, and 110
VV) SAR (Jiao et al., 2014). McNairn et al. (2009) demonstrated the unique value of 111
polarimetric SAR in crop classification in comparison to single- or dual-polarization data. 112
With polarimetric SAR time-series, efforts had been devoted to crop classification. For 113
example, Jiao et al. (2014) achieved promising crop classification results (with overall 114
accuracy > 90%) over an agricultural area in Canada with 19 scenes of C-band 115
RADARSAT-2 data; with the same data type, Liu et al. (2013) obtained an overall 116
classification accuracy of 85% in classifying corn, spring wheat, and soybean over a test 117
site in Eastern Ontario, Canada; Whelen and Siqueira (2017) acquired the best 118
by using L-band Uninhabited Aerial Vehicle Synthetic Aperture Radar (UAVSAR). The 120
above-mentioned classification results are encouraging. However, the full year or full 121
growing season SAR data adopted by these studies are heavily redundant, and such data 122
requirements suffer from high expense, limited data availability, and low data processing 123
efficiency. In contrast, comparable crop classification results might be achieved by 124
combining a few images dated on critical phenology (Jiao et al., 2014; Li et al., 2019). 125
Such research topic has, however, received little attention. In addition, few efforts have 126
been made to quantitatively investigate the importance of polarimetric parameters, 127
although they are widely used in crop classification studies. 128
The primary objective of this paper was to explore the potential of L-band UAVSAR 129
time-series for crop mapping. With a relatively long wavelength, UAVSAR has the 130
capacity to penetrate crop canopies, which is critical for crop classification. UAVSAR 131
data are acquired in polarimetric mode with fine spatial resolution (5 m) by National 132
Aeronautics and Space Administration (NASA), which provides a unique opportunity to 133
assess the usefulness of multitemporal fully-polarimetric SAR for crop classification. 134
Herein, the Random Forest (RF) classifier, an ensemble machine learning technique, was 135
applied to the UAVSAR time-series in light of its robust to high-dimensional and noise 136
data (Belgiu and Draguţ, 2016). Besides, previous studies have demonstrated that the RF 137
algorithm is suitable for SAR-based crop classification (Loosvelt et al., 2012a, 2012b). 138
An agricultural region with heterogeneous and complex crop types in the Sacramento 139
Valley, California was selected as the test site in this research. 140
(1) By using the well-known non-parametric machine learning RF algorithm, the 142
potential of different combinations of predicator variables in crop discrimination was 143
fully explored; 144
(2) The variable importance for crop classification was quantified across input 145
variables (including linear polarizations and polarimetric parameters) as well as over 146
acquisitions spanning two full calendar years (2011 and 2014); 147
(3) A forward selection procedure was conducted to search for the optimal combination 148
of SAR images that made the best tradeoff between classification accuracy and number 149
of acquisitions, which could be transferable to other agricultural areas. 150
151
2. Study area and data source
152
153
2.1 Study area 154
The study area of this research is located at an agricultural region in the middle of the 155
Sacramento Valley, USA. It stretches over Solano and Yolo counties of California, with 156
a size of about 11 km × 17 km (Fig. 1). The climate of this area is characterized as 157
Mediterranean, with dry hot summers and wet cool winters (Zhong et al., 2012). The 158
annual rainfall amount is nearly 750 mm, mainly concentrated during the period from 159
winter to the next spring. This area is characterized by a vast flat terrain and deep soil 160
layers which makes it suitable for farming. Indeed, it is one of the most productive 161
agricultural areas in the United States. A total of 11 crop types comprising most of the 162
study area were considered in this research, including almond, walnut, grass, alfalfa, hay, 163
provide a unique opportunity to investigate the capability of time-series UAVSAR for 165
crop classification over heterogeneous regions. 166
167
Fig. 1 is here 168
169
2.2 UAVSAR data 170
Full-polarimetric airborne UAVSAR data were employed in this research. This SAR 171
system was developed by NASA JPL, with the primary design goal of monitoring 172
deforming surfaces resulting either from natural factors or human activities (Hensley et 173
al., 2009). It operates in L-band with a frequency of 1.26 GHz and a wavelength of 23.84 174
cm. Nominally, the system flown at an altitude of 12.5 km covers a swath of about 20-175
km (Chapman et al., 2011), and all flights have nearly identical flight headings and 176
altitude. The range and azimuth pixel spacings in single-look complex (SLC) imagery are, 177
respectively, 1.66 and 1 m, with the incidence angles ranging from 25° to 65°. 178
The UAVSAR images used in this research were the calibrated and ground range 179
projected (GRD) product. The covariance matrices contained in the product are multilook 180
with 3 × 12 pixels in the range and azimuth directions, with a pixel spacing of 5 m. The 181
linear polarization channels for each dataset were extracted and georeferenced to the 182
UTM coordinate using the MapReady software (Alaska Satellite Facility, ASF). There 183
was no requirement to apply speckle filters as the multiplicative noise (speckle) inherent 184
in the SAR was reduced markedly by the multilook procedure (Dickinson et al., 2013), 185
producing an estimated equivalent number of looks between 6 and 8. Besides, no further
186
geometric corrections were made in view of the small spatial shifts (lower than half the
187
pixel) across the time-series by checking the boundaries of some randomly selected crop
fields. This high-precision spatial matching between acquisitions is essential to
189
classification based on multitemporal UAVSAR.
190
In total, nine scenes of UAVSAR imagery spanning the full year of 2011 were collected 191
over the study area. Besides, seven scenes of UAVSAR imagery captured in 2014 were 192
also acquired to further investigate the potential of UAVSAR time series for crop 193
classification. Table 1 provides detailed descriptions of the data as well as meteorological 194
data on the image acquisition dates. The meteorological data were acquired at a station 195
(in the city of Sacramento) next to the study area (NOAA-NCEI, 2011, 2014). The 196
presence of rainfall may have an impact on crop classification owing to the higher 197
moisture contained in the canopy and soil. Fortunately, nearly all the UAVSAR images 198
were collected under dry conditions except the acquisition in October 2011 and 199
November 2014 when very light precipitation (less than 7 mm) was recorded (Table 1). 200
Besides, freezing in the soil may also interfere with the radar response by altering the 201
dielectric constant of soil. However, the effect of freezing on the SAR observations should 202
be minimal given the relatively small amounts of precipitation on the data acquisition 203
dates (January and December 2011) with air temperatures around freezing point (Table 204
1). 205
206
Table 1 is here 207
208
3. Methods
209
210
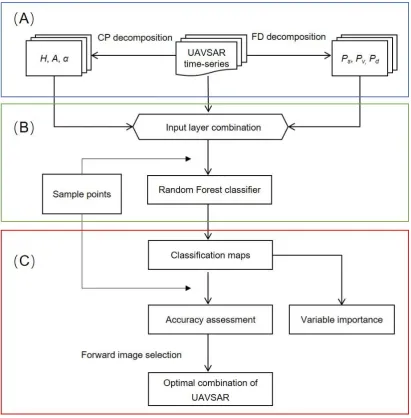
In this section, the data preprocessing and analysis methodologies were elaborated in 211
detail. A flowchart that illustrates data processing and analysis steps of this research is 212
214
Fig. 2 is here 215
216
3.1 SAR polarimetric decomposition 217
The rationale for a decomposition lies in the fact that polarimetric SAR signal can be 218
deconstructed to derive polarimetric parameters that characterize structural properties and 219
the scattering mechanisms of ground targets. In this research, two widely accepted 220
decompositions, Cloude-Pottier (CP) and Freeman-Durden (FD), were applied to each 221
UAVSAR dataset. The former is an eigenvector-eigenvalue based decomposition, while 222
the latter belongs to the family of model-based decompositions. The CP decomposition 223
is designed to characterize primary scattering mechanisms for surface targets (Cloude and 224
Pottier, 1997), with three parameters including entropy (H), anisotropy (A), and alpha
225
angle (α) being commonly generated. Both entropy and anisotropy vary between 0 to 1,
226
while alpha angle has a range of 0-90°. Entropy is a measurement of the randomness of 227
scattering, with a high value indicating a multiplicity of scattering mechanisms. 228
Anisotropy describes the relative importance of the secondary mechanism, and the value 229
represents the strength of scattering. Alpha angle characterizes the dominant scattering 230
mechanisms, with angle values below 40°, around 45°, and over 50° denoting the 231
dominance of surface scattering, volume or dipole scattering, and double-bounce 232
scattering, respectively. The FD decomposition is built on a physical model, based on 233
which fractions of surface scattering (Ps), volume scattering (Pv), and double-bounce
234
scattering (Pd) are determined for each target (each pixel of image) (Lee and Pottier, 2009).
235
order Bragg surface, double-bounce dihedral corner reflector, and thin randomly oriented 237
cylindrical dipoles (Freeman and Durden, 1998). 238
3.2 Collection of reference data 239
The United States Department of Agriculture (USDA) Cropland Data Layer (CDL) 240
served as the reference data to acquire ground samples for crop classification and 241
validation. The CDL is produced annually based on several types of medium spatial 242
resolution optical images (e.g. Landsat TM) and a large number of ground reference data 243
(Boryan et al., 2011), with a spatial resolution of 30 m. CDL data have been used in a 244
wide range of applications because of its very high quality (e.g. Sun et al., 2008; Zheng 245
et al., 2015; Whelen and Siqueira, 2017). According to the USDA National Agricultural 246
Statistics Services (NASS), the overall classification accuracy for the CDL in 2011 and 247
2014 over the state of California was determined to be 83% and 81%, respectively, with 248
the accuracies for the major crop types (alfalfa, sunflower, and tomato) ranging between 249
83% and 94%. It is noted that the mislabeled pixels of CDL are mainly at the edge of crop 250
fields and the fields with relatively small area by visual inspection. However, these areas 251
were not included in the subsequent manual labelling procedure (see below), by which 252
the actual accuracies of the reference data used in this research should be much higher 253
than those reported by the USDA-NASS. 254
255
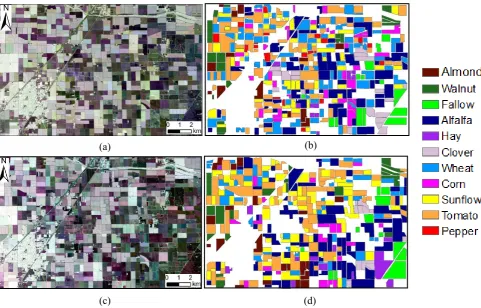
Fig. 3 is here 256
257
The acquisition of ground sample points was comprised of three steps. First, the August 258
SAR acquisition with clear boundaries between crop fields was overlaid on the CDL 259
image to identify crop fields over the study area; note that fields with an area below 5 ha 260
buffered inward by one pixel to remove the mislabeled edge pixels (Fig. 3); a stratum for 262
each crop class was made by merging the outlined patches belonging to the class. Third, 263
patches of each crop type were split randomly into two equal subsets; one half subset was 264
for generating training samples, and the other half subset for collecting testing samples, 265
so as to make sure that training and testing samples are taken from different crop patches. 266
In total, 2316 and 2124 sample points (pixels) were acquired for 2011 and 2014, 267
respectively, with a number of about 200 samples for each crop type. 268
3.3 Random Forest classification 269
In total, nine predictor variables were created from each UAVSAR dataset, consisting 270
of three linear polarizations (HH, HV and VV), three CP decomposition parameters (H,
271
A and α), and three FD decomposition parameters (𝑃𝑠,𝑃𝑣,𝑃𝑑). The Random Forest (RF)
272
algorithm was applied using different combinations of input image layers: 1) linear 273
polarizations alone, 2) CP decomposition parameters alone, 3) FD decomposition 274
parameters alone, and 4) all predicator variables (linear polarizations and CP and FD 275
parameters). Descriptions of the combinations of input variables are shown in Table 2. 276
277
Table 2 is here 278
279
The RF algorithm is an ensemble classifier consisting of a collection of tree-type 280
classifiers {ℎ(𝑥, 𝜃𝑘), 𝑘 = 1, 2, … , 𝑇}, where 𝑥 is an input vector (pattern), 𝜃𝑘 are
281
independent and identically distributed random vectors, and 𝑇 is the number of trees
282
defined by users (Breiman, 2001). In the training process, the RF creates multiple 283
classification and regression trees, each of which is trained on a different bootstrap sample 284
labelled with the class having the most votes. In this research, the number of trees created 287
for each classification was set as 500 to achieve a stable state for the out-of-bag (OOB) 288
accuracy of the RF. Besides, the square root of inputs wasused as the number of variables 289
to determine splits at the nodes. 290
The variable importance (𝑉𝐼) provided by the RF can not only quantify the influence 291
of each variable separately, but also multivariate interactions with other variables 292
(Gislason et al., 2006). In general, the 𝑉𝐼 for a certain variable 𝑋𝑖 can be estimated with
293
the following steps. First, the prediction error with OOB samples (𝑒𝑟𝑟𝑂𝑂𝐵) is calculated 294
over the created trees. Second, the classifier randomly permutes the OOB samples of 295
variable 𝑋𝑖, with which the prediction error (𝑒𝑟𝑟𝑂𝑂𝐵𝑖) for each tree is measured. Finally,
296
the 𝑉𝐼 is computed by averaging the difference in the prediction errors between original 297
OOB samples and randomly permuted samples through all trees as follows: 298
𝑉𝐼(𝑋𝑖) = 1
𝑛𝑡𝑟𝑒𝑒∑ 𝑒𝑟𝑟𝑂𝑂𝐵𝑡
𝑖 − 𝑒𝑟𝑟𝑂𝑂𝐵 𝑡 𝑛𝑡𝑟𝑒𝑒
𝑡=1 (1)
299
where 𝑡 denotes a certain tree, and 𝑛𝑡𝑟𝑒𝑒 is the total number of trees. The 𝑉𝐼 is
300
subsequently normalized by dividing the variable’s 𝑉𝐼 by its standard deviation.
301
3.4 Accuracy assessment 302
To evaluate the accuracies of the classification maps, a confusion matrix was generated 303
for each classification by comparing the classified data with the reference points at each 304
of the sampled pixels. The overall accuracy (OA) and per-class mapping accuracy were 305
computed for each classification (Foody, 2004). The Kappa coefficients of agreement and 306
their variances were also estimated, based on which a Kappa z-test was adopted to
307
evaluate the statistical significance of Kappa coefficients for pairwise classifications 308
using the following equation (Congalton and Green, 1999): 309
𝑧 = (𝑘1− 𝑘2)/ √(𝑣1+ 𝑣2) (2)
where 𝑘 is the Kappa coefficient and 𝑣 is the Kappa variance. If z exceeds a threshold 311
of 1.96, the two classification results are considered significantly different at the 95% 312
confidence level. 313
3.5 Optimal combination of SAR data 314
In total, nine scenes of images in 2011 and seven scenes of images in 2014 covering a 315
full calendar year respectively were used in this research. However, contributions from 316
different acquisitions to crop classification accuracy may vary greatly (Li et al., 2019). 317
Hence, it is necessary to determine an optimal combination of images that could gain an 318
acceptable level of classification accuracy. This may not only reduce the cost of images, 319
but also lighten the computational burden of image processing and classification. In this 320
research, a forward image selection procedure was adopted in search of the optimal 321
combination of SAR imagery for crop classification (Pena and Brenning, 2015). Hereinto, 322
the images were gradually selected and included in the feature set (starting with an empty 323
feature set) with an increment of one date, and the image combination with the best 324
classification accuracy was chosen at each step. 325
326
4. Results
327
328
4.1 Random Forest classifications 329
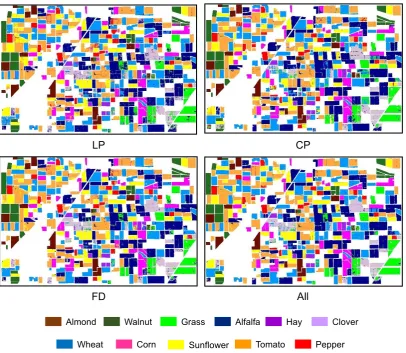
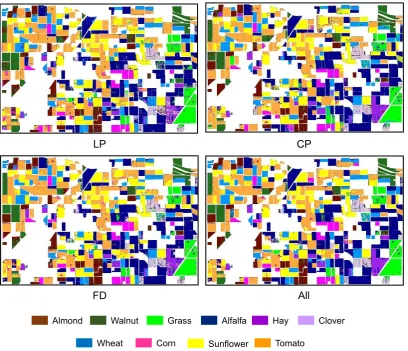
Figs. 4 and 5 show the classification maps achieved by the Random Forest (RF) 330
algorithm using different combinations of predictor variables from 2011 and 2014 331
UAVSAR time series, respectively. Tables 3 and 4 list the detailed accuracy assessment 332
of the RF classifications with overall accuracy (OA), Kappa coefficient (k) as well as
i.e. F1 score). From the tables, it can be seen that the classification based on LP temporal 335
profile has the smallest OAs, 82.38% and 76.18% for 2011 and 2014, respectively. By 336
comparison, both CP and FD parameters achieved much more accurate results, with OAs 337
= 83.63% and 87.65% for 2011 and OAs = 78.06% and 80.32% for 2014, respectively 338
(Tables 3 and 4). When simultaneously using the LP, CP, and FD temporal profiles, the 339
RF produced the highest OAs of 90.50% and 84.93% for 2011 and 2014 respectively, 340
which were significantly greater than those using LP, CP, or FD temporal profiles 341
according to the Kappa z-test analysis (Table 5). However, there was no significant
342
difference when comparing the RF classifications with CP parameters and FD parameters. 343
344
Figs. 4 and 5 are here 345
346
The classification accuracies amongst classifications were also compared by class-wise 347
accuracy assessment (Tables 3 and 4). As shown in the tables, similar trends are found 348
between the MA and the PA and UA when using different predictor variables. Thus, the 349
MA is taken as an example to analyze variations of the class-wise accuracy. From the 350
tables, it can be seen that the MA produced with all variables outperforms that based on 351
LP channels for all crop classes in both of the years. Prominent increases in accuracy 352
were seen for the classes of alfalfa, corn, and tomato in 2011, and for those of hay, tomato, 353
and clover in 2014, with a relatively large margin of 14.31, 13.59, and 13.11 percentage 354
points (Table 3), and 23.04, 16.99, and 13.32 percentage points (Table 4), respectively. 355
Similarly, class-wise mapping accuracies with all variables were found to be consistently 356
superior to those with CP parameters, achieving the largest increase of 16.52 and 14.97 357
percentage points for the classes of clover (2011, Table 3) and corn (2014, Table 4), 358
except for walnut, hay, and wheat in 2011 and wheat in 2014 were classified with greater 360
accuracy, with the largest increase of 6.47 and 10.21 percentage points for corn (2011) 361
and walnut (2014), respectively. 362
363
Tables 3 and 4 are here 364
Table 5 is here 365
366
4.2 Variable importance 367
The RF classifications with all variables were selected to investigate the relative 368
importance of input variables for crop classification. Among the 81 variables used by the 369
RF, the most important 36 variables are listed in descending order in Fig. 6. It is clear 370
from the figure that the variables derived from the CP decomposition are generally 371
important in comparison to those from FD and LP. The CP variables occupy ten and eight 372
places in the first 15 most important variables (including those of the first four and first 373
two) for 2011 and 2014, respectively. In particular, the alpha from the August image was 374
the most important variable in both years, with the largest NVI of 1.26 and 1.01 for 2011
375
and 2014, respectively. The variables derived from the FD decomposition were of 376
intermediate importance, and they accounted for three and four places in the first 15 most 377
important variables for the 2011 and 2014 classifications, respectively. Among the FD 378
variables, the most important one was the double-bounce scatter from the July image in 379
2011 and the June image in 2014 (Fig. 6). Moreover, the LP channels were rated as being 380
the least important with only two and three variables squeezed into the first 15 most 381
Figs. 6 and 7 are here 384
385
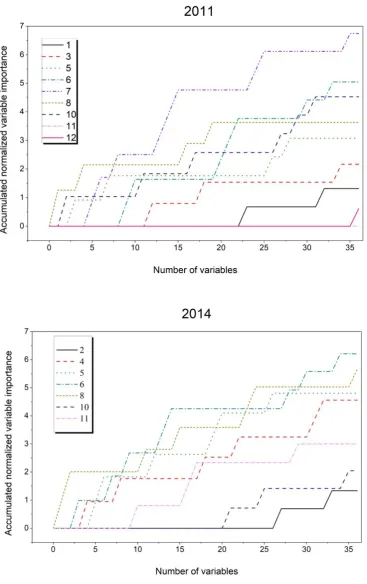
It is interesting to note that the importance of UAVSAR imagery to the RF 386
classification varied greatly across the time-series dataset. The accumulated normalized 387
importance on a monthly basis over both years with the first 36 most important variables 388
is illustrated in Fig. 7. It can be seen from the figure that the summer acquisitions (June 389
and July in 2011 and June and August in 2014) stand out as possessing the greatest 390
importance, and the spring (May in 2011 and April and May in 2014) and autumn 391
(October in 2011) acquisitions have medium importance values. In contrast, the winter 392
acquisitions (January and December in 2011 and February in 2014) were found to have 393
limited influence on crop classification, and no contribution of importance towards 394
classification was observed for the November acquisition in 2011. In summary, 395
acquisitions during the crop growing season (March to October) are far more important 396
than those during the off season (November to the next March) for the UAVSAR-based 397
crop classification over both of the years (Fig. 7). 398
4.3 Optimal combination of SAR 399
The forward image selection results to search for the optimal combination of images 400
(best tradeoff between accuracy and number of images) using the RF for crop 401
classification are shown in Fig. 8. It can be seen from the figure that the August 402
acquisition achieves the highest single date-based overall accuracy (66.23%) for the year 403
2011, followed by those dated July, June, and October, while the overall accuracies 404
yielded by the other acquisitions are relatively low. With the adding of images, the overall 405
accuracies first increased rapidly and then became rather stable (Fig. 8). However, the 406
early-optimal classification accuracy, with an overall accuracy of 88.26%. Similarly, for 408
the year 2014 the August acquisition obtained the best single date-based accuracy 409
(64.12%), and the combination of images dated April, June, August, and October 410
generated an early-optimal classification accuracy of 83.90%. A Kappa z-test further
411
indicated that there was no significant difference between the classification based on the 412
four images and that using all images for the year 2011 (z = 1.62) and 2014 (z = 0.60),
413
respectively. Classification accuracy was not increased substantially when many more 414
images were progressively added to the classifier. 415
416
Fig. 8 is here 417
418
5. Discussion
419
420
5.1 Crop classification accuracy 421
The crop classification accuracies produced in this research were very promising, 422
yielding an overall accuracy of 90.50% and 84.93% for 2011 and 2014, respectively, 423
when all predicator variables were available. This is not trivial in consideration of the 424
relatively large number of crop types being considered. The overall accuracy of 2014 was
425
lower than that of 2011 by about 6 percentage points. This is because July UAVSAR
426
image that can make unique contributions to separation of crop types (Li et al., 2019) was
427
not included in the 2014 time-series (Table 1). It should be noted that the classification 428
accuracy might be improved further by applying speckle reduction algorithms to original 429
outperformed linear polarizations, suggesting that much more valuable information had 432
been provided by the polarimetric parameters. A possible reason for this is that the 433
polarimetric parameters have a close relationship with growth parameters of crops (e.g. 434
plant height, biomass, and leaf area index). However, for the case of dual co-polarized 435
(HH, VV) SAR, polarimetric features (e.g. the correlation coefficient (ρ) and the phase
436
difference (φ) between the co-polarized linear responses), which provide information
437
about the scattering mechanisms (Loosvelt et al., 2012a; Canisius et al., 2018), should be 438
considered for crop classification. In terms of per-class accuracy, we note that accuracies 439
for crop classes with large biomass (tree crops and summer crops) were greater than 91% 440
and 85% for 2011 and 2014, respectively, when making use of all variables (Tables 3 and 441
4). This indicates that L-band microwave with a relatively long wavelength can penetrate 442
into the crop canopy and, thus, capture the unique structural characteristics of those crop 443
types. In contrast, hay and clover, two types of forage crops with relatively small biomass, 444
were classified with mapping accuracies ranging from 63% to 84%. Examining the 445
confusion matrix of the classification (not shown in the paper), we found that the mutual 446
mis-identification of the two classes was the main reason for their lower accuracies. For 447
crops with small biomass, surface scattering was overwhelmingly dominant across the 448
full year with L-band images (Li et al., 2019). That is, the unique structural characteristics 449
of small biomass crops are hard to capture due to the effect of soil surface on the radar 450
response, which is responsible for the mutual misclassification of hay and clover in this 451
research. The C-band SAR with a smaller wavelength that observes ground objects at a 452
different scale might be helpful in discriminating these small-biomass crop types (Skriver, 453
SAR-based classification accuracy might be affected by weather conditions and 455
incidence angle of radar signal (Skriver et al., 1999). Precipitation may raise soil 456
conductivity and freezing decrease dielectric constant of soil, thus altering the intensity 457
of the backscatter response. Fortunately, nearly all the UAVSAR data over both years 458
used in this work were collected under dry conditions with the minimum air temperatures 459
above freezing point (Table 1), suggesting that weather conditions exerted little impact 460
on crop signatures. The impact of incidence angle is also negligible in this research 461
because of the relatively small area of the test site. Besides, such impact tends to be 462
relatively weak with the growth of crop plants (Saich and Borgeaud, 2000). 463
5.2 Variable importance of crop classification 464
The variable importance analysis demonstrated that the polarimetric parameters had a
465
far greater influence than linear polarizations, because that with clear physical meanings,
466
these parameters are sensitive to crop biophysical parameters (e.g. Canisius et al., 2018).
467
Moreover, the relatively large value of variable importance achieved by the CP
468
parameters suggested that they were far more important than the FD parameters. This is
469
mainly due to the fact that CP parameters are more sensitive to structural differences
470
between crop types in comparison with the FD parameters (Dickinson et al., 2013). This 471
finding is consistent with a recent study of Canisius et al. (2018), in which a large 472
correlation between plant height and alpha angle (a parameter from CP decomposition) 473
was observed when monitoring the growth of spring wheat and canola using 474
RADARSAT-2 data. It was also found that the importance of UAVSAR imagery to crop 475
classification varied greatly across the year. As expected, images dated during the peak 476
occurred during July and August (Li et al., 2019). In contrast, several optical image-based 479
studies reported that crop types can be best separated during the green-up and senescence 480
phenological stages (e.g. Wardlow et al., 2007; Pena and Brenning, 2015). This might be 481
attributable to the intrinsic differences between optical sensors and SAR. The optical 482
reflectance observed in the visible spectral domain was found to be sensitive to vegetation 483
with low leaf area index (LAI) (Prevot et al., 2003). As a result, crop types can be 484
discriminated with optical images dated during the green-up and senescence stages 485
(Wardlow et al., 2007). In contrast, SAR sensors tend to capture ground targets’ structural 486
characteristics (e.g. height, bulk amount, and texture) which are distinctive amongst crop 487
classes during the peak biomass stage. 488
5.3 Optimal combination of SAR data 489
In this research, a combination of only four acquisitions (from May, July, August, and 490
October for 2011 and April, Jun, August, and October for 2014) achieved near-optimal 491
crop classification accuracy. This means that, in addition to the summer acquisitions (June, 492
July, and August) as mentioned above, images dated during green-up and senescence 493
stages also provided useful information for crop classification. By examining the 494
confusion matrices (not shown here), two fruit crops (almond and walnut) as well as 495
winter wheat and grass were found to be better discriminated from each other when 496
adding the spring acquisitions (May for 2011 and April for 2014) into the image 497
combination. This is mainly attributed to the relatively large difference in canopy 498
structure between almond and walnut as well as winter wheat and grass in spring, 499
resulting from different bloom time (March to mid-April for almond and mid-April to 500
May for walnut) and germination time (last autumn for winter wheat and spring for grass), 501
contribute to the separation of corn from the other two summer crops (sunflower and 503
tomato). This is due to the distinctive canopy structure of corn in contrast to sunflower 504
and tomato in Autumn, caused by different harvest time (September-November for corn 505
and July-September for sunflower and tomato) (Li et al., 2019). 506
507
6. Summary and conclusion
508
509
In this research, the capability of time-series L-band UAVSAR for crop classification 510
was explored using the RF algorithm. The polarimetric parameters from both Cloude– 511
Pottier (CP) and Freeman–Durden (FD) decompositions were superior to linear 512
polarizations with respect to crop discrimination. The synergistic use of all variables 513
further produced an overall accuracy of 90.50% and 84.93% for 2011 and 2014, 514
respectively, increasing about 8 percentage points in comparison with those using linear 515
polarizations alone. Polarimetric parameters played a more important role than linear 516
polarizations in crop discrimination, and the CP parameters were found to be much more 517
important than the FD parameters. The most important acquisitions were the images 518
during the peak biomass stage (July and August), and the spring (April and May) and 519
autumn (October) acquisitions were also useful for crop classification as they respectively 520
provided unique information for discriminating fruit crops (almond and walnut) as well 521
as summer crops (corn as well as sunflower and tomato). Hence, a combination of only 522
four images from May, July, August, and October for 2011 and April, June, August, and 523
October for 2014 yielded nearly-optimal classification results, achieving an overall 524
This research highlights the unique value of multitemporal fully-polarimetric SAR data 527
in crop discrimination over agricultural regions with diverse crop types. The results 528
demonstrate that a relatively high classification accuracy (>84%) of agricultural crops 529
can be expected with only a few polarimetric SAR acquisitions. In light of the promising 530
crop classification accuracies acquired in this research, it becomes increasingly viable to 531
attain accurate and up-to-date crops inventories based solely on polarimetric L-band SAR 532
data, which provides a cost-effective alternative to field survey of crops over large areas 533
(e.g. nation-wide scale). 534
535
Acknowledgements
536
537
This research was co-funded by the National Natural Science Foundation of China 538
(41301465), the National Key Research and Development Program of China 539
(2017YFB0503602), and the Jilin Province Science and Technology Development 540
Program (20170520087JH). We thank Alaska Satellite Facility for the supply of 541
UAVSAR data employed in this work. 542
543
References
544
545
Bargiel, D., 2017. A new method for crop classification combining time series of radar images and crop
546
phenology information. Remote Sens. Environ. 198, 369-383.
547
Belgiu, M., Dragut, L., 2016. Random forests in remote sensing: a review of applications and future
548
directions. ISPRS J. Photogramm. Remote Sens. 114 (6), 24-31.
549
Boryan, C., Yang, Z.W., Mueller, R., Craig, M., 2011. Monitoring US agriculture: the US Department of
550
Agriculture, National Agricultural Statistics Service, Cropland Data Layer Program. Geocarto Int. 26 (5),
551
341-358.
552
Breiman, L., 2001. Random forests. Mach Learn. 45 (1), 5-32.
Canisius, F., Shang, J., Liu, J., Huang, X., Ma, B., Jiao, X., Geng, X., Kovacs, J.M., Walters, D., 2018.
554
Tracking crop phenological development using multi-temporal polarimetric Radarsat-2 Data. Remote
555
Sens. Environ. 210 (6), 508–518.
556
Chapman, B., Hensley, S., Lou, Y., 2011. The JPL UAVSAR. ASF News & Notes. 7(1) Retrieved from.
557
https://www.asf.alaska.edu/news-notes/7-1/jpl-uavsar/.
558
Cloude, S.R., Pottier, E., 1997. An entropy based classification scheme for land applications of polarimetric
559
SAR. IEEE Trans. Geosci. Remote Sens. 35 (1), 68-78.
560
Congalton, R.G., Green, K.G., 1999. Assessing the Accuracy of Remotely Sensed Data:Principles and
561
Practices. Lewis Publishers, Boca Raton, Florida.
562
Dickinson, C., Siqueira, P., Clewley, D., Lucas, R., 2013. Classification of forest composition using
563
polarimetric decomposition in multiple landscapes. Remote Sens. Environ. 131, 206-214.
564
Ding, Z., Zeng, T., Dong, F., Liu, L., Yang, W., Long, T. 2013. An improved PolSAR image speckle
565
reduction algorithm based on structural judgment and hybrid four-component polarimetric
566
decomposition. IEEE Trans. Geosci. Remote Sens. 51 (8), 4438-4449.
567
Duro, D.C., Franklin, S.E., Dube, M.G., 2012. A comparison of pixel-based and object-based image
568
analysis with selected machine learning algorithms for the classification of agricultural landscapes using
569
SPOT-5 HRG imagery. Remote Sens. Environ. 118, 259-272.
570
Foody, G.M., 2004. Thematic map comparison: Evaluating the statistical significance of differences in
571
classification accuracy. Photogram. Eng. Remote Sens.70 (5), 627-633.
572
Freeman, A., Durden, S.L., 1998. A three-component scattering model for polarimetric SAR data. IEEE
573
Trans. Geosci. Remote Sens. 36 (3), 963-973.
574
Gislason, P.O., Benediktsson, J.A., Sveinsson, J.R., 2006. Random Forests for land cover classification.
575
Pattern Recogn. Lett. 27 (4), 294-300.
576
Hensley, S., Zebker, H., Jones, C., Michel, T., Muellerschoen, R., Chapman, B., 2009. First deformation
577
results using theNASA/JPL UAVSAR instrument. 2nd Asian-Pacific Conference on Synthetic
578
ApertureRadar (pp. 1051-1055). Xi'an Shanxi, China: IEEE.
579
Jiao, X.F., Kovacs, J.M., Shang, J.L., McNairn, H., Walters, D., Ma, B.L., Geng, X.Y., 2014.
Object-580
oriented crop mapping and monitoring using multi-temporal polarimetric RADARSAT-2 data. ISPRS J.
581
Photogram. Rem. Sens. 96, 38-46.
582
Lee, J.S., Pottier, E., 2009. Polarimetric radar imaging from basics to applications. New York: CRC Press.
583
Li, H.P., Zhang, C., Zhang, S.Q., Atkinson, P.M., 2019. Full year crop monitoring and separability
584
assessment with fully-polarimetric L-band UAVSAR: a case study in the Sacramento Valley, California.
585
Int. J. Appl. Earth Obs. Geoinf. 74 (02), 45-56.
586
Lin, Y.C., Sarabandi, K., 1999. A Monte Carlo coherent scattering model for forest canopies using
fractal-587
generated trees. IEEE Trans. Geosci. Remote Sens. 37 (1), 440-451.
588
Liu, C., Shang, J.L., Vachon, P.W., McNairn, H., 2013. Multiyear Crop Monitoring Using Polarimetric
589
RADARSAT-2 Data. IEEE Trans. Geosci. Remote Sens. 51 (4), 2227–2240.
Loosvelt, L., Peters, J., Skriver, H., De Baets, B., Verhoest, N.E., 2012a. Impact of reducing polarimetric
591
sar input on the uncertainty of crop classifications based on the random forests algorithm. IEEE Trans.
592
Geosci. Remote Sensing 50 (10), 4185–4200.
593
Loosvelt, L., Peters, J., Skriver, H., Lievens, H., Coillie, F.M.B.V., Baets, B.D., Verhoest, N.E.C., 2012b.
594
Random Forests as a tool for estimating uncertainty at pixel-level in SAR image classification. Int. J.
595
Appl. Earth Obs. Geoinf. 19, 173–184.
596
McNairn, H., Brisco, B., 2004. The application of C-band polarimetric SAR for agriculture: a review. Can.
597
J. Remote. Sens. 30 (3), 525–542.
598
McNairn, H., Shang, J.L., Jiao, X.F., Champagne, C., 2009. The Contribution of ALOS PALSAR
599
Multipolarization and Polarimetric Data to Crop Classification. IEEE Trans. Geosci. Remote Sens. 47
600
(12), 3981-3992.
601
National Oceanic and Atmospheric Administration, National Centers for Environmental Information
602
(NOAA-NCEI),2011. Local Climatological Data (LCD),Sacramento Executive Airport,Sacramento
603
County, CA.National Environmental Satellite, Data, and Information Service. Retrieved February 3,
604
2018,from.https://www.ncdc.noaa.gov/cdo-web/datasets/LCD/stations/WBAN:23232/detail.
605
Ndikumana, E., Minh, D.H.T., Baghdadi, N., Courault, D., Hossard, L., 2018. Deep recurrent neural
606
network for agricultural classification using multitemporal SAR sentinel-1 for camargue, France. Remote
607
Sens. 10 (8), 1217.
608
Nguyen, D.B., Gruber, A., Wagner, W. 2016. Mapping rice extent and cropping scheme in the Mekong
609
Delta using Sentinel-1A data. Remote Sens. Lett. 12(7), 1209-1218.
610
Ozdogan, M., Woodcock, C.E., 2006. Resolution dependent errors in remote sensing of cultivated areas.
611
Remote Sens. Environ. 103 (2), 203-217.
612
Pena, M.A., Brenning, A., 2015. Assessing fruit-tree crop classification from Landsat-8 time series for the
613
Maipo Valley, Chile. Remote Sens. Environ. 171, 234-244.
614
Pena-Barragan, J.M., Ngugi, M.K., Plant, R.E., Six, J., 2011. Object-based crop identification using
615
multiple vegetation indices, textural features and crop phenology. Remote Sens. Environ. 115 (6),
1301-616
1316.
617
Prevot, L., Chauki, H., Troufleau, D., Weiss, M., Baret, F., Brisson, N., 2003. Assimilating optical and
618
radar data into the STICS crop model for wheat. Agronomie. 23 (4), 297-303.
619
Saich, P., Borgeaud, M., 2000. Interpreting ERS SAR signatures of agricultural crops in Flevoland,
1993-620
1996. IEEE Trans. Geosci. Remote Sens. 38 (2), 651-657.
621
Silva, W.F., Rudorff, B.F.T., Formaggio, A.R., Paradella, W.R., Mura, J.C., 2009. Discrimination of
622
agricultural crops in a tropical semi-arid region of Brazil based on L-band polarimetric airborne SAR
623
data. ISPRS J. Photogramm. Remote Sens. 64 (5), 458–463.
624
Skriver, H., 2012.Crop classification by multi-temporal C- and L-band single and dual polarization, and
625
fully polarimetric SAR. IEEE Trans. Geosci. Remote Sens. 50 (6), 2138–2149.
626
Skriver, H., Svendsen, M.T., Thomsen, A.G., 1999. Multitemporal C- and L-band polarimetric signatures
627
of crops. IEEE Trans. Geosci. Remote Sens. 37 (5), 2413-2429.
Sonobe, R., Tani, H., Wang, X.F., Kobayashi, N., Shimamura, H., 2014. Random forest classification of
629
crop type using multi- temporal TerraSAR- X dual- polarimetric data. Remote Sens Lett. 5 (2), 157-164.
630
Sun, W.X., Liang, S.L., Xu, G., Fang, H.L., Dickinson, R., 2008. Mapping plant functional types from
631
MODIS data using multisource evidential reasoning. Remote Sens. Environ. 112 (3), 1010-1024.
632
Thenkabail, P.S., Knox, J.W., Ozdogan, M., Gumma, M.K., Congalton, R.G., Wu, Z.T., Milesi, C., Finkral,
633
A., Marshall, M., Mariotto, I., You, S.C., Giri, C., Nagler, P., 2012. Assessing Future Risks to
634
Agricultural Productivity, Water Resources and Food Security: How Can Remote Sensing Help?
635
Photogram. Eng. Remote Sens.78 (8), 773-782.
636
Thornton, P.K., Bowen, W.T., Ravelo, A.C., Wilkens, P.W., Farmer, G., Brock, J., Brink, J.E., 1997.
637
Estimating millet production for famine early warning: An application of crop simulation modelling
638
using satellite and ground-based data in Burkina Faso. Agric. For. Meteorol. 83 (1-2), 95-112.
639
Tso, B., Mather, P.M., 1999. Crop discrimination using multi-temporal SAR imagery. Int. J. Remote Sens.
640
20 (12), 2443–2460.
641
Wang, D., Lin, H., Chen, J., Zhang, Y., 2010. Application of multi-temporal ENVISAT ASAR data to
642
agricultural area mapping in the Pearl River Delta. Int. J. Remote Sens. 31 (6), 1555–1572.
643
Wardlow, B.D., Egbert, S.L., 2008. Large-area crop mapping using time-series MODIS 250 m NDVI data:
644
An assessment for the US Central Great Plains. Remote Sens. Environ. 112 (3), 1096-1116.
645
Wardlow, B.D., Egbert, S.L., Kastens, J.H., 2007. Analysis of time-series MODIS 250 m vegetation index
646
data for crop classification in the US Central Great Plains. Remote Sens. Environ. 108 (3), 290-310.
647
Whelen, T., Siqueira, P., 2017. Use of time-series L-band UAVSAR data for the classification of
648
agricultural fields in the San Joaquin Valley. Remote Sens. Environ. 193, 216-224.
649
Zheng, B.J., Myint, S.W., Thenkabail, P.S., Aggarwal, R.M., 2015. A support vector machine to identify
650
irrigated crop types using time-series Landsat NDVI data. Int. J. Appl. Earth Obs. Geoinf.34, 103-112.
651
Zhong, L.H., Gong, P., Biging, G.S., 2012. Phenology-based Crop Classification Algorithm and its
652
Implications on Agricultural Water Use Assessments in California's Central Valley. Photogram. Eng.
653
Remote Sens.78 (8), 799-813.
Fig. 2. Flowchart of processing and analysis steps in this work. (A) data pre-processing steps, (B)
Fig. 3. False colour map of the UAVSAR dated on (a) 29 August 2011 (bands VV, HV, HH) and
(c) 14 August 2014 (bands VV, HV, HH), and the manually labeled ground reference data in (b)
2011 and (d) 2014.
(a) (b)
Fig. 4. Crop classification maps in 2011 produced with the Random Forest algorithm using the linear
polarizations (LP), Cloude-Pottier parameters (CP), Freeman-Durden parameters (FD), and all
predicator variables (All).
LP CP
FD All
Alfalfa Grass
Walnut
Almond Hay Clover
Fig. 5. Crop classification maps in 2014 produced with the Random Forest algorithm using the
linear polarizations (LP), Cloude-Pottier parameters (CP), Freeman-Durden parameters (FD), and
all predicator variables (All) in 2014.
LP CP
FD All
Alfalfa Grass
Walnut
Almond Hay Clover
with bars in green, pink, and violet indicating the variables from the linear polarizations, CP
decomposition, and FD decomposition, respectively. A variable name consists of three parts, with
the prefix, centre, and suffix respectively indicating date of acquisition, data source, and a certain
variable (abbreviations ent, anis, alp, odd, vol, and dbl denote the polarimetric parameters of entropy,
[image:39.595.102.487.86.587.2]2014. Note that numbers in the legend indicate acquisition dates. For example, “1” in the upper
[image:40.595.115.483.87.672.2]Fig. 8. The RF overall accuracies for the optimal combination of images produced by a forward
image selection procedure using all predicator variables. Note that numbers in the figure denote combinations of images, for example “8,7” represents the combination of images dated August and
July (i.e. the combination achieves the greatest OA), and so on; the markers indicate the
Table 1
UAVSAR imagery and the weather conditions at the time of image acquisition. All images were
acquired in PolSAR (polarimetric SAR) mode, and there was no snow at the date of acquisition.
Year Date Local time Pcum (mm) Tmax (℃) Tmin (℃)
2011 2011.01.10 20h59 0 8.3 -2.8
2011.03.30 20h00 0 26.7 11.7
2011.05.12 22h22 0 26.1 9.4
2011.06.16 13h04 0 31.1 14.4
2011.07.20 18h54 0 35.6 15.0
2011.08.29 20h21 0 34.4 14.4
2011.10.03 22h02 0.5 20.6 10.0
2011.11.02 22h45 0 22.8 5.6
2011.12.07 20h20 0 14.4 -0.6
2014 2014.02.12 19h15 0 17.8 7.2
2014.04.02 19h01 0 16.1 6.1
2014.05.15 18h43 0 36.1 13.9
2014.06.16 18h52 0 24.4 13.3
2014.08.14 22h44 0 32.2 16.1
2014.10.06 20h17 0 35.6 13.9
2014.11.13 21h11 6.6 17.2 12.8
Note that Pcum denotes daily precipitation, and Tmax and Tmin denote daily maximum and minimum air temperatures,
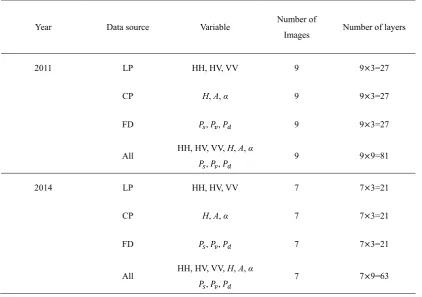
[image:42.595.92.504.228.631.2]Table 2
Summary of predictator variables derived from UAVSAR for RF classification. Note that
abbreviations are explained in the text.
Year Data source Variable Number of
Images Number of layers
2011 LP HH, HV, VV 9 9×3=27
CP H, A, α 9 9×3=27
FD 𝑃𝑠, 𝑃𝑣, 𝑃𝑑 9 9×3=27
All HH, HV, VV, H, A, α 𝑃𝑠, 𝑃𝑣, 𝑃𝑑
9 9×9=81
2014 LP HH, HV, VV 7 7×3=21
CP H, A, α 7 7×3=21
FD 𝑃𝑠, 𝑃𝑣, 𝑃𝑑 7 7×3=21
All HH, HV, VV, H, A, α 𝑃𝑠, 𝑃𝑣, 𝑃𝑑