International Journal of Computer Applications (0975 – 8887) Volume 181 – No. 18, September 2018
OLAP-based Decision Support System for Business
Data Analysis
Md. Geaur Rahman
Bangladesh Agricultural
University
Mymensingh, Bangladesh
Zannatul Ferdaus
Bangladesh Bank
Mymensingh, Bangladesh
Md. Nobir Uddin
Ministry of ICT
Dhaka, Bangladesh
ABSTRACT
Nowadays automated data collection tools and mature database technology lead to tremendous amounts of data stored in databases, data warehouses and other information repositories in business organizations. In this paper, a novel approach of developing a decision support system using on-line analytical processing (OLAP) is presented. The OLAP application is optimal for data queries that do not change data. The system database is designed to promote: heavy indexing to improve query performance, denormalisation of the database to satisfy common query requirements and improve query response times, and use of a star-snowflake schema to organize the data within the database. The existing partitioning strategy is used to partition the fact table by time into equal segments, different-size segments and on different dimension of data warehouse, which provide the good query performance, optimize hardware performance, and simplify the management of the data warehouse by reducing the volume of data to satisfy a query. Entity-relation modeling is used to create a single complex model, which proven effective in creating efficient online transaction processing systems. In this system, cubes are used to organize and summarize data for efficient analytical querying. In addition, an enterprise information system model has also been presented in this paper in order to optimize the utilization of operational data for use strategically. The proposed system is evaluated on the cube data for the Rajshahi and Khulna regions for ten years from 1994 to 2003. Experimental results indicate the effectiveness of the proposed OLAP based Decision Support System.
Keywords
Data Analytics, Dimension data, DSS, Fact Table, OLAP
1.
INTRODUCTION
Nowadays business organizations can store a huge amount of data into databases, data warehouses and other information repositories due to the availability of automated data collection tools and mature database technology [1, 2, 3, 4]. These huge data can be used to extract interesting information for taking better decisions. Decision Support System (DSS) is interactive systems that enable decision makers to use databases and models on a computer in order to solve ill-structured problems [5, 6]. One reason, cited in the literature for management’s frustration with Managerial Information System (MIS), is the limited support since it provides top management for
decision-making. DSS advances the capabilities of MIS by assisting management in making decisions [7, 8, 9, 10]. It is actually a continually evolving model that relies heavily on operation research. The original term is simple: Decision-emphasizes decision making in problem situations, not information processing, or reporting. Support- requires computer aided decision situation with enough “structure” to permit computer support. System-accentuates the integrated nature of problem solving tool that combines “man,” machine, and decision environment [11, 12]. The system database is designed to promote: heavy indexing to improve query performance, denormalisation of the database to satisfy common query requirements and improve query response times, and use of a star-snowflake schema to organize the data within the database. The existing partitioning strategy is used to partition the fact table by time into equal segments, different-size segments and on different dimension of data warehouse, which provide the good query performance, optimize hardware performance, and simplify the management of the data warehouse by reducing the volume of data to satisfy a query [13, 14]. Therefore, a partitioning strategy is used to enable the OLAP tool to suggest the best decisions.
2.
BACKGROUND STUDY
The essential ideas about DSS Architecture and Cubes of Transaction fact table are discussed in this section.
2.1 DSS Architecture
In DSS, a complete Data Warehouse (DW) architecture that encompasses the major processes including load and extracts data, clean and transform data, backup and archive, and directs and manages queries that constitute the DW as shown in Figure 1 [11, 15, 16]. The Load, Warehouse and Query manager perform these processes, where the Load manager extracts data from any operational database (Microsoft SQL Server 2000) and others externals data sources (Hard Disk/Removable Storage), and loan the extracted data into temporary data store for DW. Warehouse manager analysis the data to perform consistency and referential integrity checks and create indexes, partition view, business view and also provides backup and archives processes.
International Journal of Computer Applications (0975 – 8887) Volume 181 – No. 18, September 2018
Fig 2: Cube Structure
2.2 Cubes and Structures
In this paper Cube is used and it is the main objects in online analytic processing (OLAP). Cube is a technology that provides fast access to data in a data warehouse [18, 19, 20].
A cube is a set of data that is usually constructed from a subset of a data warehouse and is organized and summarized into a multidimensional structure defined by a set of dimension and measures [10, 17, 21]. A cube provides an easy-to-use mechanism for querying data with quick and uniform response times. End users use client applications to connect to an analysis server and query the cubes on the server.
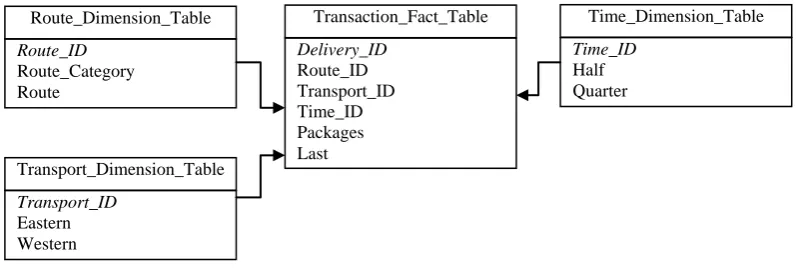
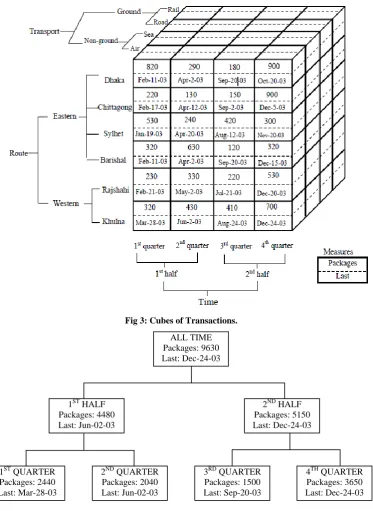
A cube has been defined by the measures and dimensions that it contains. Figure 2 and Figure 3 show the Dimension structures and the transaction cube, which contains two measures namely, Packages and Last. The cube has three dimensions namely, Route, Transport, and Time. If we want to analyze quarterly transports that arrived by air from the Eastern and Western, the end we could issue the appropriate query on the cube that retrieve the following dataset. The Packages measure represents the number of transported packages, and it aggregates by the sum function [22, 23, 24].
The Last measure represents the date of receipt, and it aggregates by the Max function. The Route dimension represents the means by which the transports reach their destination. The transport dimension represents the category of transports. The Time dimension represents the quarters and halves of a single year. Routes dimension represents a path by which the transaction and transport made [11, 12].
3.
METHODOLOGY
In this section the basic ideas about dimensions and partitioning and about the fact table of business transactions are discussed.
3.1 Dimensions
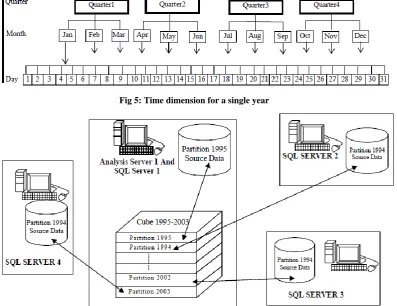
OLAP is suitable mostly for data which can be categorized – grouped by categories. The categorical view of data should be also the main interest of the data analysis. Example of categories might be: color, department, location or even a date. The categories are called dimensions. A dimension is a structural attribute of cubes. Dimensions are organized as hierarchies of categories and levels that describe data in the fact table [7, 17, 18, 21]. These categories and levels describe similar sets of members upon which the user wants to make an analysis. Figure 4 shows the structure of Time dimension. Route_Dimension_Table
Route_ID Route_Category Route
Transport_Dimension_Table
Transport_ID Eastern Western
Time_Dimension_Table
Time_ID Half Quarter Transaction_Fact_Table
Fig 3: Cubes of Transactions.
Fig 4: Time Dimension Structure.
In Figure 5, the Time dimension for a single year is presented. single year is illustrated in Figure 5. 1ST QUARTER
Packages: 2440 Last: Mar-28-03
2ND QUARTER Packages: 2040 Last: Jun-02-03
3RD QUARTER Packages: 1500 Last: Sep-20-03
4TH QUARTER Packages: 3650 Last: Dec-24-03 1ST HALF
Packages: 4480 Last: Jun-02-03
2ND HALF Packages: 5150 Last: Dec-24-03 ALL TIME
International Journal of Computer Applications (0975 – 8887) Volume 181 – No. 18, September 2018
Fig 5: Time dimension for a single year
Fig 6: Partitioning the cube data
The fact table in a data warehouse could be partitioned into multiple smaller sub tables or partitions. Partitions allow the source data and aggregate data of a cube to be distributed among multiple server computers [4, 11, 12, 18]. Each partition in a cube can have a different data source. These data sources can reference relational databases on various computers. In addition, aggregate data of each partition can be stored on the Analysis server computer where the partition is defined; the following Figure 6 shows how a four-partition cube can distribute its source data and aggregation data among five server computers.
The activities of definition, storage design, processing, and querying are performed during four distinct time periods. Each partition has a data source, which can be the same as or different from the data source of the partition's cube.
If the same data source is used, the partition and the cube do not need to have the same fact table. If a different data source is used, it must reference a database that contains a set of tables
that are essentially the same as those in the cube's schema.
In Cube 1995-2003 and its four partitions are defined on Analysis Server 1. The data sources of the partitions specify the locations of the source data of the partitions [3, 21]:
The source data for Partition 1994 is stored on SQL Server 1, which is installed on the same computer as Analysis Server 1.
The source data for Partition 1994 is stored on SQL Server 2.
The source data for Partition 2002 is stored on SQL Server 3. [image:5.595.103.501.129.435.2]Fig 7: Snapshot of a Cube data for Rajshahi Region
Fig 8: Snapshot of a Cube data for Khulna Region
Once the partitions of the business transactions are found, the OLAP tools are used to identify the interesting pattern for taking better decisions for the organizations. By using the historical data OLAP tools then answer questions like why is this happening, what if these trends continue, what will happen next (predict), and what is the best outcome that can happen
International Journal of Computer Applications (0975 – 8887) Volume 181 – No. 18, September 2018
demonstrate the effectiveness of our proposed OLAP base DSS for analyzing business data in order to take better decisions.
In future, different data mining techniques will be used for developing DSS so that the interesting hidden patterns can be extracted efficiently from the large data sets and thereby, better decisions can be taken with confidence by the top level management.
6.
REFERENCES
[1] Rahman M. G. and Islam M. Z. (2016a): “Discretization of Continuous Attributes Through Low Frequency Numerical Values and Attribute Interdependency”, Expert Systems with Applications, Vol. 45, pp. 410 – 423.
[2] Rahman M. G. and Islam M. Z. (2016b): “Missing Value Imputation using a Fuzzy Clustering based EM Approach”, Knowledge and Information Systems, Vol. 46 (2), pp. 389 – 422.
[3] Rahman M. G. and Islam M. Z. (2011): “A Decision Tree-based Missing Value Imputation Technique for Data Pre-processing”, In Proc. of the Ninth Australasian Data Mining Conference (AusDM 11), Ballarat, Australia. December 01 – December 02, 2011, CRPIT, 121, pp. 41-50.
[4] Rahman M. G. (2018): “Reframing in Clustering: An Introductory Survey”, International Journal of Computer. 30(1): 32-42.
[5] Keen, P. (1980): "Decision support systems: a research perspective", Cambridge, Mass.: Center for Information Systems Research, Alfred P. Sloan School of Management.
[6] Keen, P. G. W. (1978): “Decision support systems: an organizational perspective”. Reading, Mass., Addison-Wesley Pub. Co. ISBN 0-201-03667-3.
[7] Henk, G. (1987): “Expert systems and artificial intelligence in decision support systems”, proceedings of the Second Mini Euroconference, Lunteren, The Netherlands, 17–20 November 1985. Springer, 1987. ISBN 90-277-2437-7. p.1-2.
[8] Power, D. J. (1996): “What is a DSS?”, The On-Line Executive Journal for Data-Intensive Decision Support 1(3).
[9] Power, D. J. (2002): “Decision support systems: concepts and resources for managers”, Westport, Conn., Quorum Books.
[10] Sprague, R. H. and E. D. Carlson (1982): “Building effective decision support systems”, Englewood Cliffs, N.J., Prentice-Hall. ISBN 0-13-086215-0.
[11] Anahory, S. and Murray, D. (2001): “Data Warehouse in the Real World-A practical Guide for Building Decision Support System”, Pearson Education Asia, New Delhi.
[12] Award, E. M. (1999): “System Analysis and Design”, 2nd Edition, Galgotia Publications Ltd, New Delhi.
[13] Aptech Worldwide (2010): Implementing RDBMS Concepts with SQL Server 2000 -Aptech Worldwide.
[14] Efraim, T., Aronson, J. E. and Liang, T. P. (2008): “Decision Support Systems and Intelligent Systems”, p. 574.
[15] Adriaans, P. and Zantinge, D. (1999): “Data Mining”, Addison-Wesley, New Delhi.
[16] Gachet, A. (2004): “Building Model-Driven Decision Support Systems with Dicodess”, Zurich, VDF.
[17] OLAP (2017): Microsoft Analysis Server and OLAP Online Manual.
[18] Silberschatz, A., Korth, H. F. and Sudarshan, S. (1997): “Database System Concepts”, 3rd
Edition, The McGraw-Hill Book Companies, New Delhi.
[19] Sprague, R. (1980): "A Framework for the Development of Decision Support Systems." MIS Quarterly. Vol. 4, No. 4, pp.1-25.
[20] Wright, A. and Sittig, D. (2008): "A framework and model for evaluating clinical decision support architectures ", Journal of Biomedical Informatics. 41: 982–990.
[21] Rahman M. G., Molla M. K. I., Siddique A. R. S. A. and Debnath R. C. (2005): “Developing A Decision Support System Using On-Line Analytical Processing (OLAP)”, In proc. of the 8th IEEE International Conference on Computer and Information Technology, Dhaka, Bangladesh, 28-30 December, 2005, vol no 8, pp. 293-298.
[22] Pressman, R. S. (1997): “Software Engineering - A Practitioner’s Approach”, 4th
Edition, McGraw-Hill Book Companies, New Delhi.
[23] Rahman M. G. and Islam M. Z. (2014): “FIMUS: A Framework for Imputing Missing Values Using Co-Appearance, Correlation and Similarity Analysis”, Knowledge-Based Systems, Vol. 56, pp. 311 – 327.
[24] Rahman M. G. and Islam M. Z. (2013): “Missing Value Imputation Using Decision Trees and Decision Forests by Splitting and Merging Records: Two Novel Techniques”, Knowledge-Based Systems, Vol. 53, pp. 51 – 65.
[25] Han, J., Kamber, M., & Pei, J. (2006): “Data mining: concepts and techniques”. Morgan kaufmann.
![Fig 1: Architecture of a DSS [2]](https://thumb-us.123doks.com/thumbv2/123dok_us/9294777.426640/2.595.114.490.75.281/fig-architecture-of-a-dss.webp)