Classification and Selection of Prototyping Activities for
Interaction Design
Stefano Filippi, Daniela Barattin
Product Innovation Research Group, Electrical, Management and Mechanical Engineering Department, University of Udine, Udine, Italy
Email: [email protected]
Received April 19, 2012; revised May 28, 2012; accepted June 29, 2012
ABSTRACT
Because of the evolution of markets and technologies, prototyping concerns should be kept updated almost day by day. Moreover, user centered design moves the focus towards interaction issues. Prototyping activities matching such char- acteristics are already available, but they are not so diffused in the industrial domain. This is due to many reasons; an important one is that a rigorous classification of them is missing, as well as an effective helping tool for the selection of the best activities, given the design context. The research described in this paper aims at defining a new classification of prototyping activities, as well as at developing a selection algorithm to choose the best ones in an automatic way. These goals are pursued by defining a set of characteristics that allow describing accurately the prototyping activities. The resulting classification is made by five classes, based on eighteen characteristics. This classification is exploited by the first release of an algorithm for the selection of the best activities, chosen in order to satisfy design situations described thanks to a different set of eleven indices. Five experiences in the field have been used up to now as a starting point for validating the research outcomes.
Keywords: Prototyping Activities; Interaction Design; Virtual Reality; Augmented Reality
1. Introduction
Current mechatronic devices show large amount of hi- tech components, as well as an increasing number of functionalities. For this reason, interaction issues become more and more important, and users should be the center of the development process. Moreover, competition is increasing day by day and this implies that costs and time must be minimized. All of this drives to the need of re- vising the classic development processes, by considering more than ever the central role of interaction design tools and methods. Anyway, this is not enough; together with this attention to usability issues, some care must be taken about prototyping activities. Usability evaluation should be performed more than once during the development process, in order to validate the product interaction with users and environment.
Prototyping methods and tools focused on usability issues have evolved as well, mainly thanks to the virtual reality concept. It allows modeling and testing product functionalities at much lower costs than before; anyway, the absence of realness remains with no doubt a big drawback. In order to partially solve this problem, mixed approaches have been developed. Real and virtual com- ponents are used together during prototyping activities. The exploitation of all of this in the industrial field is quite limited at the moment, because of costs and im-
plementation difficulties. Moreover, industries and re- search laboratories are somehow confused by the huge amount of methods and tools on the market, and the ab- sence of a real classification to be exploited in selecting the most suitable prototyping activities does not help.
For these reasons, the research described in this paper has two main goals. First, it aims at generating a new classification of prototyping activities by defining real, measurable dimensions. Then, the development of a se- lection algorithm takes place. This algorithm allows se- lecting the best activities automatically, given the de- scription of the scenario where the usability evaluation will take place.
The paper runs as follows. After some background about interaction design, virtual/augmented reality, and existing prototyping activities, the definition of the di- mensions used to classify these activities is described. Then, all the steps up to the generation of the selection algorithm are presented. Next paragraph deals with some experiences in the field, used as a starting point for the validation of the proposed approach to interaction proto- typing. Some conclusions and suggestions for future work close the paper.
2. Background
this research: interaction design and virtual/augmented reality. The first one refers to the application field where the methods and tools of the second one are exploited.
2.1. Interaction Design
Interaction design—ID—focuses on the correct interpre- tation and implementation of the user-product dialogue [1]. It allows generating products ready to be easily and intuitively used by the most of the users, and accepted since the beginning, thus avoiding soft reliability prob- lems [2]. It is quite young as a research field, but already full of methods and tools based on the usability concept. As the ISO 9241 standard says, usability is “the effec- tiveness, efficiency and satisfaction with which specified users achieve specified goals in particular environments” [3]. Specifically, ID methods and tools focus on user satisfaction because new definitions of product quality are heavily based on it. The first developed tools were collections of principles and guidelines, mainly used for usability evaluation activities. Some examples of them are the seven dialogic ISO principles [4], the eight Shnei- derman’s golden rules [4], the ten Nielsen’s heuristics [5] and the interaction paradigms of Dix, Finlay, Abowd and Beale [6].
The most interesting methods couple the analysis of the users’ needs with tools to generate design solutions starting from them. Some examples are the interdiscipli- nary approach with a user-system focus [2], the user ac- tion framework [7] and the intent method [8].
2.2. Virtual/Augmented Reality
Virtual reality—VR—is a powerful tool to simulate the presence of a product and the interaction with it in a vir- tual environment [9]. Many applications appeared on the market implementing these characteristics. These appli- cations satisfy the requirements coming from different domains, from videogames to mobile communications [10], to industrial and engineering design [11], up to fur- nishing configuration [12], etc. Directness and interactiv- ity are the most interesting characteristics of VR. Ele- ments inside the virtual environment can be easily cus- tomized by changing locations, orientations, colors, etc.; moreover, in particular situations the real interaction be- tween users and product models is allowed.
The technological innovations enhance the realness of the interaction with virtual environments. For example, head-mounted displays give the users a real 3D view of the product models and environments; haptic devices as data gloves allow advanced feedbacks [13].
Recently, some industries, especially those ones re- lated to furnishings, clothing, etc., have been looking for something that would avoid the inner problem of VR, the absence of realness (unless exploiting very expensive
technologies). So, augmented reality—AR—has come to the stage. AR, defined by Azuma as “the real-time com- bination of virtual and real elements”, allows integrating virtual components, images, 3D models, etc., in a real scene, generating in this way new interaction capabilities [14]. This approach presents many advantages if com- pared to VR: it manages a continuous visual reference to the real users’ context, avoiding any sensation of getting lost; it is very intuitive and user friendly to adopt, be- cause user’s skill and/or knowledge of CAD applications are not required; by using it, users are allowed catching their goals in a faster and more satisfactory way; the pro- duct models integrated in the real world can maintain full interactivity with the users; finally, AR applications are often very cheap, because pieces of software, libraries, etc. can be found over the web free of charge.
Other approaches than VR and AR are used in proto- typing activities focused on usability evaluation. Espe- cially when dealing with small products, because of tech- nological limitations, images are projected on physical supports. The shape of these supports is similar or equal to the final product one and thanks to them the interac- tion gains in realness. All of this is named mixed reality [15]. The augmented virtuality is another approach com- ing from VR. It consists in virtually representing the en- vironment where a real, physical prototype is placed and tested [16]. It is not so diffused at the moment because of technological costs. The augmented virtuality is usually adopted when hazardous environments as radioactive fields are involved, or when it is very difficult to find or reach the environments for any reason.
2.3. Prototyping Activities
[19]. Digital mock-ups allow evaluating the products they represent from many points of view, by much more people than before, and in a wider range of application domains.
3. Activities
The research described in this paper is divided in two main stages. The first one is focused on a new classifica- tion of existing prototyping activities; the second one aims at developing a selection algorithm given specific design contexts.
3.1. Prototyping Activity Classification
The prototyping activity classification comes through a tree-step procedure. Existing classifications described in literature are analyzed first; then, starting from them, a set of characteristics is defined. Finally, this set is ex- ploited for the generation of the new classification.
3.1.1. Analysis of Existing Classifications
The classification presented hereafter is based on a set of dimensions that allow describing prototyping activities in detail. These dimensions derive from the analysis of ex- isting classifications in literature. Four approaches have been considered. In [14], Azuma defines the AR concept and its possible exploitation. The main topic of this defi- nition consists in virtualizing part of the environment where the user interacts with the product. So, in this case, two dimensions are important: user and environment. The environment is virtualized from the visual point of view; the other senses as touch and hearing are ignored. In [16], Milgram and Kishino base their classification on the difference between virtual and real, from several points of view. In particular, environment is the main dimension used to classify existing prototyping activities. In this case, the environment concept comprehends also the user and the prototype and this could generate prob- lems because too different entities are managed as a sin-
gle one. In [20], Bruno et al. propose a description of
mixed reality to be exploited in prototyping activities. They consider the environment as fully virtual, while the product is real. They exploit video tracking to implement their prototyping scenarios, but the dimensions used to classify different types of prototyping activities are lim- ited to environment and prototype; user and interaction
are ignored. Finally, Bordegoni et al. [21] perform a deep
analysis on the exploitation of mixed reality in prototyp- ing, by introducing two new dimensions: kind of the prototype and interaction. Thanks to these dimensions, they derive a new classification framework based also on user type. In this case, environment is not involved in the classification.
3.1.2. Definition of Dimensions
The analysis of existing classifications highlights that one of the major problems is the absence of clearly de- fined and commonly recognized/accepted dimensions to base the classification on. Then, starting from all the ac- quired knowledge from the literature, a new set of di- mensions is developed here. The criteria used for their definition are as follows.
1) Orthogonality. Dimensions must be complimentary each other, without duplications or partial overlapping;
2) Coverage. Dimensions must be related to classic prototyping activities, but they must deal with the several ID and usability evaluation issues as well;
3) Clarity. Dimensions must be stated without misun- derstandings, thanks to discrete, assignable values.
By applying these three criteria, the result consists in the following four dimensions, each of them with its spe- cific discrete values.
Product representation—prototype. It is very impor-
tant to have the prototype kind as a dimension. It can have two values: real and abstract. The real prototype is the physical one, which can be more or less com- pleted in its parts. The abstract prototype is a product model generated and managed thanks to software ap- plications.
Environment. This dimension represents all the items
needed to perform the interaction, except for users and products. Even in this case, two values are al- lowed: real and simulated, with the same meaning as the previous case.
User. The user is the main entity interacting with the
prototype. User can be real or simulated. In the first case he/she is directly involved in prototyping activi- ties; in the second case software applications simulate his/her presence and behavior.
Interaction. Interaction represents the way the user is
put into relationship with the product. Interaction can be direct or indirect. Unlike the classic definition of direct or indirect interaction [22], in this case interac- tion is defined as direct if it is exactly the same as the one expected with the final product. Indirect interac- tion happens when it requires actions and/or generates feedback different from the expected/designed ones.
Time. Time represents the phase of the design process
when prototyping activities happen. Different phases of the design process require evaluating different as- pects of the product; as a consequence, the prototyp- ing activities may differ. In this case, the assignable values correspond to the stages of the product devel- opment process.
3.1.3. Deriving the New Classification
fore this, an ordering criterion must be defined. It is based on the importance that dimensions have regarding prototyping. The most important dimension is the envi- ronment, given that all the prototyping activities happen inside it. Moreover, three out of the four analyzed studies already consider environment as a dimension and one of them uses it as the sole dimension, even if the concept is intended in a wider way. The second dimension is proto- type, the object coming directly from the design process. These two dimensions allow identifying four classes, as
shown in Figure 1. User and interaction do not contrib-
ute at this main level, but they are important because they allow going deeper in classifying prototyping activities inside the four classes. Finally, there are some cases where environment and/or prototype and/or user are real and simulated/abstract at the same time, for example when an image is superimposed to a physical mock-up. For these situations, a fifth class is provided.
Augmented real prototyping—ARP. Product models
are placed in real scenes; environment is real and prototypes are completely abstract. There are many examples, like furniture set up [25], visual browsers [26], historical reconstructions of ancient monuments [27], and design of infrastructures and roads [28].
Augmented virtual prototyping—AVP. Real proto-
types are placed in a simulated environment. This ap- proach is not so much widespread at the moment; it is used for very special situations. An example could be the flight simulators [29].
Virtual prototyping—VP. In this case nothing is real.
Environment is simulated and prototype is abstract. Some examples are CAD software packages for me- chanical design, like AutoCAD [30] and Blender [31, 32], software packages for design [9] and prototyping [11] processes, operative systems for cell phones and notebooks [10].
Regarding the fifth dimension, in order to avoid a time-dependent classification that would lead to a too complex management, a static classification has been preferred at the moment. This classification is localized at the end of the concept generation phase, before that concept evaluation activities take place. This is a very important milestone, because future manufacturing costs heavily depend from it.
Mixed prototyping—MP. This last class has been
generated to manage situations where prototype and/ or environment and/or user could be real and simu- lated/abstract at the same time. An example of proto- typing activity belonging to this class can be found in first aid training courses. Environment is real, as well as dummies. But, thanks to head mounted displays, students can see possible accident effects on them [33]. Another example of user testing during proto- typing activities can be found in [15].
The description of the five classes is as follows. For each of them, some examples of implementations are highlighted; moreover, the references used in the previ- ous paragraphs and dealing with specific methods/sys-
tems are classified as well. 3.2. Development of the Selection Algorithm
After the definition of the new classification, it is the time to work about the algorithm to select the best proto- typing activities for specific design contexts. Prototyping activities are described first, by defining some character- istics. Then, prototyping situations are described as well. In the end, all of them are put into relationship in order to make the best selection case by case.
Real prototyping—RP. Environment is real as well as
prototype. No virtualization is present. This is the classic situation. Many technologies have been al- ready developed in order to satisfy the physical pro- totyping requirements, starting from CNC milling ma- chines up to rapid prototyping approaches, like stereo- litography, etc. [18,23,24].
Prototyping
Real Simulated
Real Abstract Real Abstract
Real Simulated Real Simulated Real Simulated Real Simulated Dir. Indir. Dir. Indir. Dir. Indir. Dir. Indir. Dir. Indir. Dir. Indir. Dir. Indir. Dir Indir. Prototype
---Environment
---User
Interaction
-VP Virtual prototyping AVP
Augmented virtual prototyping ARP
Augmented real prototyping RP
Real prototyping
[image:4.595.121.474.552.701.2]MPMixed prototyping: when E and/or P and/or U are both real and simulated/abstract
3.2.1. Characterizing Prototyping Activities
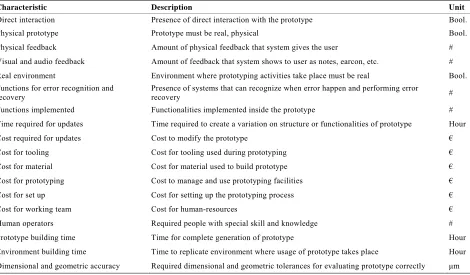
Five dimensions defined were enough to generate the classification; however, prototyping activities need to be described more accurately to allow their selection at best. For this reason, the same analysis of literature described in Section 2.1 is exploited here, but with a different goal. The effort is towards the generation of a wider set of ref- erences, covering more aspects of prototyping activities. These references are named characteristics. Regarding the literature analysis, unfortunately the virtual compo- nent is rarely considered together with the real one. Most of the cases are focused on methods able to classify and select physical prototyping activities [34-37]. On the other hand, sometimes prototyping activities containing virtual/augmented/mixed reality are described with in- teresting examples, but they are not focused on prototyp- ing [38-42]. For these reasons, the analysis has been quite long and difficult. Anyway, by applying the precise criterion that characteristics must be always measurable, in the end eighteen of them have been highlighted. They
are collected in Table 1.
3.2.2. Enriching the Prototyping Activity Classes with Characteristics
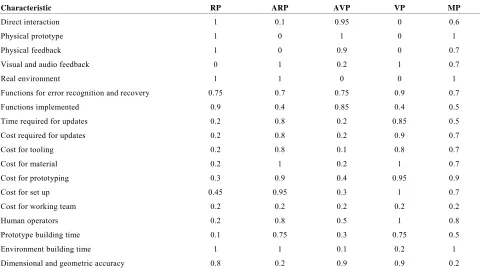
The characteristics allow describing prototyping activi- ties in a suitable way for successive exploitation by the selection algorithm. Five tests are proposed to three ex- perts in ID and usability evaluation, in order to associate these characteristics to the classes. These tests represent
everyday prototyping situations, and the experts are asked to give the characteristics some values, represent- ing how well a specific class could suit for the situations under investigation. The allowed range for values is [0,1]; higher the value, more suitable the class. In order to get a set of data as meaningful and objective as possible, a questionnaire made by eight multiple-choice questions is used. This way, collected data can be analyzed consis- tently and numerical values can be assigned based on averages. Every tests have been evaluated at the end of the concept generation phase, in order to keep valid the limitation described before.
The tests deal with the following prototyping needs. 1) Usability testing of the display and control panel of a washing machine;
2) Testing of user friendliness and affordance of an air purifier used in hazardous environments;
3) Usability testing focused on ergonomic issues, of a PC keyboard;
4) Affordance evaluation of some functions of a new PC operative system;
5) Aesthetical evaluation of watch models on the wrist of possible customers directly by the manufacturer’s website.
[image:5.595.62.532.462.737.2]The results show that experts’ judgments agree, even if they performed their work autonomously. First need is solved using MP, because the prototype needs to be real and abstract at the same time. The realness is needed to get direct interaction; the abstraction makes prototype
Table 1. Characteristics of prototyping activities.
Characteristic Description Unit
Direct interaction Presence of direct interaction with the prototype Bool.
Physical prototype Prototype must be real, physical Bool.
Physical feedback Amount of physical feedback that system gives the user # Visual and audio feedback Amount of feedback that system shows to user as notes, earcon, etc. #
Real environment Environment where prototyping activities take place must be real Bool. Functions for error recognition and
recovery
Presence of systems that can recognize when error happen and performing error
recovery #
Functions implemented Functionalities implemented inside the prototype # Time required for updates Time required to create a variation on structure or functionalities of prototype Hour
Cost required for updates Cost to modify the prototype €
Cost for tooling Cost for tooling used during prototyping €
Cost for material Cost for material used to build prototype € Cost for prototyping Cost to manage and use prototyping facilities €
Cost for set up Cost for setting up the prototyping process €
Cost for working team Cost for human-resources €
Human operators Required people with special skill and knowledge # Prototype building time Time for complete generation of prototype Hour
modification or substitution easier, in order to gain flexi- bility in the design process. AVP is selected to satisfy the second need, to perform the evaluation in a simulated, safe environment instead of the hazardous one. The er- gonomic issues of the third need are thought to be best evaluated using RP, where stereolitography could gener- ate the physical prototype of the keyboard. The fourth need is managed with VP, because product under evalua- tion does not show any physical component. ARP is pre- ferred in satisfying the fifth need, because it allows a fast switching of the prototype and in the meantime the real environment, the customer’s wrist, is exploited.
The averages of the values expressed by the three ex-
perts are collected in Table 2. The rows represent the
characteristics and the columns are the classes of proto- typing activities.
3.2.3. Describing Prototyping Situations
The term prototyping situation is introduced as a way to describe the needs that could happen in a specific mo- ment of the product development process, from the pro- totyping point of view. They represent the requirements that determine the selection of the best prototyping ac- tivities. Prototyping situations are described by mean of indices, generic enough to be exploited in a set of appli- cation fields as wide as possible.
Some questionnaires are created to collect the infor- mation regarding typical development environments: in- dustrial R&D departments, research labs, etc. They are
focused on collecting the most important needs during design processes, as typical timing for prototyping, pro- totyping technologies used to evaluate product function- alities, etc. The results of the survey are validated and enriched with indices derived by some more literature [34-37,43,44]. Again, the indices are measurable, as it happened for the characteristics. The result of this activi-
ity is a set of eleven indices, collected in Table 3.
3.2.4. Relating Prototyping Situations to Prototyping Activity Classes
The relationships between prototyping situations and classes of prototyping activities are the base for the se- lection algorithm. We may establish this link because both elements deal with the same aspects. In fact, situa- tion indices are nothing else than prototyping activity characteristics considered from the design point of view.
The first two columns of Table 4 report this correspon-
dence.
The other columns of Table 4 report average values of
the indices related to the classes, computed thanks to these correspondences.
3.2.5. The Selection Algorithm
[image:6.595.58.540.463.731.2]Now everything is ready for developing the selection algorithm. It is a very simple one at the moment, and this makes its implementation in a software package quite straightforward. The algorithm asks the designers to de- fine the boundary of the problem to solve; they do this by
Table 2. Characteristics related to classes.
Characteristic RP ARP AVP VP MP
Direct interaction 1 0.1 0.95 0 0.6
Physical prototype 1 0 1 0 1
Physical feedback 1 0 0.9 0 0.7
Visual and audio feedback 0 1 0.2 1 0.7
Real environment 1 1 0 0 1
Functions for error recognition and recovery 0.75 0.7 0.75 0.9 0.7
Functions implemented 0.9 0.4 0.85 0.4 0.5
Time required for updates 0.2 0.8 0.2 0.85 0.5
Cost required for updates 0.2 0.8 0.2 0.9 0.7
Cost for tooling 0.2 0.8 0.1 0.8 0.7
Cost for material 0.2 1 0.2 1 0.7
Cost for prototyping 0.3 0.9 0.4 0.95 0.9
Cost for set up 0.45 0.95 0.3 1 0.7
Cost for working team 0.2 0.2 0.2 0.2 0.2
Human operators 0.2 0.8 0.5 1 0.8
Prototype building time 0.1 0.75 0.3 0.75 0.5
Environment building time 1 1 0.1 0.2 1
Table 3. Prototyping situation indices.
Index Description Unit
Direct interaction Need for direct user-prototype interaction Bool. Physical feedback Amount of physical feedback to the user during the tests #
Total feedback Total amount of feedback #
Real environment Possible exploitation of real environment instead of simulated one Bool.
Error recognition and recovery Number of functions that recognize errors and are able to correct them autonomously or with user’s help #
Functions required Number of functions that the prototyping activity should allow to evaluate # Prototype changing flexibility Need for modifying/changing prototype at low costs and time %
Budget Total cost of prototyping activity €/$
Time Total time for prototyping activity Day
Human operators Available people for prototyping activity #
[image:7.595.63.537.306.589.2]Tolerances Required geometric and dimensional tolerances μm
Table 4. Relationships between situations and prototyping activities.
Index Characteristics RP ARP AVP VP MP
Direct interaction Direct interaction
Physical prototype 1 0.05 0.98 N/A 0.8
Physical feedback Physical feedback 1 N/A 0.9 N/A 0.7
Total feedback Physical feedback
Visual and audio feedback 0.5 0.5 0.55 0.5 0.7
Real environment Real environment 1 1 N/A N/A 1
Error recognition and recovery Functions for error recognition and recovery 0.75 0.7 0.75 0.9 0.7 Functions required Functions implemented 0.9 0.4 0.85 0.4 0.5
Prototype changing flexibility Time required for updates
Cost required for updates 0.2 0.8 0.2 0.88 0.6
Budget Cost for tooling
Cost for material Cost for prototyping Cost for set up Cost for working team
0.27 0.77 0.24 0.79 0.64
Time Prototype building time
Environment building time 0.55 0.88 0.2 0.48 0.75
Human operators Human operators 0.2 0.8 0.5 1 0.8
Tolerances Dimensional and geometric accuracy 0.8 0.2 0.9 0.9 0.2
assigning weights representing the importance of the indices in their prototyping situations. The index values are collected in a vector. As before, values are in the range [0,1]. Then, the algorithm checks against blocking elements, the ones deriving from Boolean characteristics and indices. If an index weight is higher than 0.75 and
the corresponding entry in Table 4 is equal to N/A, the
whole column is set to N/A. For example, if the proto- typing activities are required to have advanced physical feedback, the corresponding index weight is set to 0.9. Given that ARP and VP classes have a N/A value in the
corresponding entries of Table 4, during the computation
of the best prototyping activities for this particular case, all values of their columns are temporarily set to N/A.
Then, the index weights are multiplied by the entries of Table 4 and the sums of the results constitute the pro-
totyping activity ranking for the specific situation.
4. First Adoption in the Field
right prototyping activities comes in the correct way. These scenarios are as follows.
1) Small furniture industry. The goal is to allow possi- ble customers testing products against existing home furnishing. Then, real environment exploitation is a must. Moreover, time and budget are quite limited. At the same time, strict requirements exist regarding prototype flexi- bility, because product colors and details must be easily changed on the fly.
2) Big household appliance industry. The need is evaluating the remote control of a TV set. Time is limited, and direct interaction is firmly required. Being at the first design stage, flexibility and cheapness in prototype changing is another important aspect.
3) Mechanical workshop. The need is to test the mat- ing of two components. Direct interaction and physical feedback are main concerns. Constraints about tolerances in prototype accuracy are present; moreover, almost all functions must be implemented in the prototype, because product purpose in this case is to act as a real joining element.
4) Cell phone industry. There is the need for testing a new model equipped with a touch screen. Major re- quirements are high flexibility in prototype changing, most of the functions implemented, feedback as complete as possible, limited costs.
[image:8.595.309.537.101.287.2]5) Aviation industry. Testing of a new model of joy- stick. Real environment cannot be exploited, so it must be simulated during prototyping activities. There are not particular budget or time limitations, but direct interac- tion, implemented functions and total feedbacks are very important issues.
Table 5 reports the weights associated to the indices
[image:8.595.307.539.314.416.2]for the five prototyping situations. They allow running the software package implementing the algorithm.
Table 6 reports the results of the data elaboration.
Different prototyping activities are assigned to differ- ent prototyping situations, and all seems to happen in a correct way. Moreover, a ranking is generated for each situation, allowing the selection of alternative prototyp- ing activities if the preferred ones should not be applica- ble for any reason.
5. Discussion
Some positive aspects of the research described up to now can be summarized as follows.
The prototyping activity classification appears well
defined, thanks to the characteristics allowing a clear description of them.
The characteristics used for the classification and the
indices associated to situations are general enough to make the resulting selection algorithm applicable in many different real scenarios.
Table 5. Index weights for the five prototyping scenarios. Scenarios Index
A B C D E
Direct interaction 0.1 0.8 0.9 0.4 0.9 Physical feedback 0.1 0.8 0.95 0.2 0.9
Total feedback 0.8 0.85 0.95 0.8 0.8 Real environment 0.95 0.85 0.9 0.1 0.1 Error recognition and recovery 0.3 0.3 0.1 0.9 0.75 Functions required 0.6 0.85 0.95 0.95 0.9
Prototype changing flexibility 0.95 0.9 0.3 0.95 0.2
Budget 0.9 0.8 0.65 0.9 0.2
Time 0.95 0.85 0.8 0.95 0.3
Human operators 0.8 0.75 0.6 0.9 0.95
Tolerances 0.1 0.4 0.95 0.5 0.85
Table 6. Results of the selection algorithm execution. Scenarios
Rank
A B C D E
I ARP (4.75) MP (5.65) RP (5.71) VP (4.93) AVP (4.84)
II MP (4.69) RP (5.20) MP (5.36) MP (4.90) RP (4.80) III RP (3.51) ARP (4.63) MP (4.39)
IV RP (4.17)
V AVP (3.99)
Current release of the selection algorithm is quite
simple and its implementation in a software package is straightforward, replicable in different development environments.
Regarding some drawbacks, accounted for as future work, they are as follows.
The prototyping activity classification has been de-
rived from literature and with the help of three ex- perts only. For this reason it cannot be intended as exhaustive. Many experiences in the field are still re- quired to update/integrate the characteristic set and to refine the numerical values.
At the moment, designers must describe their scenar-
ios autonomously. This could be somehow dangerous, because they could not be aware of the implications of their claims. Some sort of expert system should be introduced to guide their involvement in the process.
Looking at Table 6, some columns present values
very close to each other. This happens because all starting values are in the range [0,1]. Maybe this needs to be revised.
6. Conclusion
generate an automatic selection algorithm, given the pe- culiarities of application scenarios. Existing classifica- tions have been considered at the beginning, and the highlight of their best and worst aspects allowed devel- oping a set of eighteen characteristics, used to generate five classes of prototyping activities. Design situations where prototyping could be exploited have been de- scribed thanks to eleven indices. These indices, mapped with the eighteen characteristics, allow selecting the best prototyping activities case by case. Five experiences in the field started to prove the validity of the results. Some aspects of the research need to be focused on. The quan- tifications inside tables need to be improved by thinking about more objective and quantifiable methods, and re- fined by considering a wider set of experiences in the field; moreover, a more guided survey for designers should be developed, to help them in describing their scenario in an effective way. Finally, a more specific analysis is needed in order to really understand and take into the correct consideration the influence of prototyp- ing timing in product development process. All these aspects need to be validated by real case studies per- formed in industries belonging to different domains. This will allow a better customization of the selected set of prototyping activities.
7. Acknowledgements
The authors would like to thank eng. Marco Amato for his help during the development of the research de- scribed in this paper.
REFERENCES
[1] M. Hertzum, “Images of Usability,” International Journal of Human-Computer Interaction, Vol. 26, No. 6, 2010, pp. 567-600.doi:10.1080/10447311003781300
[2] A. Koca, M. Funk, E. Karapanos, A. Rozinat, J. Martens and A. Brombacher, “Soft Reliability: An Interdiscipli- nary Approach with a User-System Focus,” Quality and Reliability Engineering International, Vol. 25, No.1, 2008, pp. 3-20. doi:10.1002/qre.937
[3] A. Umar and K. K. Tatari, “Appropriate Web Usability Evaluation Method during Product Development,” Master Thesis, Software Engineering, School of Engineering, Blekinge Institute of Technology, Ronneby, 2008. [4] Usability Set, 2011.
http://www.usabilitynet.org
[5] J. Nielsen, “Usability Engineering,” Academic Press, New York, 1993.
[6] A. Dix, J. Finlay, G. Abowd and R. Beale, “Human- Computer Interaction,” 2nd Edition, Prentice Hall Europe, London, 1998.
[7] T. S. Andre, H. R. Hartson, S. M. Belz and F. A. McCreary, “The User Action Framework: A Reliable Foundation for Usability Engineering Support Tools,” International Jour-
nal of Human-Computer Studies, Vol. 54, No. 1, 2001, pp. 107-136.doi:10.1006/ijhc.2000.0441
[8] D. Lockton, D. Harrison and N. A. Stanton, “The Design with Intent Method: A Design Tool for Influencing User Behavior,” Applied Ergonomics, Vol. 41, No. 3, 2010, pp. 382-392.doi:10.1016/j.apergo.2009.09.001
[9] H. Y. Kan, V. G. Duffy and C. Su, “An Internet Virtual Reality Collaborative Environment for Effective Product Design,” Computer in Industry, Vol. 45, No. 2, 2001, pp. 197-213.doi:10.1016/S0166-3615(01)00093-8
[10] M. Fairen, P. Brunet and T. Techmann, “MiniVR: A Port- able Virtual Reality Application,” Computers & Graphics, Vol. 28, No. 2, 2004, pp. 289-296.
doi:10.1016/j.cag.2003.12.013
[11] S. H. Choi and A. M. M. Chan, “A Virtual Prototyping Application for Rapid Product Development,” Computer- Aided Design, Vol. 36, No. 5, 2004, pp. 401-412. doi:10.1016/S0010-4485(03)00110-6
[12] J. Verlinden, B. Smit and I. Hovath, “Case-Based Explo- ration of the Augmented Prototyping Dialogue to Support Design,” Proceeding of the TMCE 2004, Lausanne, 12-16 April 2004, pp. 1-10.
[13] S. P. Lee, T. C. T. Qui, S. C. Loy and W. R. Pensyl, “Haptic Interaction in Augmented Reality,” Proceeding of the 17th ACM International Conference on Multimedia, Vancouver, 2009, pp. 975-976.
[14] R. T. Azuma, “A Survey of Augmented Reality,” Pres- ence: Teleoperators and Virtual Environment, Vol. 6, No. 4, 1997, pp. 355-385.
[15] F. Bruno, F. Cosco, A. Angilica and M. Muzzupappa, “Mixed Prototyping for Product Usability Evaluation,” Proceeding of the ASME 2010 International Design En- gineering Technical Conferences & Computers and In- formation in Engineering Conference, Montreal, 2010, pp. 1381-1390.
[16] P. Milgram and F. Kishino, “A Taxonomy of Mixed Re- ality Visual Displays,” IEICE Transactions on Informa- tion System, Vol. E77-D, No. 12, 1994, pp. 1321-1329. [17] T. Salloum, B. Anselmetti and K. Mawussi, “Design and
Manufacturing of Parts for Functional Prototypes on Five- Axis Milling Machines,” The International Journal of Advanced Manufacturing Technology, Vol. 45, No. 7-8, 2009, pp. 666-678.doi:10.1007/s00170-009-2013-z [18] F. P. W. Melchels, J. Feijen and D. W. Grijpma, “A Re-
view on Stereolithography and Its Applications in Bio- medical Engineering,” Biomaterials, Vol. 31, No. 24, 2010, pp. 6121-6130.
doi:10.1016/j.biomaterials.2010.04.050
[19] I. H. Song and S. C. Chung, “Synthesis of the Digital Mock-Up System for Heterogeneous CAD Assembly,” Computers in Industry, Vol. 60, No. 5, 2009, pp. 285-295. doi:10.1016/j.compind.2008.09.004
[21] M. Bordegoni, U. Cugini, G. Caruso and S. Polistena, “Mixed Prototyping for Product Assessment: A Refer- ence Framework,” International Journal on Interactive Design and Manufacturing, Vol. 3, No. 3, 2009, pp. 177- 187. doi:10.1007/s12008-009-0073-9
[22] D. Frohlich, “The History and the Future of Direct Ma- nipulation,” Information System Laboratories, HP Labo- ratories, Bristol, 1993.
[23] C. K. Chua, K. F. Leong and C. S. Lim, “Rapid Proto- typing: Principles and Applications,” 3rd Edition, World Scientific Publishing, New York, 2010.
[24] D. T. Pham and R. S. Gault, “A Comparison of Rapid Prototyping Technologies,” International Journal of Ma- chine Tools & Manufacture, Vol. 38, No. 10-11, 1998, pp. 1257-1287.doi:10.1016/S0890-6955(97)00137-5
[25] S. Filippi, D. Barattin, M. Amato and R. Tozzi, “An Augmented Reality Based Application for Furnishing Con- figuration and Evaluation,” Proceeding of the ASME 2011 World Conference on Innovation Virtual Reality, Milan, 27-29 June 2011, pp. 19-29.
doi:10.1115/WINVR2011-5530
[26] Aurasma, 2012. http://www.aurasma.com
[27] G. Papagiannakis, S. Schertenleib and B. O’Kennedy, “Mixing Virtual and Real Scenes in the Sites of Ancient Pompeii,” Computer Animation and Virtual Worlds, Wiley Interscience, Vol. 16, No. 1, 2005, pp. 11-24.
doi:10.1002/cav.53
[28] A. Nagar and H. Tawfik, “A Multi-Criteria Based Ap- proach to Prototyping Urban Road Networks,” Informing Science and Information Technology, Vol. 4, 2007, pp. 749-756.
[29] R. Yang and L. Yan, “The Design of a 3D Flight Simula- tion and Monitoring Platform,” Advanced Materials Re- search, Vol. 466-467, 2012, pp. 971-975.
[30] Autodesk, 2011.
http://www.autodesk.it/adsk/servlet/home [31] Blender, 2011. http://www.blender.it [32] Tutorials for Blender 3D, 2011.
http://www.tutorialsforblender3d.com/Game_Engine/Tut orials_index.html
[33] Sébastien “VR Geek” Kuntz, 2011. http://cb.nowan.net/blog/2008/04/
[34] A. Armillotta, “Selection of Layered Manufacturing Tech- niques by an Adaptive AHP Decision Model,” Robotics and Computer-Integrated Manufacturing, Vol. 24, No. 3,
2008, pp. 450-461.doi:10.1016/j.rcim.2007.06.001 [35] S. Khrais, T. Al-Hawari and O. Al-Araidah, “A Fuzzy
Logic Application for Selecting Layered Manufacturing Techniques,” Expert System with Applications, Vol. 38, No. 8, 2011, pp. 10286-10291.
doi:10.1016/j.eswa.2011.02.061
[36] S. H. Masood and A. Soo, “A Rule Based Expert System for Rapid Prototyping System Selection,” Robotics and Computer-Integrated Manufacturing, Vol. 18, No. 3-4, 2002, pp. 267-274.doi:10.1016/S0736-5845(02)00017-0 [37] M. Yurdakul, “AHP as a Strategic Decision-Making Tool
to Justify Machine Tool Selection,” Journal of Materials Processing Technology, Vol. 146, No. 3, 2004, pp. 365- 376. doi:10.1016/j.jmatprotec.2003.11.026
[38] S. Kim and A. K. Dey, “AR Interfacing with Prototype 3D Applications Based on User-Centered Interactivity,” Computer-Aided Design, Vol. 42, No. 5, 2010, pp. 373- 386. doi:10.1016/j.cad.2008.10.009
[39] C. Kim, C. Lee, M. R. Lehto and M. H. Yun, “Evaluation of Customers Impressions Using Virtual Prototypes in the Internet Environment,” International Journal of Indus- trial Ergonomics, Vol. 41, No. 2, 2011, pp. 118-127. doi:10.1016/j.ergon.2010.12.006
[40] M. Fumarola and R. Poelman, “Generating Virtual Envi- ronments of Real World Facilities: Discussing Four Dif- ferent Approaches,” Automation in Construction, Vol. 20, No. 3, 2011, pp. 263-269.
doi:10.1016/j.autcon.2010.08.004
[41] J. Ye, R. I. Campbell, T. Page and K. S. Badni, “An In- vestigation into the Implementation of Virtual Reality Technologies in Support of Conceptual Design,” Design Studies, Vol. 27, No. 1, 2006, pp. 77-97.
doi:10.1016/j.destud.2005.06.002
[42] J. Verlinden, A. de Smit, A. W. J. Peeters and M. H. van Gelderen, “Development of a Flexible Augmented Proto- typing System,” Journal of WSCG, Vol. 11, No. 3, 2003, pp. 496-503.
[43] R. S. Kalawsky, S. T. Bee and S. P. Nee, “Human Factors Evaluation Techniques to Aid Understanding of Virtual Interfaces,” BT Technology Journal, Vol. 17, No. 1, 1998, pp. 128-141.doi:10.1023/A:1009687227736