DEVELOPMENT AND VALIDATION OF A NORMAL-PHASE HPTLC
METHOD FOR THE SIMULTANEOUS ANALYSIS OF
PARACETAMOL AND ONDANSETRON IN FIXED-DOSE TABLETS
Vasubabu Padarthi*, Dr. K. N. Vidyadhar, K. Shalini, M. Harika, K.S.G. Sravanthi and M. Keerthana
Department of Pharmaceutical Analysis, V.J’S College of Pharmacy, Rajahmundry.
ABSTRACT
A new precise method was developed for simultaneous quantification
of PARACETAMOL and ONDANSETRON in tablets by HPTLC
method. The chromatograms were developed using a mobile phase of
Chloroform: Dichloro methane: Methanol (4:6:2) on pre-coated plate
of TLC silica gel 60 F254 and quantified by densitometric absorbance
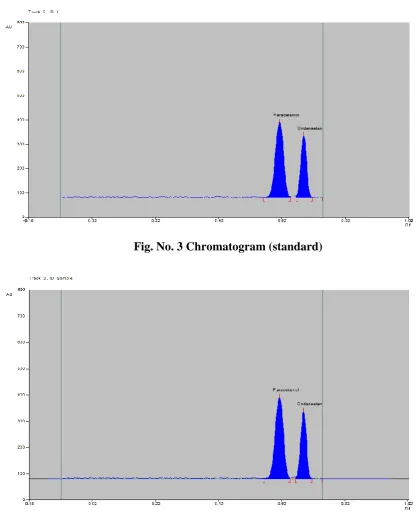
mode at 254 nm. The Rf values were 0.69 and 0.61 for Ondansetron
and Paracetamol respectively. The linearity of the method was found
to be within the concentration range between 1-5 mcg/spot for both
Paracetamol and Ondansetron. The lower limits of detection and
quantification were 0.0634µg/spot and 0.1921µg/spot for Ondansetron
and 0.0112µg/spot and 0.1921µg/spot for Paracetamol. The method was also validated for
precision, accuracy and recovery. This developed method was used to analyze fixed dosage
tablets (Lupisetron plus, Lupin Ltd) samples of Paracetamol and Ondansetron.
KEYWORDS: Paracetamol, Ondansetron and HPTLC.
INTRODUCTION
Paracetamol is chemically N-(4-hydroxyphenyl)ethanamid, N-(4-hydroxyphenyl)acetamide
which is generally considered to be a weak inhibitor of the synthesis of prostaglandins (PGs).
Paracetamol also decreases PG concentrations in vivo, but, unlike the selective COX-2
inhibitors, paracetamol does not suppress the inflammation of rheumatoid arthritis.[9] The main mechanism proposed is the inhibition of cyclooxygenase (COX), and recent findings
suggest that it is highly selective for COX-2. Paracetamol reduces the oxidized form of the
Volume 5, Issue 11, 756-764. Research Article ISSN 2277– 7105
*Corresponding Author
Vasubabu Padarthi
Department of
Pharmaceutical Analysis, V.J’S College of
Pharmacy, Rajahmundry. Article Received on 05 Sept. 2016,
Revised on 26 Sept. 2016, Accepted on 16 Oct. 2016
COX enzyme, preventing it from forming pro-inflammatory chemicals. This leads to a
reduced amount of Prostaglandin E2 in the CNS, thus lowering the hypothalamic set-point in
the thermoregulatory centre.
Ondansetron is chemically (RS)-9-methyl-3-[(2-methyl-1H
-imidazol-1-yl)methyl]-2,3-dihydro-1H-carbazol-4(9H)-one. Ondansetron is a potent, highly selective 5HT
3 receptor-
antagonist. Chemotherapeutic agents and radiotherapy may cause release of 5HT in the small
intestine initiating a vomiting reflex by activating vagal afferents via 5HT
3 receptors.
Ondansetron blocks the initiation of this reflex.
The literature review supports that there was no HPTLC method had been reported for the
determination of Paracetamol and Ondansetron in tablet dosage form.
So an experiment was taken to expand and corroborate a HPTLC method for the
determination of Paracetamol and Ondansetron in tablet dosage forms.
Fig. 1 PARACETAMOL Fig. 2 ONDENSETRON
MATERIALS
Paracetamol and Ondansetron were earned from Ideal analytical and research institution
Puducherry, India. All chemicals worn were analytical standard. The pharmaceutical tablet
dosage form used in this study was Lupisetron with a label claim of Paracetamol 500 mg and
Ondansetron 4mg were purchased from local pharmacy.
Preparation of solutions Standard Solution
Weighed accurately 100 mg of Ondansetron and 100mg paracetamol into 100 ml standard
Sample Preparation
To determine the content of paracetamol, ondansetron in synthetic mixture(both the drugs
100 mg, lactose100 mg ,talc 100 mg ,magnesium stearate 100 mg). The amount equivalent to
100mg of the drug was transferred into a 100 ml volumetric flask containing 50 ml methanol,
sonicated for 30 mins and diluted to 100 ml with methanol. The resulting solution was
centrifuged at 3000 rpm for 5mins and supernatant was analyzed for drug content (1000
μg.mL-1
). One microlitre of the above solution (1000 ng.spot-1) was applied on the TLC plate followed by development and scanning under described condition.
Chromatographic conditions
Paracetamol and Ondansetron reference standard solutions were prepared using methanol as
solvent. Solutions of 2 μL were applied to the HPTLC plates as spot bands of 6 mm using
Linomat ΙV with CAMAG 100µl syringe. Application positions were at least 15 mm from the
sides and 10 mm from the bottom of the plates by using the chamber CAMAG twin trough
chamber (20X10). Mobile phase components like Chloroform: Dichloro methane:
Methanol(4:6:2) were mixed prior to use and the development chamber was left for saturation
with mobile phase vapor for 10 min before each run. Development of the plate was carried
out by the ascending technique to a migration distance of 7 cm. Then the plates were dried on
a hot plate. All the analyses were carried out in a laboratory with temperature control (20–
24 °C).
Densitometry scanning was done in absorbance mode at 2546 nm using a deuterium lamp.
The slit dimensions were set at 6 mm×0.30 mm, the scanning speed of 10 mm/s, and the data
resolution at 100μm/step. Development time was20mints and Single wavelength detection
was performed since the main components were only analyzed.
METHOD VALIDATION
The developed method was validated as per the International Conference on Harmonization
(ICH) guidelines with respect to linearity and range, precision, accuracy, recovery studies,
RESULTS AND DISCUSSIONS ASSAY
Fig. No. 3 Chromatogram (standard)
Fig. No. 4 Chromatogram (sample)
Table No.1: Assay of Paracetamol. SI Drug Concentration
(µg/spot)
Peak area
Amount found (mg)
% Purity (w/w)
Label claim
1. Paracetamol
3 9364.8 100.0117475 100.0117
100mg
3 9345 99.99464983 99.9946
[image:4.595.87.506.106.631.2]Table No. 2: Assay of Ondansetron. SI Drug Concentration
(µg/spot)
Peak area
Amount found (mg)
% Purity (w/w)
Label claim
1. Ondansetron
3 6478.7 100.8154 100.8154
100mg
3 6516.3 99.05751 99.0575
3 6478.2 99.8335 99.8335
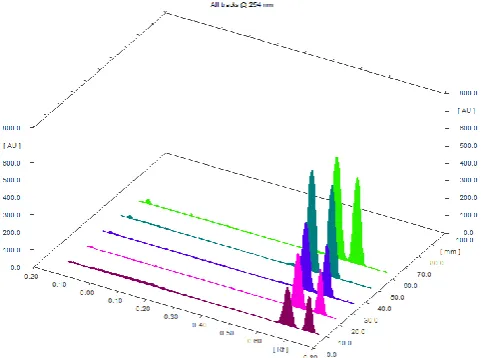
LINEARITY
The response for paracetamol and ondansetron was linear (R2= 0.999 Paracetamol and R2 =0.999Ondansetron) in the concentration range between 1-5 mcg/spot. The mean (±RSD)
values of slope, intercept and correlation coefficient were 3160.66667, 73.6667, 0.999 for
[image:5.595.178.420.298.477.2]paractamol and 2240.33333, 89.6633, 0.999 for ondansetron respectively.
Fig. No. 5: HPTLC densitogram for linearity.
Table No. 3: Linearity parameters for Paracetamol. Linearity Correlation
coefficient(y)
Slope(m)
Intercept(c)
Linearity 1 0.999 3161 77.4
Linearity 2 0.999 3169 82.07
Linearity 3 0.999 3152 61.53
Average 0.999 3160.66667 73.6667
Table No. 4 Linearity parameters for Ondansetron. Linearity Correlation
coefficient(y) Slope(m) Intercept(c)
Linearity 1 0.999 2232 115.9
Linearity 2 0.999 2244 39.99
Linearity 3 0.999 2245 113.1
LIMIT OF DETECTION
The signal: noise ratios of 3:1 and 10:1 were considered as LOD and LOQ respectively. The
limit of detection was found to be 0.0112µg/spot and 0.0634µg/spot for Paracetamol and
Ondansetron respectively. The limit of quantification was found to be 0.0341µg/spot
and0.1921µg/spot for Paracetamol and Ondansetron, respectively, which was lower than that
reported earlier
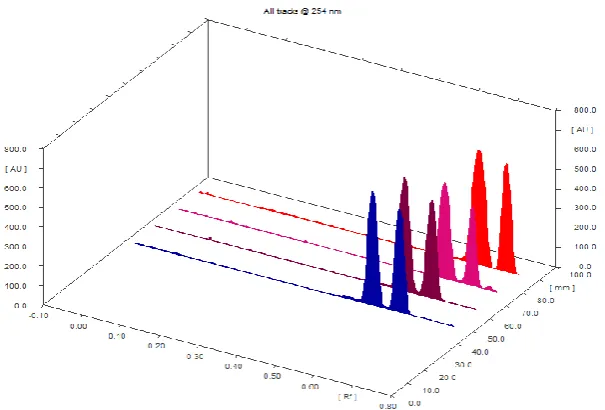
PRECISION
[image:6.595.146.449.224.429.2]Fig. No. 6: HPTLC densitogram for precision.
Table No. 5 Precision for paracetamol and ondansetron.
concentration
Inter assay Intra assay
Day 1 Day 1 Day 2
Precision 1 Precision 2 Precision 3
PARA ONDAN PARA ONDAN PARA ONDAN
3µg/Spot 9367.9 6489.5 9345 6459.4 9445 6459.4
3µg/Spot 9467.9 6497.5 9367.7 6408.3 9567.7 6367.3
3µg/Spot 9369 6432.9 9356 6334.8 9455.5 6456.8
3µg/Spot 9364 6498.7 9345 6458.2 9645 6428.2
3µg/Spot 9547.8 6375 9546.7 6429.8 9456.7 6356.8
3µg/Spot 9458.5 6457 9457.4 6459.8 9457.4 6459.8
Mean 9429.1833 6458.4333 9402.9666 6425.05 9504.55 6421.38
SD 74.906486 48.431133 82.209650 48.856105 82.678866 47.57715
%RSD 0.7944111 0.7498898 0.8742948 0.7604003 0.8698872 0.740918
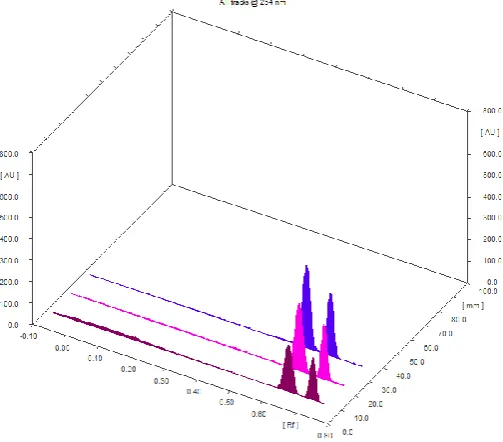
ACCURACY
The accuracy was assessed by the methodological recovery. The recovery of the method was
calculated by comparing the determined concentration of spiked samples to the theoretical
concentration level and reported with its standard deviation. The intra-day and inter-day
percentages of accuracy obtained for Paracetamol at the concentrations of 2, 3, 4 ng/spot, and
for Ondansetron at the concentrations of 2, 3 and 4 ng/spot, are respectively. The percentage
recovery of paracetamol and ondansetron was found to be in the range of 99.103-99.804%
and 99.1412-101.2573% which is well within the acceptance limit of 97% - 103%w/w.
Figure-31: HPTLC densitogram for accuracy.
RECOVERY
The estimated percentage recovery was found to be close to 100% and hence prove the
recovery of the method. The percentage recovery of paracetamol and ondansetron was found
to be in the range of 99.103-99.804% and 99.1412-101.2573% which is well within the
acceptance limit of 97% - 103%w/w.
Table No. 6: Summary of validation for simultaneous estimation of paracetamol and ondansetron by hptlc.
Parameters Results Acceptance
Paracetamol Ondansetron Criteria
Linearity-Range (µg/spot) 1-5(µg/spot) 1-5(µg/spot) ---
Correlation coefficient 0.999 0.999 >0.9960
Slope 3160.66667 2240.33333 ---
Intercept 73.6667 89.6633 ---
[image:7.595.173.425.194.415.2]CONCLUSION
A simple, and selective high performance thin layer chromatographic method was developed
and validated for estimation of paracetamol and ondansetron in synthetic mixture. The
method employed precoated TLC aluminum plates with silica gel 60F254 as the stationary
phase. The solvent system comprised Chloroform: Dichloro methane: Methanol(4:6:2v/v/v).
The retention factor is 0.61min and 0.69 min for paracetamol and ondansetron respectively.
Spectrodensitometric scanning integrationwas performed 254 nm. The polynomial regression
data for the calibration graph showed good linear relationship with R2 = 0.999 in the concentration range of 1-5 µg/spot. The developed method was validated for precision and
recovery. The proposed method is applied for determination for paracetamol and
Ondansetron.
REFERENCES
1. Validation of Analytical procedures / Methodology, ICH harmonized tripartite guidelines,
1996; 1–7.
2. The United States pharmacopoeia-34, United States Pharmacopieal convention Inc., Rock
Ville, 2010; 243-250.
3. Liu J et al. reported High-performance liquid chromatographic analysis of Ondansetron
enantiomers in human serum using a reversed-phase cellulose-based chiral stationary
phase and solid-phase extraction, J Chromatogr B Biomed Sci Appl,1997;694(1):179-84 .
4. Sinan Suzen et al. reported A reversed-phase high-performance liquid chromatographic
method for the determination of acetaminophen in pharmaceutical formulations,J Fac
Pharm, 1998; 27(2): 93-100.
5. Andres Criado et al. reported Continuous flow spectrophotometric determination of
paracetamol in pharmaceuticals following continuous microwave assisted alkaline
hydrolysis, Talanta, 2000; 53(2): 417–423.
6. Steffen Bauer et al. reported Simultaneous determination of ondansetron and tropisetron
in human plasma using HPLC with UV detection. Biomed Chromatogr, 2002; 16(3):
187-90.
7. Levent Altun M. et al. eported a HPLC Method for the Analysis of Paracetamol, Caffeine
and Dipyrone, Turk J Chem, 2002; 26: 521-528.
8. Katerina Milenkova et al. reported simultaneous determination of paracetamol,
pseudoephedrine hydrochloride and dextromethorphan hydrobromide,by RP-HPLC
9. Chandrasekar D et al. reported determination of ondansetron in human plasma by
reversed-phase high-pressure liquid chromatography, 2004; 54(10): 655-659.
10.María de los A. Oliva et al. reported Selective spectrofluorimetric method for
paracetamol determination through coumarinic compound formation, Talanta, 2005;
66(1): 229–235.
11.Altair B. Moreira et al, reported Direct determination of paracetamol in powdered
pharmaceutical samples by fluorescence spectroscopy, Analytica Chimica Acta, 2005;
539(1–2): 257–261.
12.Ravi kumar P et al. reported Derivative Spectrophotometric Estimation of Ondansetron
and Paracetamol, E-Journal of Chemistry, July 2006; (3)12: 134-136.
13. Pillai S et al. reported Three simple, accurate, economical and reproducible UV
spectrophotometric methods for simultaneous estimation of two component drug mixture
of ranitidine hydrochloride and ondansetron hydrochloride from combined tablet dosage
form, Indian J Pharm Sci, 2007; 69: 601-604.
14.Asad Raza et al. reported Spectrophotometric Determination of Ondansetron
Hydrochloride in Pharmaceutical Bulk and Dosage Forms, Journal of the Chinese
Chemical Society, 2007; 54: 223-227.
15.Patra S et al. reported Spectrophotometric method for ondansetron hydrochloride, Indian
J Pharm Sci, 2007; 69: 840-1.
16.Milkica Crevar et al. reported Statistical Optimization of Reverse Phase High
Performance Liquid Chromatography for the Analysis of Caffeine Paracetamol and its
Degradation Product p-aminophenol, Acta Chim. Slov, 2008; 55: 665–670.
17.www.gsk.com.au/resources.ashx/.../281/.../PI_Ondansetron-RL.pdf