Beyond data in the smart city: learning from a case
study of re-purposing existing campus IoT
Oliver Bates
School of Computing and Communications Lancaster University
Email: [email protected]
Adrian Friday
School of Computing and Communications Lancaster University
Email: [email protected]
Abstract—In this article we present a case study of our experiences of using existing IoT infrastructure to create a campus scale “living laboratory” for promoting energy savings and environmental sustainability. As a series of lessons for others creating IoT systems from existing city infrastructures we offer the challenges we have experienced through our attempt to join up and re-purpose existing energy monitoring and building management systems as an IoT infrastructure for a “smart campus”. We highlight the limitations of particular views of a campus from a purely driven perspective, advocating data-aware over data-driven approaches that engage with a wide variety of stakeholders. Finally, we reflect on the inclusion of people’s practices in understanding and designing smart cities, repurposing existing IoT, more careful consideration of ethics and domestication when co-creating smart campuses and the importance of challenging the existing rhetoric around energy waste in Smart Cities and Smart buildings research.
I. INTRODUCTION
Internet of Things (IoT) is often painted as key to opening the door to ‘smart cities’ heralding a ‘smart future’ facilitated by technology that joins up systems providing better control of resources to increase efficiency, reduce waste, lower energy use and greenhouse gas emissions from public services and infrastructures [1].
Sensors and data about city life might provide ‘a single view of the truth’ [2], that can be understood using big data analytics and decision support systems, promising to revolutionise how cities operate and are managed. Irrespective of the confidence we place in some of these grandiose claims, there is little question that data and analytics have been catalysts for revolution in other domains, and are worthy for further exploration for helping manage the city’s resources more effectively.
In this article we offer a number of lessons based on our own relatively modest case study of creating a software platform to help make our University campus “smart”. This is part of a broad and ambitious initiative to enable campus to be aliving laboratory for sustainability. Our case study focuses on an early step in this process: integrating data from the existing energy and building management systems to enable integrated analysis and optimisation.
This process has helped us identify several opportunities for innovating with regard to energy and sustainability, but also highlighted a number of significant challenges which have both threatened the project’s viability. Our work draws attention to
gaps in knowledge, new ethical concerns, and the (lack of) inclusion of the everyday needs of the people that rely on the campus to live, work and study in this type of research. The goal of this paper is to share the challenges brought about while creating this system, which we believe will need to be faced by many other smart city technologists.
We reflect on why creating this platform has been more challenging than we first thought and provide these as a set of lessons and opportunities to the community. Multi-building campuses are common, spanning academic and industrial in-stitutions, providing densely populated areas in which people’s lives and a multitude of day-to-day practices are conducted. Resources and infrastructures provided by campuses are im-plicated in these practices, which in the case of businesses and academic institutions links directly to the bottom lines of the cities and campus that they are performed within. IoT developers will face similar technical and organisational barriers involving integrating complex financial or institutional constraints and priorities. We hope that drawing attention to these issues will start and important dialogue amongst practitioners and researchers in academic and non-academic settings alike.
II. ENERGYINFORMATIONSYSTEMCASESTUDY
Energy data is our starting point: by making data about energy and building use on campus available more widely to a variety of stakeholders we aim to bring new ideas and innovation to address the challenges of sustainability, and to strategically inform operational decision making. Our platform integrates various data sources relating to energy demand and building use. Our logic for this is simple: our campus infrastructure is unoptimised, so if we can demonstrate energy savings (a substantial cost to the institution), then we can build confidence and stakeholder ‘buy-in’ in the platform and the wider sustainability project.
Fig. 1. Top level energy use for 3 department buildings, April 4-12 2015. Weekdays clearly exhibit higher peaks than weekends. Substantially different baseline loads are also obvious, but load is not normalised by building size or occupancy.
360,000m2, costing in the region of £4m annually. Solely in energy terms, the associated CO2 externality is over 19,000 tonnes annually.
We need to make the campus infrastructure available in a controlled way so that we can better understand and optimise the performance of campus more effectively; identify waste and targets for energy savings and infrastructural improve-ments; and bring innovative solutions and analysis to bear on the challenge. The campus electricity, gas, water, heating and cooling is overseen by a building management system (100+ controllers, 1–2 per building) and energy management system (900+ meters). There are over 5,000 attached sensors/actuators associated with the BMS. The systems and infrastructures that are used to manage and monitor buildings and energy on campus are proprietary, with access to the raw data (e.g. energy consumption, heating of building) accessible only via dedicated software. We have successfully integrated the following data sources:
• Building Management Systems (BMS)—the BMS
pro-vides data and control of the heating, cooling and ven-tilation on campus as well as a large range of telemetry data for the combined heat and power generator (CHP), boiler room, internal and external building temperatures and other data on renewables.
• Energy Monitoring System (EMS)—The EMS
con-trollers allow us to get data from attached sensors that ag-gregate readings from the energy monitoring subsystems used to understand energy consumption and flow across campus. EMS covers electricity, gas and water flow.
• Wind Turbine. 10 minutely wind turbine performance
including wind and direction, wind speed, blade rotation speed, power (kW) and energy produced (kWh).
• Campus timetabling and room booking. All room
booking events (meeting rooms and lecture theatres, but not offices) including class timetables.
• Local meteorological data. Ambient temperature,
rela-tive humidity, wind speed and wind energy (10 minute averages), minutes of sun, from a local met office grade weather station.
A. Data driven insights
To bring energy and building performance data together with the other data sources for the first time we are creating a central data hub called the ‘Energy Information System’ or EIS. This will be key to allowing the campus estate and energy saving interventions to be evaluated properly.
As we can see from Figure 1 which shows energy use for 3 buildings overlaid for 1 calendar week in 2015; the daily rhythms of energy use climbing slowly as the week progresses, but also return to a substantial baseline energy load overnight. The EIS allows us to drill down below this top level view to start to explore what composes these loads still further.
B. Unlocking data for stakeholders
We make EIS data available in raw format (CSV, down-load API) via a CKAN server1. However, despite fast initial progress, this is proving complex at an entire campus level, as we discuss in section IV. We have formed steering and user groups to help us refine the platform to meet key stakeholder needs.
C. Understanding day-to-day life
The data exposed via EIS has enabled the interrogation of how, when and why energy is used on campus (cf. patterns of consumption in Figure 1, heating input and temperature in Figure 2). Early results indicate: a) that the granular data only provides a limited representation of the complex configurations of people, technology, labs, offices, and living spaces that are implicated in practices, and b) that more nuanced and detailed enquires reveal important socio-technical perspectives that data-driven perspectives can overlook.
III. OPPORTUNITIES
There are a number of straightforward ways in which this data is already helping researchers to work with University facilities managers. These include:
1) Strategic oversight.Providing a view of energy demand
and consumption through business intelligence tools we are able to engage University management and reveal some of the complexity in why energy and building systems on campus perform in certain ways.
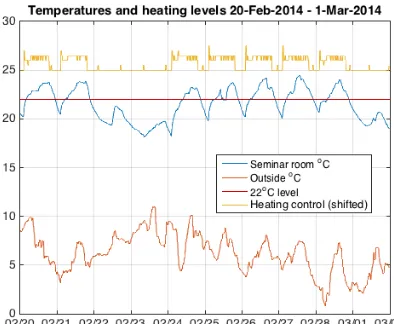
2) Optimising heating systems. Reducing wasted energy
from overheated buildings. From Figure 2 we see that indoor temperature in this specific building is above a nominal 22◦C level from around 05.00 until after 21.00.
Assuming a ‘normal’ temperature range of 19-22◦C, we
can reduce the temperature by over 2◦C for most of
the day, plus turn the heating on later and off earlier (a reduction of 4 hours of heating) to maintain this temperature from 06.00 until 18.00. While this snapshot is certainly not representative of the entire estate, it represents a potential 25% reduction in heat input to this space. Additional savings are also anticipated assuming we can heat or cool spaces only when they are in
[image:2.612.53.293.52.160.2]use, or change expectations around achieving comfort indoors [3].
Fig. 2. Temperature and heating input to a seminar room from historical data used to create a new control schedule to avoid overheating and trim heating to occupied hours.
3) Live experiments. To us, perhaps the most exciting
potential of the platform is to allow us to conduct and measure the effects of experiments designed to reduce energy impacts at a small-city scale. In the past, it has been difficult to measure the effects of our interventions, due to limited access to infrastructural sensors [3], [4], [5]; we are currently engaged in a project with Univer-sity facilities to explore fine-grained heating control of an entire multi-use building.
4) Making sense of the (smart) city.The living laboratory
allows for integration of experimental energy supply and demand technologies, it is also a great opportunity to understand peoples’ role in the city and how this relates to energy and emissions. From a inter-disciplinary per-spective it is important to more clearly understand the implications of smart cities and living labs on those who live, work, and study in them. We echo calls for better contextualisation of the day-to-day lives of citizens in the smart city to help understand how people integrate and acknowledge the smart city environment (cf. [6]) alongside how the smart city affects changes in everyday practices and routines of citizens [7] (some may argue that it shouldn’t!). How can smart city technologies be domesticated into everyday life (cf. [8])?
IV. CHALLENGES
Despite aligning with University sustainability priorities2, and enjoying considerable support from influential decision makers around the University, creating this platform has been unexpectedly challenging precisely because it cross-cuts the organisation and many stakeholders. We now discuss the challenges we believe are most relevant to researchers and
2http://www.lancaster.ac.uk/sustainability/, last accessed January 19, 2017.
smart city developers, especially operating at a similar scale and context:
1) Granularity and user requirements of data. The
requirements for temporal and spatial data that our stakeholders have, are not fixed. Already, there is a tension between the ambition of some researchers and the data that we can make available due to limitations of the underlying systems. For example, researchers may want room level breakdown of energy consumption, but this is at a finer resolution than the system can or is likely to provide. Similarly, a standard metering interval for energy data is aggregated at the 30 minute level—this is considerably coarser than required for typical non-intrusive load monitoring and state of the art energy disaggregation systems [9]. We need to be able to cope with different non-homogeneous sampling intervals across hardware, but offer uniform aggregate views as a basis for comparison. Our user requirements continues to co-evolve with our campus community and estate. We plan to offer both cleaned, re-sampled and raw disaggregated data-sets via our data portal.
2) Complexity and meta-data. At even a campus scale,
the complexity of organising the data and data sources into meaningful hierarchies, and understanding it’s con-text so it can be used intelligibly is not to be under-estimated. Meters connect at different points in both electrical and spatial terms. A meter might include a particular circuit (say lighting) or be one of multiple meters relating to the same physical space. BMS sys-tems evolve over time, and grow organically with the evolution of buildings [10], this digital-physical mapping typically exists outside of the existing system sometimes in digital form, but sometimes in ‘tacit knowledge’ of operational staff. This needs to be captured, encoded, and brought into the system.
3) System age and complexity. Unlike our previous
re-search deployments [3], [4], deployed at one time using homogeneous hardware and software, the campus en-vironment has evolved over decades. The management infrastructure reflects this evolution, and there are many choices of equipment manufacturer and technology. This is particularly true of the building management system, where different versions of the same manufacturers’ hardware, and other hardware entirely can be found, in building delivered at various eras. A large portion of the work on our platform has gone into “unlocking” these potential data sources and developing software to manage the important of data from these devices.
4) Security and critical infrastructure.There is currently
from boiler houses and wind turbines are made open to our system. This naturally raises fears and concerns about the security not only of our system, but of wider access to this critical infrastructure and fears of new potential attack vectors. There is also strong concern over the potentially sensitivity of the data especially the finer grained sensing, and relating to commercially sublet premises on campus.
We have found decisions around security of IoT and its data extend beyond the remit of existing well defined security policies and decision making processes. Some-times security and the maintenance of the infrastructure are in tension. Usernames and passwords are the gateway to the underlying sensing and actuation that controls the energy flows and building systems on campus. In a modern age where hard to crack passwords are almost taken for granted, we forget that secure passwords and encryption makes can complicate fault finding systems in emergencies, especially where external companies are involved.
5) Understanding the meaning behind the data.Figure 1
illustrates how on it’s own energy consumption data is insufficient to make decisions for a department or building. As one of the larger energy users on campus, it would be tempting to target LEC 1 with a number of standard energy based interventions to ‘change the behaviour’ of its occupants (cf. designing for Resource Man [11]). In reality, making energy reductions is not this simple. The dynamics of a building such as LEC 1 are completely different from any of the others shown in Figure 1. Firstly, LEC 1 is a large and complex mixed-use building; it contains a lot of energy intensive equipment specific to ongoing research in environmental sciences and biology which require close (and energy intensive) environmental control. To some extent,energy is science, and changing the infrastructure to save energy could impact scientific findings. Accurately capturing this kind of consequence is essential to inform the design of energy and sustainability policies and technologies for the people and practises that go on inside specific buildings. We advocate qualitative observational and ethnographic fieldwork to develop these understandings and inform intervention design. Smart city platforms thus need to be able to capture, and make available, this kind of qualitative meta-data alongside the data to ensure these understandings are not lost.
6) Responsibility. A particular challenge for our project
has been identifying who should be responsible for the running and maintenance of the project, since the goals cross-cut the institution and thus budgets. Until we are able to demonstrate a substantial return on investment (e.g. energy reductions), conducting a wide reaching and cross-cutting sustainability project of this kind (which is not directly the core responsibility of any single decision structure for teaching or research) has been difficult to resource. Given the technical challenges of the
vari-ous hurdles for access to data, changing infrastructure, interest in specific data and developing software, the project needs a champion who has perspective of the entire system and is willing to push for it regardless of domain or their own specific interest. The problem lies in other parties (researchers, people who funded it originally) having other more pressing concerns in their day-to-day roles—and until the system is complete (it may always be developing and growing) stakeholders will always find it hard to understand how the system can be used to benefit them. The system needs a champion who can talk to a diverse audience. The longevity of this project currently resides with invested individuals across the organisation, e.g. senior researcher, energy manager—and identifying these motivated stakeholders has been essential to the project’s success.
7) Ethics.It is far from clear to what extent we are allowed
to conduct living laboratory experiments that affect the expectations and established norms of campus life. We do not anticipate requiring ethics process approval as long as we optimise existing estate without discomfiting campus users (e.g. reducing heating of space that is considered unused). A traditional study involving human subjects requires disclosure to potential participants, and an explicit ‘opt-in’ to being studied. How can this process scale to entire buildings or sections of the estate? What happens if only certain participants opt-out, yet the effects of changes to participants around them bleed through and effect them? We do not yet have answers to these questions.
In a living lab, we may well face an ethical dilemma: to what extent are we engaging participants in the goals of the study, and to what extent are they being ‘experi-mented upon’. So called ‘natural field experiments’, in which participants are unaware that they are taking part in an experiment, provide potentially powerful evidence that energy savings can be made in real domains, without self-selection biases. These kinds of experiments are more common in certain disciplines where fundamental ethical principles of minimising harm to participants are considered sufficient, but in many countries and disciplines, this would require adjustment to ethical approval processes and codes of practice.
8) Sustaining a Smarter campus. Looking forward, as
campus expands and new technology is retrofitted to replace existing systems there will be challenges around the integration of new and different solutions for EMS and BMS. For integration into EIS, continued support will be required from the University to ensure successful expansion and maintenance of the platform.
V. REFLECTION ANDLESSONSLEARNT
campus; and, a growing list of new opportunities for building applications and tools that use the data that lead to savings, and even research impacts. These benefits should not be small by any means, but it’s crucial to reflect on the current state of the project and its potential limitations that are already starting to emerge:
A. Focusing on the “low-hanging fruit”
Pragmatically, it’s expedient to focus on gaining value from existing infrastructure. With such a system (e.g. EIS) there are a number of “low-hanging fruit” opportunities for ICT and computing (e.g. data exposure and exploration, develop-ing applications for data visualisation and decision support, connecting existing systems, closing the automation loops of existing BMS). From our experience it’s important to firstly identify areas (e.g. particular buildings, infrastructures) that may look interesting (e.g. from data aware insights) to inform further investigation.
Questions remain around energy demand, and whether quantitative data and systems such as EIS are sufficient to inform decision making. Where data is used as a lens for understanding a problem it is easy given the scale of the new resource to ignore the limitations of what is being represented or even mis-represented along with information and context that is not being captured quantitively. The temptation may be to increase the levels of monitoring (e.g. more disaggregated sensing, finer granularity data, appliance level monitoring) or to pair data sources with qualitative accounts (e.g. mixed-methods approaches to understand practices).
While these may seem like natural avenues forward, the reality is that new technology may not play well with existing systems, campus scale deployments of IoT for sensing and control is a considerable investment, and sociological based qualitative studies or ethnographic explorations of campus would struggle to capture the full diversity. While these are all attractive in certain smaller scale on campus (e.g. studying student cooking practices [4]), the reality is that these solutions don’t scale due to deployment and maintenance costs. The worth of this kind of study comes in developing new understandings of how campus is implicated in practices, and how these understandings can help in the (co-)design of a smart and sustainable campuses.
B. Data tells you one story. . .
Data tells you one story around energy consumption (e.g. Figure 1), but more often than not energy is not linked to why or how it’s being consumed. There is need to understand the system in order to reform it. We should be encouraging data-aware design over that that is data-driven (cf. Churchill’s data-aware design [12]) in order to promote more full un-derstandings of the implications, limitations and boundaries of data we collect. To be able to do this it’s important to capture the complexity of the system (e.g. campus) and it’s use through multiple lenses (e.g. systems thinking [13], sustainable lens [14]), and not just with an increase in the levels and granularity at which we do sensing. One way
of doing this is by working with citizens and stakeholders (e.g. students, employees, researchers, security, business, hotel, campus residents) to understand their requirements to better inform and contextualise the data in EIS. We need to incorpo-rate nuanced qualitative understandings of the everyday lives of (at least a subset of) these citizens and stakeholders (e.g. [4]) when the data is exposed (e.g. through business analytics, in applications, aggregated data).
C. Mediation and domestication, integrating smart solutions into practices
Primary qualitative data has highlighted that it is important to understand the roles of people, technology, and the spaces in which they study, live and work in order to achieve successful integration of ‘smart’ technologies in areas where technology cannot currently be used to capture and comprehend human complexity and variations.
At this stage we have struggled to make the case to management and other data-driven practitioners in ways that incorporate the role of social rhythms and varying practice norms on a sustainable campus (cf. Pierce et al. [15]).
D. Re-purposing and retrofitting IoT
IoT offers the potential to exploit existing infrastructure for the smart city. It is worth pausing to question whether the technology already present is good enough for the job. Ques-tions over data granularity come back to industry standards (e.g. 30 minute aggregate energy meter readings for the EMS) versus the (potentially infinite) requirements of researchers. For a number of stakeholders (e.g. Energy Manager, some statisticians) the current granularity of data is good enough (30 minute bins), but looking forward with the expectations of sub-second live data that the smart grid and storage techniques may rely upon (e.g. streaming data at 100 Hz), will we need the finer/higher granularity than what IoT promises? One case for retrofitting is the inconsistent disaggregation due to a variety of different aged meters and manufacturers being used throughout the EMS. The aggregation and representation of the data provided is dependant on sub-system, age of building and age of technology, all of which have been affected by the changes in standards over the years. Being unable to get higher granularity data may be a barrier for some research, including those who wish to investigate applications for the smart grid and micro generation. Retrofitting new technology across campus is an option, but not one that will happen over night.
E. Inter-disciplinary co-creation
Requirements and implications of the “smart city” can be more deeply understood by turning to other fields of expertise that are more classically trained in: understanding humans and their interactions with technologies (e.g. sociologists, ethnographers, designers); cities, their dynamics and planning (e.g. architects, building managers, office managers, civil engi-neers); and, experts in energy, energy systems and environmen-tal systems (e.g. environmenenvironmen-tal scientists, engineers, energy managers). By engaging these experts in order to help make informed decisions and design around the smart city, we will be better equipped to understand the non-technical limitations when it comes to designing for city, campus and energy systems. By leveraging this expertise we can co-develop an understanding of energy supply and demand sufficiently in order to unpick it and co-create a smart campus for all citizens and stakeholders.
F. Challenging the rhetoric of energy waste.
Energy is science, energy is business, energy is tuition. En-ergy is required to run the campus and the services it provides. Simply put, it doesn’t always make sense for the institution to have aggressive reduction-centric goals and expectations around the consumption of energy. From the engagement with a variety of stakeholders (e.g. Energy Manager, Building Manager, Researchers, Lecturers, Businesses) the answers to the “is energy actually being wasted?” can be seem to be more complex than those provided by analysis of quantitative data provided by EIS.
Whilst we agree that inefficiencies should be addressed (e.g. district heating, lighting and heating buildings outside use hours), it’s crucial to recognise that energy is thecore resource
that makes practically everything that happens on campus pos-sible, including aiding the increase of the institution’s impact in terms of economic value, contributions to academia, and education. With this in mind, given the context and complexity of a University and its core business, it perhaps doesn’t make sense to create policies that assume we can simply limit the energy consumption of existing equipment, technologies or buildings. Rather, from an energy point of view, smarter cities and campuses should be looking more towards curtailment of redundant activities, ongoing replacement with zero-carbon and renewable energy solutions, and reshaping the very core activities and infrastructures to be done differently [7], and here enabling the living laboratory has a key role.
VI. CONCLUSION
In this article we have demonstrated how leveraging existing energy monitoring and building management infrastructure provides a low cost platform for developing a smarter campus. Through our exploration so far we have been able to utilise computing’s strengths around data (e.g. data ingress, combin-ing data sources, live data streamcombin-ing) to build a vision for a smart campus and “Living Laborartory”, that utilises smarter use of it’s infrastructure and fosters engagement between the campus’ stakeholders and energy. This has lead to a number of opportunities for energy and sustainability goals to be realised.
Simultaneously we highlight the underlying complexity of ‘real-world’ systems and energy implicated practices that are part of the emerging smart city; placing particular emphasis on the importance of understanding the context and limitations of these data and infrastructures to before committing to any particular IoT or large scale intervention. Existing data and infrastructures can help to identify and focus energy savings: but further investigation to contextualise the data is needed before you make any decisions as these decisions ultimately will affect peoples’ lives and practices which are at the core of what the city does—and it is only through reshaping these that smart cities will make substantial energy and sustainability improvements.
An absolutely fundamental question for smart cities, is to what extent they can ‘challenge’ the norms and routines for those living and working in them to promote sustainability. For example, changing the temperature maintained in the building and heating schedules, might be interpreted as withholding heat from employees or a loss of benefit, or might even bring complaints, or fears about compliance with health and safety expectations or organisational norms and policies. But, if our remit is constrained to ‘anything that is possible as long as it goes unnoticed or doesn’t change existing practice’, then ultimately the purpose of a sustainable smart city is surely defeated?
REFERENCES
[1] V. Olgyay, “Connecting buildings helps fight climate change.” https://www.greenbiz. com/article/connecting-buildings-helps-fight-climate-change, June 2016.
[2] C. Harrison, “Building a resilient planet.” http:// www.redbooks.ibm.com/redpapers/pdfs/redp4978.pdf, January 2013. [3] A. K. Clear, J. Morley, M. Hazas, A. Friday, and O. Bates,
“Un-derstanding adaptive thermal comfort: new directions for ubicomp,” in Proceedings of the 2013 ACM international joint conference on Pervasive and ubiquitous computing, pp. 113–122, ACM, 2013. [4] O. Bates, A. K. Clear, A. Friday, M. Hazas, and J. Morley, “Accounting
for energy-reliant services within everyday life at home,” inInternational Conference on Pervasive Computing, pp. 107–124, Springer, 2012. [5] A. Clear, A. Friday, M. Hazas, and C. Lord, “Catch my drift?:
achiev-ing comfort more sustainably in conventionally heated buildachiev-ings,” in
Proceedings of the 2014 conference on Designing interactive systems, pp. 1015–1024, ACM, 2014.
[6] V. Thomas, D. Wang, L. Mullagh, and N. Dunn, “Where’s wally? in search of citizen perspectives on the smart city,”Sustainability, vol. 8, no. 3, p. 207, 2016.
[7] E. Shove, M. Pantzar, and M. Watson,The dynamics of social practice: Everyday life and how it changes. Sage Publications, 2012.
[8] T. Berker, M. Hartmann, and Y. Punie,Domestication of media and technology. McGraw-Hill Education (UK), 2005.
[9] S. Gupta, M. S. Reynolds, and S. N. Patel, “Electrisense: single-point sensing using emi for electrical event detection and classification in the home,” in Proceedings of the 12th ACM international conference on Ubiquitous computing, pp. 139–148, ACM, 2010.
[10] T. Rodden and S. Benford, “The evolution of buildings and implications for the design of ubiquitous domestic environments,” inProceedings of the SIGCHI conference on Human factors in computing systems, pp. 9– 16, ACM, 2003.
[11] Y. Strengers, “Smart energy in everyday life: Are you designing for resource man?,”interactions, vol. 21, no. 4, pp. 24–31, 2014. [12] E. F. Churchill, “From data divination to data-aware design,”
interac-tions, vol. 19, no. 5, pp. 10–13, 2012.
[14] S. Mann,Sustainable Lens: A visual guide. 2011.
[15] J. Pierce, Y. Strengers, P. Sengers, and S. Bødker, “Introduction to the special issue on practice-oriented approaches to sustainable HCI,”ACM