© 2019, IRJET | Impact Factor value: 7.211 | ISO 9001:2008 Certified Journal | Page 8030
STUDY ON PEDESTRIAN CROSSING BEHAVIOUR AT INTERSECTIONS
Maria Francis
1, Archana.S
21
Maria Francis, PG Scholar, Dept. of Civil Engineering, Jyothi Engineering College, Kerala, India
2Archana.S, Assistant Professor, of Civil Engineering, Jyothi Engineering College, Kerala, India
---***---Abstract -
Among different modes in transportation
walking is one of the sustainable mode in urban transportation especially in India, because of the flexibility and mobility involved in the walking mode. Pedestrians face many problems during the crossing of crosswalk at intersections. Study of pedestrian crossing behavior under mixed traffic conditions is required in order to provide necessary infrastructure. It also helps in achieving the pedestrian safety especially at intersections. This study focuses on analyzing the crossing behavior of pedestrians like crossing speed variation and pedestrian crossing compliance with signal under mixed traffic conditions at controlled and uncontrolled intersections. Influencing factors of pedestrian crossing behavior are identified based on statistical tests. Three controlled and uncontrolled intersections were identified in Thrissur district. Video graphic method was adopted for data collection. Observed pedestrian samples from these intersections were used for analyzing the crossing behavior of pedestrians. To identify the significant factors that affects the traffic signal compliance, Pearson’s correlation coefficient test and ANOVA test is used. Influencing factors that affects pedestrian crossing speed were studied. This study helps in understanding the pedestrian crossing behavior at both controlled and uncontrolled intersections. The major findings of this study are age, gender and group characteristics are the significant factors affecting pedestrian crossing speed and also gender, crossing speed and age has a significant affect in pedestrian compliance behavior.
Key Words
:
Pedestrian Compliance, Pedestrian
Crossing Behaviour, Pedestrian Crossing Speed.
1. INTRODUCTION
A person who travels on foot is termed as pedestrian. Pedestrian can be any person walking, running, standing or sitting on a road, a pram or in a mobility device or persons in a toy vehicle and not capable of exceeding 10 km/h is known as pedestrian Walking is always recommended for a healthy life and it is also considered to be a clear example of sustainable mode of transport especially suitable for urban use and for shorter distances. Nowadays, pedestrian spaces are becoming increasingly rare due to the importance bestowed to vehicular modes of travel, in the planning and design of transportation systems,
pedestrians are not taken into account. At some point every person is a pedestrian. So, it is necessary to consider the various issues relevant to pedestrians such as pedestrian safety, convenience and amenities.
A crosswalk is a fundamental pedestrian facility in the urban roadway system which helps the pedestrians to safely cross the streets. This study identifies pedestrian characteristics such as pedestrian crossing speed and their compliance behavior towards traffic regulations at the respective study areas and evaluating the significant factors that affect pedestrian crossing speed in the crosswalks at intersections. A video survey is preferred for this study and detailed analyses is needed in order to study the changes of pedestrian characteristics. Length of the crosswalk and pedestrian speed are very important indicators to determine minimum pedestrian crossing timing.
1.1
Objectives
To examine the effects of pedestrian characteristics on pedestrian crossing behavior
To identify the significant factors that affect pedestrian crossing speed in crosswalks at both controlled and uncontrolled intersections
To determine the most significant factors affecting pedestrian compliance behaviour
2. BACKGROUND
In order to carry out the study, more information regarding the pedestrians and their crossing behaviour were required. For this, different journals were referred and the information gathered was used for the successful execution of the study.
Marisamynathan. et al. [5] analyzed the crossing behavior of pedestrians like crossing speed, compliance with signal and pedestrian vehicular interaction under mixed traffic conditions and identified the influencing factors based on statistical tests. Factors influencing pedestrian crossing speed was studied and a design crossing speed was determined for old 0.95m/s and adult pedestrians 1.12m/s.
© 2019, IRJET | Impact Factor value: 7.211 | ISO 9001:2008 Certified Journal | Page 8031
pedestrian characteristics, pedestrian movements, trafficconditions, road conditions, walking environmental surroundings and intersection was considered. Pedestrian characteristics like age, gender and that of carrying baggage or luggage and their respective crossing patterns was examined. Considering the safety margins and gaps accepted by pedestrian in traffic stream pedestrian safety was also analyzed. It was observed that males and children have higher crossing speed. Approximately one out of five pedestrians has the safety margins of 0 second. Pedestrian waiting time analysis can be used to decide the need of pedestrian facility in that area
Tabish., S et al. [9] conducted pedestrian study by observing their speed and behavior in different environments with varying city size and population. Ambala and Chandigarh cities was the study locations. Data collection was done using manual count and questionnaire survey at the study locations. Questionnaire survey included questions related the pedestrian facilities like, choice of under bridge/ over bridge, choice of lightening, frequency of visit of pedestrian’s. In this project the information of pedestrian facilities was gathered. It helped to establish a methodology to deal with pedestrian optimization problems
3. DATA COLLECTION
A video graphic survey has been done at six intersections namely, Mundur, Choodnal, Akkikavu, Peramangalam, Palakkal and Ottupara. Each of these six intersections have three approaches and a camera was setup at an elevated station to record the data to each approach of these intersections. The survey was done for morning and evening to find out the pedestrian peak hour in the respective intersections
4. DATA ANALYSIS
4.1 Pedestrian Crossing Patterns
During the analysis of recorded data from various study locations in Thrissur city, two major crossing patterns were observed, this can be classified as (a) one/two and (b) perpendicular/oblique crossings. The proportion of pedestrian estimated within these different crossing patterns for all study locations at both controlled and uncontrolled intersections are shown in Table 1 and 2
In controlled intersections major proportion of pedestrians in the study locations are crossing in perpendicular with one step crossing pattern. Main reason for this is, pedestrians are safer to cross during their green phase and therefore they can easily cross the road without any objections. But in the case of uncontrolled intersections pedestrian vehicular interactions are more and therefore they cannot complete their crossing in one step pattern and therefore two step
perpendicular patterns is mostly observed in these intersections
Table -1: Pedestrian Crossing Patterns at Controlled Intersections
Total Number of Samples Observed- 294
Crossing
Patterns Pedestrians Crossing (%) One Step Two Step
Perpendicular
Crossing 42.86 27.56
Oblique crossing 21.47 6.12
Overall 66.32 33.68
Table -2: Pedestrian Crossing Patterns at Uncontrolled Intersections
Total Number of Samples Observed- 545
Crossing
Patterns Pedestrians Crossing (%) One Step Two Step
Perpendicular
Crossing 22.93 36.70
Oblique
crossing 21.47 18.90
Overall 44.40 55.60
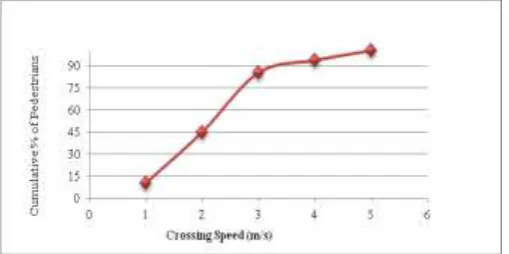
4.2 Crossing Speed and Crossing Pattern
© 2019, IRJET | Impact Factor value: 7.211 | ISO 9001:2008 Certified Journal | Page 8032
Chart -1 Cumulative Frequency Curves forPerpendicular Movements at Uncontrolled Intersections
Chart -2 Cumulative Frequency Curves for Perpendicular Movements at Controlled Intersections
Chart -3 Cumulative Frequency Curves for Oblique Movements at Controlled Intersections
Chart -4 Cumulative Frequency Curves for Oblique Movements at Uncontrolled Intersections
4.3 Video graphic Data at Collected Intersections
[image:3.595.35.290.424.551.2]The obtained mean crossing speed of Mundur and Akkikavu is 1.43m/s and 1.32m/s respectively which is greater than 1.2m/s. In Choondal the mean crossing speed of pedestrians is observed to be less than 1.2m/s. In Akkikavu and Choondal 15% of pedestrians crosses with a speed of 1m/s and 1.05m/s respectively which is lower than the assumed crossing speed 1.2m/s? The median speed of all three intersections is very much higher than the 1.2 m/s. Thus it can be understood that pedestrians crosses the crosswalk with less crossing time and thus have greater crossing speed.
Table -3: Pedestrian Crossing Patterns at Controlled Intersections
Location Mundur Akkikavu Choondal Time of
Survey 8:30-9:30 15:30-16:30 16:00-17:00
Crosswalk
Length(m) 14.60 9.40 14.60
No. of
Samples 109 89 96
Direction Two Two Two
Mean
Speed(m/s) 1.43 1.32 1.15
Standard
Deviation 0.28 0.75 0.55
V15(m/s) 1.89 1.00 1.05
V50(m/s) 3.22 1.80 2.36
V85(m/s) 4.40 3.90 3.80
© 2019, IRJET | Impact Factor value: 7.211 | ISO 9001:2008 Certified Journal | Page 8033
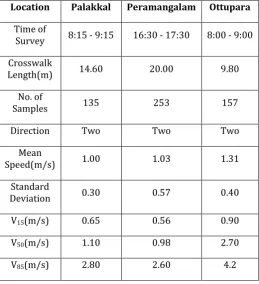
intersections. So the pedestrians are more cautious at these [image:4.595.307.560.51.240.2]intersections
Table -4: Pedestrian Crossing Patterns at Uncontrolled Intersections
Location Palakkal Peramangalam Ottupara Time of
Survey 8:15 - 9:15 16:30 - 17:30 8:00 - 9:00
Crosswalk
Length(m) 14.60 20.00 9.80
No. of
Samples 135 253 157
Direction Two Two Two
Mean
Speed(m/s) 1.00 1.03 1.31
Standard
Deviation 0.30 0.57 0.40
V15(m/s) 0.65 0.56 0.90
V50(m/s) 1.10 0.98 2.70
V85(m/s) 2.80 2.60 4.2
4.4 Analysis of Variation in Crossing Speed
Among various categories considered male pedestrians and adult category have higher crossing speed compared to the other groups. There is no significant variation observed in pedestrian’s speed due to handling of baggage. The least crossing speed is observed for the old people among various categories
Chart -5 Cumulative Frequency Curves for Oblique Movements at Uncontrolled intersections
Chart -6 Cumulative Frequency Curves for Oblique Movements at Controlled intersections
4.5 Significant Parameter Estimation Using SPSS
25.0 Software
[image:4.595.32.292.160.445.2]The pedestrian crossing speed is analyzed using ANOVA test to investigate the significant factors that affect the crossing speed at signalized intersections. The ANOVA test was performed using SPSS 25.0 software. Gender, Age group, group size during pedestrian departure is the parameters considered for ANOVA test based on the literature review references. The test was performed at 95% confidence interval and statistical results are shown in Table 5 and Table 6
Table -5: Results of ANOVA Test on Factors Influencing Crossing Speed Variations at Uncontrolled Intersection
Factor F value P value Remarks
Age 10.624 0.00 Significant
Gender 6.371 0.00 Significant Group 7.554 0.006 Significant Baggage
[image:4.595.37.287.560.728.2]Carrying 5.019 0.036 Significant
Table -6: Results of ANOVA Test on Factors Influencing Crossing Speed Variations at Controlled Intersection
Factor F value P value Remarks
Age 26.284 0.00 Significant
Gender 33.685 0.00 Significant
Group 5.412 0.021 Significant
Baggage
© 2019, IRJET | Impact Factor value: 7.211 | ISO 9001:2008 Certified Journal | Page 8034
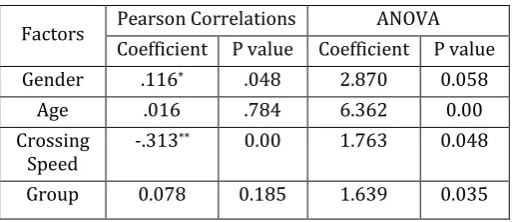
4.5 Significant Parameter Estimation of Pedestrian
Compliance Using SPSS 25.0 Software
[image:5.595.34.291.284.395.2]Pedestrian compliance behaviors are analyzed using Pearson's correlation coefficient, and ANOVA test, to investigate the main factors that affect the pedestrian compliance with traffic signals at signalized intersections. Gender, age, group, number of pedestrians and crossing speed are the parameters considered for statistical test. All tests are performed in SPSS 25.0 software at 95% confidence interval. The statistical results are shown in Table 7
Table -7: Results of ANOVA Test and Pearson Correlation Test on Factors Influencing Factors Influencing
Compliance Behaviour
Factors Pearson Correlations ANOVA Coefficient P value Coefficient P value
Gender .116* .048 2.870 0.058
Age .016 .784 6.362 0.00
Crossing
Speed -.313
** 0.00 1.763 0.048
Group 0.078 0.185 1.639 0.035
4. CONCLUSION
The pedestrian crossing behavior at three controlled and three uncontrolled intersections were found out and based on the conducted statistical tests, the significant factors affecting the pedestrian crossing speed variations and compliance behavior were identified and tabulated. The major findings were: Among the crossing patterns more pedestrians crosses the roads in perpendicular direction and two stage crossing pattern is greater in uncontrolled intersections. In both type of intersections pedestrian crossing speed of a male is faster than that of a female. Adult and child group of pedestrians have greater crossing speed compared to old people. The average crossing speed of uncontrolled intersections is less than 1.2m/s and that of controlled intersections’ is greater than 1.2m/s. Pedestrians are more cautious while crossing uncontrolled intersections and hence they have less crossing speeds. The pedestrian crossing behavior analysis is the important factor for deciding the assurance of pedestrian safety on roads. And this study is helpful to develop pedestrian delay models at controlled and uncontrolled intersections
ACKNOWLEDGEMENT
I am thankful to teaching staffs and Department of Civil Engineering, Jyothi Engineering College, for great support throughout this project. I am deeply indebted to Kunnamkulam, Peramangalam, Wadakkancher and
Neduppuzha Traffic Police Stations who helped to collect accident data.
REFERENCES
[1] Alhajyaseen,W,K,M and Asano,I,M, “Analysis of pedestrian clearance time at signalized cross walks in Japan”. Procedia Computer Science, vol. 32, 2014, pp. 301-308.
[2] Anoop,P,A., Aswathy,T,B., Rachana,K,B., Chandran.V., and Paul,B., “Analysis of pedestrian risk exposure in Thrissur city.” International Research of Journal of Engineering and Technology, vol. 3(4), 2006.
[3] Chandra.,S., Rastogi.,R., Asano.,M and M.,K.,Wael “Descriptive and parametric analysis of pedestrian gap acceptance in mixed traffic condition”. KSCE Journal of Civil Engineering vol. 18, 2014, pp. 284-293.
[4] Jain,A., Gupta,A and Rastogi,R “Pedestrian crossing behavior analysis at intersections”. International Journal of Traffic and Transportation Engineering, vol. 4(1), 2014, pp. 103-116.
[5] Marisamynathan and Perumal,V., “Study on pedestrian crossing behavior at signalized intersections”. Journal of Traffic and Transportation Engineering, vol. 1(2), 2014, pp. 103-110.
[6] Muley, D., Kharbeche, M., Alhajyaseen, W and Salem, M.,“Pedestrian’s Crossing Behavior at Marked Crosswalks on Channelized Right-Turn Lanes at Intersections” Procedia Computer Science, vol. 109C, 2017, pp.233–240.
[7] Park,J,H. and Li.S., “Pedestrian Crossing Behavior and Compliance at Signalized Intersections” Road Safety of Five Continents,2014, pp. 1-12.
[8] Shaabana, K. and Abdel-Waritha, K., “Agent-based Modeling of Pedestrian Behavior at an Unmarked Midblock Crossing.” Procedia Computer Science, vol. 109, 2017, pp. 26–33.
[9] Tabish,S. and Kumar,M., “Research paper on study of pedestrian crossing behavior, analysis at intersection.” International Journal of Latest Research in Science and Technology, vol. 4(6), 2017, pp. 43-47.