Constraints on Large Extra Dimensions from the MINOS Experiment
P. Adamson,8 I. Anghel,15, 1 A. Aurisano,7 G. Barr,22 M. Bishai,3 A. Blake,5, 16 G. J. Bock,8 D. Bogert,8 S. V. Cao,30 T. J. Carroll,30 C. M. Castromonte,9 R. Chen,18 S. Childress,8 J. A. B. Coelho,31 L. Corwin,14,∗
D. Cronin-Hennessy,19 J. K. de Jong,22 S. De Rijck,30 A. V. Devan,33 N. E. Devenish,28 M. V. Diwan,3 C. O. Escobar,6 J. J. Evans,18 E. Falk,28 G. J. Feldman,10 W. Flanagan,30 M. V. Frohne,11,† M. Gabrielyan,19
H. R. Gallagher,31 S. Germani,17 R. A. Gomes,9 M. C. Goodman,1 P. Gouffon,25 N. Graf,23 R. Gran,20 K. Grzelak,32 A. Habig,20 S. R. Hahn,8 J. Hartnell,28 R. Hatcher,8 A. Holin,17 J. Huang,30 J. Hylen,8
G. M. Irwin,27 Z. Isvan,3 C. James,8 D. Jensen,8 T. Kafka,31 S. M. S. Kasahara,19 G. Koizumi,8 M. Kordosky,33 A. Kreymer,8 K. Lang,30 J. Ling,3 P. J. Litchfield,19, 24 P. Lucas,8 W. A. Mann,31
M. L. Marshak,19 N. Mayer,31 C. McGivern,23 M. M. Medeiros,9 R. Mehdiyev,30 J. R. Meier,19 M. D. Messier,14 W. H. Miller,19 S. R. Mishra,26 S. Moed Sher,8 C. D. Moore,8 L. Mualem,4 J. Musser,14 D. Naples,23 J. K. Nelson,33 H. B. Newman,4 R. J. Nichol,17 J. A. Nowak,19,‡ J. O’Connor,17 M. Orchanian,4
R. B. Pahlka,8 J. Paley,1 R. B. Patterson,4 G. Pawloski,19 A. Perch,17 M. M. Pf¨utzner,17 D. D. Phan,30 S. Phan-Budd,1 R. K. Plunkett,8 N. Poonthottathil,8 X. Qiu,27 A. Radovic,33 B. Rebel,8 C. Rosenfeld,26 H. A. Rubin,13 P. Sail,30M. C. Sanchez,15, 1 J. Schneps,31 A. Schreckenberger,30 P. Schreiner,1 R. Sharma,8
A. Sousa,7 N. Tagg,21 R. L. Talaga,1 J. Thomas,17 M. A. Thomson,5 X. Tian,26 A. Timmons,18 J. Todd,7 S. C. Tognini,9 R. Toner,10 D. Torretta,8 G. Tzanakos,2,† J. Urheim,14 P. Vahle,33 B. Viren,3 A. Weber,22, 24
R. C. Webb,29 C. White,13 L. Whitehead,12 L. H. Whitehead,17 S. G. Wojcicki,27 and R. Zwaska8 (The MINOS Collaboration)
1
Argonne National Laboratory, Argonne, Illinois 60439, USA
2
Department of Physics, University of Athens, GR-15771 Athens, Greece
3
Brookhaven National Laboratory, Upton, New York 11973, USA
4
Lauritsen Laboratory, California Institute of Technology, Pasadena, California 91125, USA
5
Cavendish Laboratory, University of Cambridge, Cambridge CB3 0HE, United Kingdom
6
Universidade Estadual de Campinas, IFGW, CP 6165, 13083-970, Campinas, SP, Brazil
7
Department of Physics, University of Cincinnati, Cincinnati, Ohio 45221, USA
8
Fermi National Accelerator Laboratory, Batavia, Illinois 60510, USA
9Instituto de F´ısica, Universidade Federal de Goi´as, 74690-900, Goiˆania, GO, Brazil 10Department of Physics, Harvard University, Cambridge, Massachusetts 02138, USA
11Holy Cross College, Notre Dame, Indiana 46556, USA
12Department of Physics, University of Houston, Houston, Texas 77204, USA 13Department of Physics, Illinois Institute of Technology, Chicago, Illinois 60616, USA
14Indiana University, Bloomington, Indiana 47405, USA 15
Department of Physics and Astronomy, Iowa State University, Ames, Iowa 50011 USA
16
Lancaster University, Lancaster, LA1 4YB, UK
17
Department of Physics and Astronomy, University College London, London WC1E 6BT, United Kingdom
18
School of Physics and Astronomy, University of Manchester, Manchester M13 9PL, United Kingdom
19
University of Minnesota, Minneapolis, Minnesota 55455, USA
20
Department of Physics, University of Minnesota Duluth, Duluth, Minnesota 55812, USA
21
Otterbein University, Westerville, Ohio 43081, USA
22
Subdepartment of Particle Physics, University of Oxford, Oxford OX1 3RH, United Kingdom
23
Department of Physics and Astronomy, University of Pittsburgh, Pittsburgh, Pennsylvania 15260, USA
24Rutherford Appleton Laboratory, Science and Technology Facilities Council, Didcot, OX11 0QX, United Kingdom 25Instituto de F´ısica, Universidade de S˜ao Paulo, CP 66318, 05315-970, S˜ao Paulo, SP, Brazil
26Department of Physics and Astronomy, University of South Carolina, Columbia, South Carolina 29208, USA 27Department of Physics, Stanford University, Stanford, California 94305, USA
28Department of Physics and Astronomy, University of Sussex, Falmer, Brighton BN1 9QH, United Kingdom 29Physics Department, Texas A&M University, College Station, Texas 77843, USA
30
Department of Physics, University of Texas at Austin, Austin, Texas 78712, USA
31
Physics Department, Tufts University, Medford, Massachusetts 02155, USA
32
Department of Physics, University of Warsaw, PL-02-093 Warsaw, Poland
33
Department of Physics, College of William & Mary, Williamsburg, Virginia 23187, USA (Dated: August 26, 2016)
We report new constraints on the size of large extra dimensions from data collected by the MINOS experiment between 2005 and 2012. Our analysis employs a model in which sterile neutrinos arise as Kaluza-Klein states in large extra dimensions and thus modify the neutrino oscillation probabilities due to mixing between active and sterile neutrino states. Using Fermilab’s NuMI beam exposure
of 10.56×10²⁰ protons-on-target, we combine muon neutrino charged current and neutral current data sets from the Near and Far Detectors and observe no evidence for deviations from standard three-flavor neutrino oscillations. The ratios of reconstructed energy spectra in the two detectors constrain the size of large extra dimensions to be smaller than 0.45µm at 90% C.L. in the limit of a vanishing lightest active neutrino mass. Stronger limits are obtained for non-vanishing masses.
PACS numbers: 14.60.St, 14.60.Pq, 04.50.+h
Neutrino oscillation has been established through mea-surements of solar, atmospheric, reactor, and accelerator beam neutrinos [1–7]. The underlying mechanism can be described by the unitary PMNS mixing matrix [8], which connects the three weak flavor eigenstates (νe,νµ,ντ)
with the three mass eigenstates (ν1,ν2,ν3). This ma-trix can be parameterized by three mixing angles, θ12, θ13, and θ23, and a CP-violating phase δCP. Oscilla-tion probabilities in vacuum depend upon the mixing pa-rameters, neutrino energy, travel distance (baseline), and the squared neutrino mass differences ∆m2
ij ≡m2i −m2j
(i, j = 1,2,3). Oscillation probabilities in long-baseline experiments can be further modified by matter effects [9]. Current data are well described by the three-flavor model. However, with increasing precision of experi-ments, one can test for discrepancies that could be ac-counted for by small modifications to the standard three-flavor model. One such scenario employs large extra di-mensions.
Sub-millimeter sized large extra dimensions were orig-inally introduced in [10] to explain the large gap between the electroweak scale, mEW ∼103GeV, and the Planck scale, MPl ∼ 1018GeV. In this model, MPl attains its high value due to a volumetric scaling of a more funda-mental scale, MPl, which is assumed to be of the same order of magnitude asmEW,
MPl2 =MdPl+2Vd, (1) where d is the number of extra dimensions and Vd the corresponding volume. In this framework, however, the lack of a higher fundamental scale disqualifies the see-saw mechanism [11] as an explanation of the small neutrino masses. To resolve this, the existence of sterile neutrinos, arising as Kaluza-Klein (KK) states in the extra dimen-sions, is suggested in [12], leading to small Dirac neutrino masses
mν=κv
MPl MPl
, (2)
whereκis a Yukawa coupling coefficient andvthe Higgs vacuum expectation value.
Adopting the Large Extra Dimension (LED) model of [13–16], all the Standard Model (SM) fields, including the three left-handed (active) neutrinos and the Higgs dou-blet, live on a four-dimensional brane, 3+1 spacetime. Three SM singlet fermion fields, one for each neutrino fla-vor, live in a higher-dimensional bulk, 3+1+dspacetime,
with at least two compactified extra dimensions (d≥2). To simplify matters, one of the extra dimensions can be compactified on a circle with radiusR much larger than the size of the other dimensions, effectively making this a five-dimensional problem. The compactness of the extra dimension allows a decomposition of each bulk fermion in Fourier modes. From the couplings to gauge bosons, the zero modes can be identified as the active neutrinos, while the other modes are sterile neutrinos. All these states are collectively referred to as the KK towers. The Yukawa coupling between the bulk fermions and the ac-tive neutrinos leads to mixing between the SM and KK neutrinos, which alters the three-flavor oscillation prob-abilities. Hence, neutrino oscillation measurements can constrain the size of large extra dimensions.
The oscillation amplitude among active neutrino states can be written as
A(να→νβ) = 3
X
i,j,k=1 +∞
X
n=0
UαiUβk∗ Wij(0n)∗Wkj(0n)
×exp
i
λ(jn)
R
!2
L
2E
, (3)
whereE is the neutrino energy andLthe baseline [16]. The eigenvalues λ(jn) of the Hamiltonian depend on R
and the active neutrino masses m1, m2, and m3. The matrices U and W are the mixing matrices for the ac-tive and KK neutrino modes, respecac-tively. The (0n) in-dices refer to the mixing between the zero mode and the KK tower. In practice, only the first five KK modes are considered in each tower [16]. Squaring the amplitude gives the oscillation probabilityP(να→νβ). Compared
to the three-flavor case, this model requires two extra parameters, R and m0, where the latter is defined as the lightest active neutrino mass (normal mass order-ing: m3 > m2 > m1 ≡ m0; inverted mass ordering: m2> m1> m3≡m0).
In Fig. 1, the muon neutrino survival probability,
P(νµ→νµ), for the MINOS baseline and normal mass
True energy (GeV) 1 10 )µ ν → µ ν ( P 0 0.2 0.4 0.6 0.8 1 1.2 Normal ordering Baseline 735 km
2 eV -5 10 × = 7.54 21 2 m ∆ 2 eV -3 10 × = 2.37 32 2 m ∆ = 0.308 12 θ 2 sin = 0.022 13 θ 2 sin = 0.410 23 θ 2 sin = 0 CP δ 3 40 Three-flavor
= 0 eV
0 m m, µ = 0.5 R
= 0 eV
[image:3.612.57.293.51.225.2]0 m m, µ = 1.0 R
FIG. 1: The muon neutrino survival probabilityP(νµ→νµ) at the MINOS Far Detector as a function of the true neutrino energy form0= 0 eV andR= 0.5µm (red line) or 1µm (blue line), and for three-flavor oscillation (black line).
amplitude of the modulations increases while their fre-quency decreases, making the effects of LED easier to observe away from the oscillation minimum. The values in Fig. 1 of ∆m2
32= 2.37×10⁻³eV
2 and sin2θ
32= 0.410 are taken from the MINOS standard oscillation analysis [3]. The value of sin2θ13 = 0.022 is a weighted average of the Daya Bay [17], RENO [18], and Double Chooz [19] results. The values of ∆m221 = 7.54×10⁻⁵eV2 and sin2θ12 = 0.308 are taken from a global fit [20]. We set δCP = 0 since it has little effect on the oscillation probabilities [21]. These values are used throughout the analysis.
Constraints on this model based on atmospheric, re-actor, and accelerator beam neutrino oscillation experi-ments are discussed in [15]. The authors derived a bound constrainingR to be less than 0.82µm at 90% C.L. The sensitivities of CHOOZ, KamLAND, and MINOS for this model were calculated in [16] using a modified version of the GLoBES software [22]. Assuming 7.24×10²⁰ protons-on-target (POT) for MINOS inνµmode, a combined
sen-sitivity of R <0.75 (0.49)µm at 90% C.L. was obtained for normal (inverted) mass ordering and vanishing m0. The zenith distribution of atmospheric neutrino events collected by IceCube was analyzed in [23], where the au-thors showed that it is possible to excludeR&0.40µm at 95% C.L. The above neutrino limits are about two orders of magnitude stronger than those obtained from collider and tabletop gravitational experiments [24]. Astrophys-ical and cosmologAstrophys-ical bounds are often much more strin-gent, but are model-dependent [24]. This paper presents an analysis, sensitive to LED, of the MINOS data set with a low-energyνµmode exposure of 10.56×10²⁰POT and
a peak neutrino energy of 3 GeV.
In the MINOS experiment, neutrinos are produced by directing 120 GeV protons from the Fermilab Main
(km/GeV)
E
/
L -2
10 10-1 1 10 102 103
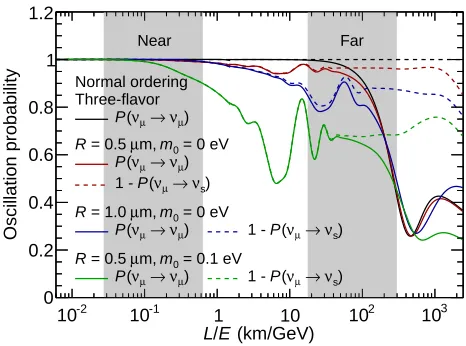
Oscillation probability 0 0.2 0.4 0.6 0.8 1 1.2 Near Far Normal ordering Three-flavor ) µ ν → µ ν ( P
= 0 eV 0 m m, µ = 0.5 R ) µ ν → µ ν ( P ) s ν → µ ν ( P 1 -
= 0 eV 0 m m, µ = 1.0 R ) µ ν → µ ν (
P 1 - P(νµ→νs)
= 0.1 eV 0 m m, µ = 0.5 R ) µ ν → µ ν (
P 1 - P(νµ→νs)
FIG. 2: The oscillation probabilities as a function of L/E, incorporating MINOS energy resolution effects, for the three-flavor case (black line), the same LED scenarios as in Fig. 1 (red and blue lines), and an LED case with non-zerom0(green lines). The baseline and neutrino energy are denoted asLand E, respectively. TheL/E coverage of the Near Detector and Far Detector are represented by the grey bands, which contain 90% of the MINOS data.
jector onto a graphite target. The resulting π and K mesons are focused in the forward direction and charge-sign selected by two magnetic horns after which they de-cay into neutrinos in a 675 m long tunnel. MINOS ob-serves charged current (CC) and neutral current (NC) neutrino events in a Near Detector (ND) and Far De-tector (FD) located 1.04 km and 735 km downstream of the target, respectively, on the NuMI (Neutrinos at the Main Injector) beamline axis [25]. The beam composi-tion at the ND consists of 91.8%νµ, 6.9%νµ, and 1.3%
νe andνe when operating inνµmode. The ND and FD
are tracking-sampling calorimeters built of 2.54 cm thick iron plates interleaved with scintillator planes composed of 1 cm thick, 4.1 cm wide strips, arranged in two alter-nating orthogonal views, and read out using wavelength-shifting fibers coupled to multi-anode photomultiplier tubes. The ND has a 23.7 t fiducial (980 t total) mass. The FD has a 4.2 kt fiducial (5.4 kt total) mass. Us-ing magnetic coils, both detectors are magnetized with a toroidal magnetic field oriented to focus negatively charged particles when operating inνµ mode [26].
A νµ CC-like event (νµN→µX) in the MINOS
detec-tors is characterized by a single outgoing muon track with possible hadronic showers near the event vertex. The muon momentum is determined from the track range for tracks confined within the detector and from the track curvature for exiting tracks. Since no charge separation is applied in this analysis, both νµ and νµ events are
[image:3.612.320.553.52.225.2]energy [27–31]. The CC neutrino energy at the FD is re-constructed with a mean resolution of 17.3% by summing the track and shower energies.
A να NC-like event (ναN→ναX withα = e,µ,τ) in
the ND or FD has a short diffuse hadronic shower and possibly short hadron tracks. The NC event length is required to be shorter than 47 planes. If a hadron track is reconstructed in an event, the track length is required not to exceed the shower length by more than five planes. Additional selection requirements are imposed in the ND to remove cases where reconstruction failed due to high event rates [32, 33]. The NC neutrino energy at the FD is reconstructed with a mean resolution of 41.7% using the calorimetric shower energy.
In the CC selection procedure, separation between CC and NC events is performed by combining four variables describing track properties into a single discriminant vari-able using a kNN algorithm [34, 35]. Only events that failed the NC selection procedure are considered in the CC selection procedure. The selected CC sample has an efficiency (purity) estimated by Monte Carlo (MC) of 53.9% (98.7%) at the ND and 84.6% (99.1%) at the FD. The ND efficiency is low because events occurring near the magnetic coil hole are rejected. NC events are the main background in both detectors [21].
The selected NC sample has an efficiency (purity) es-timated by MC of 79.9% (58.9%) at the ND and 87.6% (61.3%) at the FD. The background composition is 86.9% CC νµ and 13.1% beam CC νe at the ND. Assuming three-flavor oscillation, the backgrounds at the FD are estimated as 73.8% CCνµ, 21.6% CCνe, and 4.6% CC
ντ[21].
The muon neutrino survival probability P(νµ→νµ),
probed by CC events, and the sterile neutrino appear-ance probability P(νµ→νs), probed by a depletion of NC events, are shown as a function of L/E in Fig. 2. The same two LED scenarios as in Fig. 1 and a scenario with non-zerom0 are compared to the three-flavor case. MINOS energy resolution effects [36, 37] were accounted for when calculating the probabilities.
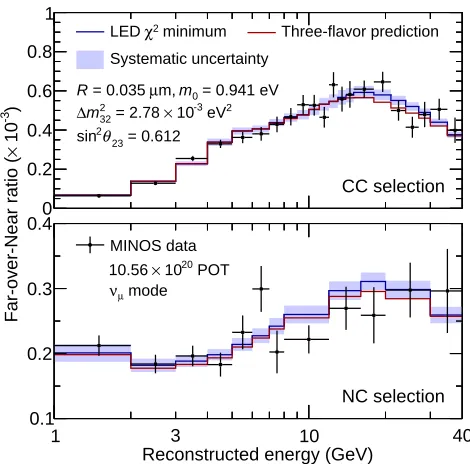
In the MINOS standard oscillation analysis [3], ND data are used to constrain the FD prediction based on the assumption of no oscillations along the ND baseline (black line in Fig. 2). In the LED analysis, this assump-tion is not valid for m0 >30 meV (as illustrated by the green lines in Fig. 2), and a fit is performed to the ratio of the reconstructed FD and ND neutrino energy spectra. This Far-over-Near ratio fit, using a covariance-matrix-basedχ2method [21], allows the analysis to be sensitive to oscillations along the ND and FD baselines and sig-nificantly reduces many systematics affecting both detec-tors. Figure 3 compares the Far-over-Near ratio of the MINOS CC and NC data to the three-flavor predictions and the LED predictions of theχ2 minimum. The good agreement between data and the three-flavor predictions indicates that, if large extra dimensions exist, oscillation
0 0.2 0.4 0.6 0.8 1
minimum 2
χ
LED
Systematic uncertainty
Three-flavor prediction
= 0.941 eV 0
m m,
µ
= 0.035 R
2 eV -3 10
×
= 2.78 32 2 m
∆
= 0.612 23
θ
2 sin
CC selection
Reconstructed energy (GeV)
1 10
0.1 0.2 0.3 0.4
3 40
NC selection
MINOS data POT 20 10
×
10.56 mode µ
ν
)
-3
10
×
[image:4.612.321.556.52.284.2]Far-over-Near ratio (
FIG. 3: The Far-over-Near ratio of the MINOS CC (top) and NC (bottom) data (black points) as a function of the recon-structed neutrino energy. The error bars represent statistical uncertainties. The three-flavor predictions, using the same oscillation parameters as Fig. 1, are shown in red. The LED predictions of theχ2 minimum are shown with their system-atic uncertainty (blue line and band).
between active and KK states must be sub-dominant in MINOS.
The energy window for the fit is set between 0 and 40 GeV, with the CC and NC binning schemes chosen such that the minimum number of FD events in a bin provides a good Gaussian approximation. The CC and NC samples are fitted simultaneously to improve the sen-sitivity. The totalχ2 is the sum of those of the CC and NC samples, with each one given by
χ2=
N
X
i,j=1
(oi−pi)[V−1]ij(oj−pj) +
N
data−NMC σN
2
,
(4) where oi and pi are the observed and predicted
Far-over-Near ratios in energy bin i, respectively, and V is the sum of statistical and systematic covariance matri-ces. The second term is an ND beam flux penalty term, whereNdata(NMC) is the total number of ND data (MC) events, andσN = 50%NMC is adopted as a conservative difference between hadron production measurements and MC calculations [21].
The total covariance matrix is
NC selection (VNC) covariance matrices have the biggest impact on the sensitivity and are discussed below. Other systematics (Vother), including neutrino interaction cross-section uncertainties and NuMI beam flux uncertainties, are small and have a cumulative effect of less than 4% in any energy bin of the Far-over-Near ratio.
The uncertainty on the acceptance and efficiency of the ND for CC and NC events is evaluated by varying event selection requirements in data and MC. Any shift in the data-MC agreement is taken as a systematic uncertainty. The effect on the Far-over-Near ratio of this systematic is energy-dependent, never exceeding 6% (0.6%) for the CC (NC) sample, and includes correlations between different bins.
The normalization systematic is a consequence of the detector differences between ND and FD, including ma-terial dimensions, detector live time, and reconstruction efficiencies. It has a uniform uncertainty on the Far-over-Near ratio of 1.6% (2.2%) for the CC (NC) sample.
The matrix VNC accounts for the uncertainty on the selection procedure that reduces the number of poorly-reconstructed NC events, defined as those events with reconstructed energy less than 30% of the true energy. To improve data-MC agreement, the fraction of poorly reconstructed events in the simulation is varied in a tem-plate fit to the selection variables. The selection cuts are then adjusted to yield the same number of rejected events in data and MC. The variations seen in the NC energy spectra from this procedure are taken as a systematic uncertainty. In the Far-over-Near ratio, this uncertainty varies from 5% at 1 GeV to 1% at 10 GeV.
In minimizing the χ2 in the (R, m
0) plane, θ23 and ∆m2
32 are free to vary in the fit. The four-dimensional parameter space is divided into 51×51×26×51 bins and has ranges
10−8,10−6
m,
10−3,1
eV, [0, π/2], and
0,5×10⁻³
eV2forR,m0,θ23, and ∆m232, respectively. The Far-over-Near ratio is calculated at each bin center and multilinear interpolation is used to obtain the Far-over-Near ratio at other points in the parameter space. Two initialθ23 hypotheses, one in each octant, are used in the fit. Since the mass ordering was shown to have lit-tle effect on the MINOS sensitivity [16, 21], only normal ordering is considered in this analysis. The parameters ∆m221, θ12, θ13, and δCP are fixed to the values shown in Fig. 1. CPT symmetry is assumed, implying identical
ν and ν oscillation parameters [40, 41]. The 90% C.L. sensitivity contour and the cumulative effect of the sys-tematics are shown in Fig. 4. The sensitivity is calculated using three-flavor simulated data generated for the oscil-lation parameter values shown in Fig. 1.
The Feldman-Cousins technique [42] is used to ob-tain the 90% C.L. data contour shown in Fig. 5. A shal-low global minimum is found at R = 0.035µm, m0 = 0.941 eV, sin2θ23 = 0.612, and ∆m232= 2.78×10⁻³eV
2
withχ2
3-flavor−χ2LED = 1.23. No evidence for large extra dimensions is found. In the limit of a vanishing
light-m) µ (
R
(eV)0
m
-3
10
-2
10
-1
10 1
Statistics
+ Acceptance
+ Normalization
+ NC selection
+ Other
MINOS sensitivity 90% C.L. Normal ordering
POT 20 10
×
10.56
mode µ
ν
excluded region CC + NC
[image:5.612.320.556.52.224.2]0 0.2 0.4 0.6 0.8
FIG. 4: The cumulative effect of the systematics on the 90% C.L. sensitivity contour based on 10.56×10²⁰POT MC and assuming normal mass ordering. The large extra dimen-sion size and the smallest neutrino mass are denoted as R andm0, respectively. The shaded area indicates the excluded region to the right of the contour.
m) µ (
R
(eV)0
m
-3
10
-2
10
-1
10 1
Feldman-Cousins 90% C.L. MINOS data
Normal ordering
POT 20 10
×
10.56
mode µ
ν
excluded region CC + NC
0 0.2 0.4 0.6 0.8
FIG. 5: The 90% C.L. data contour for the LED model, obtained using the Feldman-Cousins technique, based on 10.56×10²⁰ POT MINOS data and assuming normal mass ordering. The large extra dimension size and the smallest neutrino mass are denoted asR and m0, respectively. The shaded area indicates the excluded region to the right of the contour.
est neutrino mass, the large extra dimension size is con-strained to be smaller than 0.45µm at 90% C.L. To date, this is the strongest limit on this large extra dimension model [15, 16] reported by a neutrino oscillation experi-ment.
[image:5.612.320.557.316.484.2]Com-puting Center at The University of Texas at Austin for the provision of computing resources. We wish to thank P. A. N. Machado for providing insightful comments on the LED model.
∗
Now at South Dakota School of Mines and Technology, Rapid City, South Dakota 57701, USA.
†
Deceased.
‡
Now at Lancaster University, Lancaster, LA1 4YB, UK. [1] Y. Ashieet al.(Super-Kamiokande Collaboration), Phys. Rev. Lett. 93, 101801 (2004); Phys. Rev. D71, 112005 (2005).
[2] B. Aharmim et al.(SNO Collaboration), Phys. Rev. C
72, 055502 (2005).
[3] D. G. Michaelet al.(MINOS Collaboration), Phys. Rev. Lett.97, 191801 (2006); P. Adamsonet al.(MINOS Col-laboration), Phys. Rev. D77, 072002 (2008); Phys. Rev. Lett.112, 191801 (2014).
[4] T. Arakiet al. (KamLAND Collaboration), Phys. Rev. Lett.94, 081801 (2005).
[5] C. Arpesellaet al.(Borexino Collaboration), Phys. Rev. Lett.101, 091302 (2008).
[6] M. H. Ahnet al.(K2K Collaboration), Phys. Rev. D74, 072003 (2006).
[7] F. P. An et al. (Daya Bay Collaboration), Phys. Rev. Lett. 108, 171803 (2012); J. K. Ahnet al.(RENO Col-laboration), Phys. Rev. Lett.108, 191802 (2012). [8] B. Pontecorvo, Sov. Phys. JETP7, 172 (1958); Z. Maki,
M. Nakagawa, and S. Sakata, Prog. Theor. Phys.28, 870 (1962); V. N. Gribov and B. Pontecorvo, Phys. Lett. B
28, 493 (1969).
[9] L. Wolfenstein, Phys. Rev. D 17, 2369 (1978); S. P. Mikheyev and A. Yu. Smirnov, Sov. J. Nucl. Phys.
42, 913 (1985).
[10] N. Arkani-Hamed, S. Dimopoulos, and G. R. Dvali, Phys. Lett. B429, 263 (1998); I. Antoniadis, N. Arkani-Hamed, S. Dimopoulos, and G. R. Divali, Phys. Lett. B
436, 257 (1998); N. Arkani-Hamed, S. Dimopoulos, and G. R. Dvali, Phys. Rev. D59, 086004 (1999).
[11] P. Minkowski, Phys. Lett. B 67, 421 (1977); M. Gell-Mann, P. Ramond, and R. Slansky, in Supergravity, p. 315, edited by F. Nieuwenhuizen and D. Freedman, North Holland, Amsterdam, 1979; T. Yanagida, Pro-ceedings of the Workshop on Unified Theory and Baryon Number in the Universe, edited by O. Sawada and A. Sugamoto, KEK, Tsukuba, Japan, 1979; R. N. Moha-patra and G. Senjanovi´c, Phys. Rev. Lett.44, 912 (1980). [12] N. Arkani-Hamed, S. Dimopoulos, G. R. Dvali, and
J. March-Russell, Phys. Rev. D65, 024032 (2002). [13] R. Barbieri, P. Creminelli, and A. Strumia, Nucl. Phys.
B585, 28 (2000).
[14] R. N. Mohapatra, S. Nandi, and A. P´erez-Lorenzana, Phys. Lett. B 466, 115 (1999); R. N. Mohapatra and A. P´erez-Lorenzana, Nucl. Phys. B 576, 466 (2000); R. N. Mohapatra and A. P´erez-Lorenzana, Nucl. Phys.
B593, 451 (2001).
[15] H. Davoudiasl, P. Langacker, and M. Perelstein, Phys. Rev. D65, 105015 (2002).
[16] P. A. N. Machado, H. Nunokawa, and R. Zukanovich Funchal, Phys. Rev. D84, 013003 (2011).
[17] F. P. Anet al.(Daya Bay Collaboration), Phys. Rev. D
90, 071101(R) (2014).
[18] J. H. Choi et al. (RENO Collaboration), arXiv:1511.05849 [hep-ex].
[19] Y. Abeet al.(Double Chooz Collaboration), J. High En-ergy Phys.1410, 086 (2014) [J. High Energy Phys.1502, 074 (2015)].
[20] F. Capozziet al., Phys. Rev. D89, 093018 (2014). [21] J. Huang, Ph.D. Thesis, University of Texas at Austin
(2015), FERMILAB-THESIS-2015-06.
[22] P. Huber, M. Lindner, and W. Winter, Comput. Phys. Commun. 167, 195 (2005); P. Huber et al., Comput. Phys. Commun.177, 432 (2007).
[23] A. Esmaili, O. L. G. Peres, and Z. Tabrizi, J. Cosmol. Astropart. Phys.12, 002 (2014).
[24] K. A. Oliveet al.(Particle Data Group), Chin. Phys. C
38, 090001 (2014).
[25] P. Adamson et al. (MINOS Collaboration), Nucl. In-strum. Meth. A806, 279 (2016).
[26] D. G. Michaelet al.(MINOS Collaboration), Nucl. In-strum. Meth. A596, 190 (2008).
[27] T. M. Cover and P. E. Hart, IEEE Trans. Inf. Theory
13, 21 (1967).
[28] J. L. Bentley, Commun. ACM18, 509 (1975).
[29] J. S. Marshall, Ph.D. Thesis, University of Cambridge (2008), FERMILAB-THESIS-2008-20.
[30] P. Adamsonet al. (MINOS Collaboration), Phys. Rev. Lett106, 181801 (2011).
[31] C. J. Backhouse, Ph.D. Thesis, University of Oxford (2012), FERMILAB-THESIS-2011-17.
[32] G. Tinti, Ph.D. Thesis, University of Oxford (2010), FERMILAB-THESIS-2010-44.
[33] P. Adamsonet al. (MINOS Collaboration), Phys. Rev. Lett.107, 011802 (2011).
[34] R. Ospanov, Ph.D. Thesis, University of Texas at Austin (2008), FERMILAB-THESIS-2008-04.
[35] J. S. Y. M. Ratchford, Ph.D. Thesis, University of Texas at Austin (2012), FERMILAB-THESIS-2012-40. [36] M. Kordosky, Ph.D. Thesis, University of Texas at
Austin (2004), FERMILAB-THESIS-2004-34.
[37] J. S. Mitchell, Ph.D. Thesis, University of Cambridge (2011), FERMILAB-THESIS-2011-54.
[38] M. Bonesini, A. Marchionni, F. Pietropaolo, and T. Tabarelli de Fatis, Eur. Phys. J. C20, 13 (2001). [39] C. Alt,et al.(NA49 Collaboration), Eur. Phys. J. C49,
897 (2007).
[40] P. Adamsonet al. (MINOS Collaboration), Phys. Rev. Lett108, 191801 (2012).
[41] S. V. Cao, Ph.D. Thesis, University of Texas at Austin (2014), FERMILAB-THESIS-2014-07.