In this paper an electron microscopic image of diameter 80 - 120 nm and of dimensions 180 × 220 pixels is used as a test object to fabricate Fresnel zone plate hologram. The author proposes a different set of pupils: one pupil still being a delta function and the other being a function of <
> = sqrt(x2 + y2). The obtained re-constructed images in case of scanning holography are investigated.Keywords:Scanning Holography, Linear Apertures
1. Introduction
The pioneer work of digital holography or computer-gene- rated hologram (CGH) was early proposed by Good- man, et al. [1] and Lohmann, et al. [2], and numerical hologram reconstruction was initiated by Kronrod et al. [3] in the early 1970 followed by many other authors. Improved reconstructed images from CGH are obtained using an iterative operations [4]. Recently, the possibili-ties of reconstructing the hologram structure and image from a digitally recorded specklegram without reference beam has been considered separately by Hamed [5] and Gorbatenko, et al. [6]. Also, improved reconstructed im-age from digital Fourier holograms is attained using su-perposition of reconstructed images obtained by multiple wavelengths [7] and separately using a two-step only qua- dratic phase shifting holography [8] where neither the re- ference—wave intensity nor an object-wave intensity measurement is needed in this technique.
The idea of holographic recording accomplished by het-erodyne scanning was originally proposed by Poon [9-11]. And heterodyne scanning was accomplished using a two- pupil optical system Lohmann and Rhodes [12]. They real-ized Fresnel-zone-plate-type impulse response, i.e. its phase is a quadratic function of x and y, in and out-of focus plane near the focal plane of lenses L1 and L2. In a precedent pro-posed work by Poon, one of the pupils is a delta function and the other has a constant uniform circular aperture.
The original idea, which was later analyzed and called scanning holography [13], is to scan the 3-D object in a 2 -D raster with a complex Fresnel zone plate—type
im-pulse response created by interference of a point source and a plane wave emerging from each pupil. A temporal frequency offset is introduced between the two pupils and the desired signal from a spatially integrating detec-tor is obtained using a heterodyne detection.
In the present study, the author investigates scanning holographic imaging based on two-pupil heterodyne detec-tion. In the original standard system proposed by Poon, one of the pupils is a delta function and the other a constant.
In the present case, the author proposes a different set of pupils: one pupil still being a delta function and the other being a function of
= sqrt (x2 + y2). The simu-lated reconstructed images using the above technique of heterodyne detection are investigated. The proposal of the linearly modulated aperture [5] was investigated in a re- cent article of modulated speckle images.2. Theoretical Analysis
2.1. A Two-Pupil Heterodyne Scanning Hologram
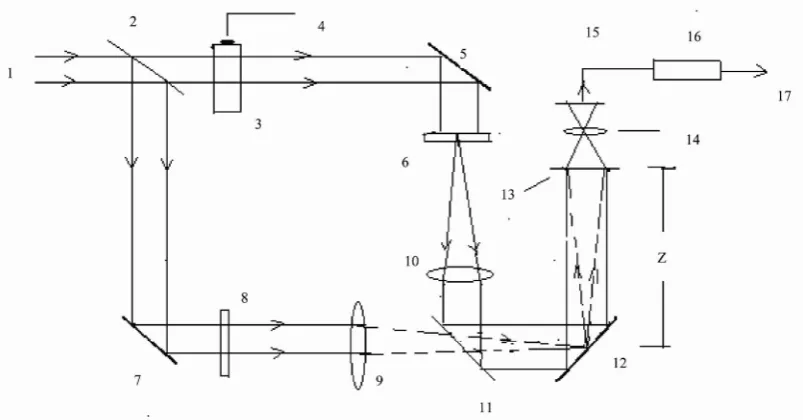
The optical scanning hologram is based on two—pupil heterodyne detection as shown in Figure 1. In this study, the 1st pupil is chosen to be a linear function distributed within the circular frame of diameterD20.
1
0
, ; 1 for linear aperture
P x y (1)
53
Figure 1. A two-pupil optical heterodyne scanning system. 1-Laser operating at frequencyω0; 2,11-beam splitters; 3-
acousto-optic frequency shifter; 4-cos Ω t giving a modulated frequency signal at ω0 + Ω; 5,7-reflecting mirrors; 2,5,7,11-form
the Mach-Zehnder interferometer; 6,8-are two-pupils one pupil being a delta function and the other being a linear function of ρ; 9,10-are two converging lenses where the two pupils are located at the front focal planes of lenses L1 and L2, both with a focal
length of f; 12-two dimensional scanning mirror; 13-object transparency; 14-Collector lens; 15-photo-detector; 16-electronic band pass filter tuned at the heterodyne frequency Ω; 17-output of scanned and processed current iΩ (x,y).
2( , ) ,
P x y x y (2) The Fourier transform of Equation (1) is previously computed as follows [14]:
1
0
1 2 2
2
. i
i
J k J k
P k const J k
k k k
(3)J0, J1 areBessel functions of zero and first orders. The optical transfer function is obtained as [10]:
x, ;y
OTF k k z
2 2 *
1 2
0 0
0
exp ( ) ,
2
ex d '
,
p d
x y x
y x y
jz k k P P x f k y
k k
f z
k j x k y k x y
k f x y
(4)In the present work, we have assumed linear function for the 1st pupil and the same delta function for the 2nd pupil is used, hence substitute from (1) and (2) in Equa-tion (4), we can write the OTF as follows:
x, ;y
OTF k k z
2 2 2 2
0 0
0
exp ( ) ,
2
exp d d
x y x
y x y
jz k k x f k y
x y
k k
f k j z x k y k x y
k f
(5)This equation can be rewritten symbolically as follows:
2 20
2 2
0 0
, ; exp ( ) . .
2 ,
x y x y
x y
jz
OTF k k z k k F T
k
f f
x y x k y k
k k (6)
Since the Fourier transform of multiplication product is transformed into a convolution product of the Fourier spec-trum of each function [15], then Equation (6) becomes
2 2
2 2
0
0 0
, ; exp ( ) . .
2
* . . ,
x y x y
x y
jz
OTF k k z k k F T x y
k
f f
F T x k y k
k k (7)
The Fourier transform of a shifted delta function is calculated to give this result:
2 2
0 0 0
. f x, f y exp jz x y
F T x k y k k k
k k k
(8)
Substitute from Equation (8) to Equation (7), we obtain:
2 2
0
2 2 2 2
0
, ; exp ( )
2
. . * exp
x y x y
x y
jz
OTF k k z k k
k
jz
F T x y k k
k (9)
It is shown that the F.T. of the linear function p1(x,y) =
From the properties of convolution product of a func-tion with a delta funcfunc-tion leave it unchanged, then Equa-tion (11)is reduced to the OTF of Poon [13]to give:
2 2
0 , ; exp
2
x y x y
jz
OTF k k z k k
k
; Poon’s result (12)
The intensity distribution of the complex optical scan-ning hologram, obtained in case of uniform circular ap-erture for the 1st pupil and delta function for the 2nd pupil, is represented as :
, cos
, sin
,c
H x y H x y j H x y
2 0 0
2 2
0
, ; * exp d
2 2
D
jk x y
jk
x y z z
z z
(13)Where
2 0 0
2 2
cos , 0 , ; * cos d
2 2
D
k x y
k
H x y x y z z
z z
(14)
2 0 0
2 2
sin , 0 , ; * sin d
2 2
D
k x y
k
H x y x y z z
z z
(15)While in case of the linear pupil combined with the delta function for the 2nd pupil, the intensity distribution of the complex optical scanning hologram is written as follows:
2 0 0
2 2
0
2 2
0 0
, , ; * exp *
2 2
, d
c D
x y
jk x y jk
H x y x y z
z z
f f
x y x k y k z
k k
(16)3. Results and Discussion
The original image of dimensions 180 × 220 pixels is plotted as shown in Figure 2. The actual dimension of
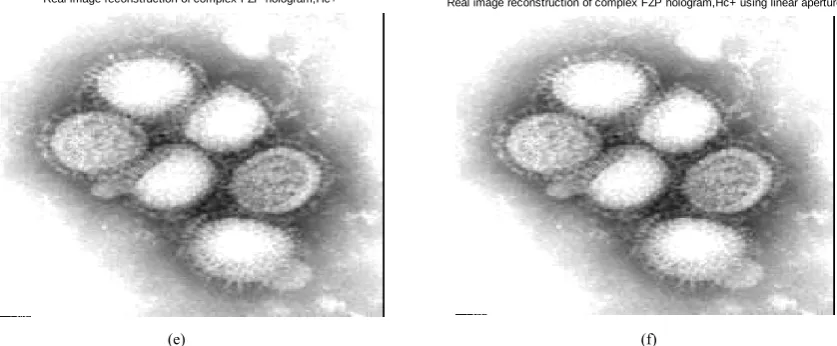
Figure 5(b) is better in resolution than the reconstructed image obtained from the sine FZP hologram using circular uniform pupil Figure 5(a). This improvement in image resolution is attributed due to the resolution improvement occurred for apodized linear pupils [5,14] as compared with the constant uniform circular pupils. The image pro-file of the original image of H1N1 virus is shown as in Figure 6(a) while the image profile of the sine FZP re-constructed image, is shown in Figure6(b) and the image profile of the sine FZP reconstructed image using linear amplitude aperture is shown in Figure 6(c). Also, image profile of the cosine FZP reconstructed image is repre-sented in Figure 6(d), image profile of the cosine FZP reconstructed image using linear amplitude modulation is shown in Figure 6(e), image profile of the complex FZP reconstructed image is shown in Figure 6(f), and the im-age profile of the complex FZP reconstructed imim-age using linear amplitude modulation is shown in Figure 6(g). All image profiles represented in Figures 6(a)-(g) are taken at slice x = [12,127,575] and slice y = [1,180,100,100].
20 40 60 80 100 120 140 160 180 20 40 60 80 100 120 140 160 180 200
Figure 2. Electron microscope image of the reasserted H1N1
55
Figure 3. The auto-correlation intensity of the H1N1 image
[image:4.595.59.286.78.261.2]shown in Figure 2. The correlation image has dimensions of 180 × 220 pixels.
Figure 4. A cosine FZP hologram using two pupil model with one of linear distribution while the other remains the same pinhole aperture.
Reconstruction of sine-FZP hologram
Reconstruction of sine-FZP hologram using linear aperture
(a) (b)
Reconstruction of cosine-FZP hologram
Reconstruction of cosine-FZP hologram using linear aperture
(e) (f)
Figure 5. (a) Reconstruction of the sine-FZP hologram computed using two-pupils heterodyne detection, where the 1st pupil is
uniform circular and the 2nd is a delta function; (b) Reconstruction of the sine-FZP hologram computed using two-pupils
heterodyne detection, where the 1st pupil is linearly distributed while the 2nd remains a unchanged (delta function); (c)
Re-construction of the cosine-FZP hologram computed using two- pupils heterodyne detection, where the 1st pupil is uniform
circular and the 2nd is a delta function; (d) Reconstruction of the cosine-FZP hologram computed using two-pupils
hetero-dyne detection , where the 1st pupil is linearly distributed while the 2nd remains a unchanged (delta function); (e)
Reconstruc-tion of the complex-FZP hologram computed using two-pupils heterodyne detecReconstruc-tion, where the 1st pupil is uniform circular
and the 2nd is a delta function; (f) Reconstruction of the complex-FZP hologram computed using two-pupils heterodyne
de-tection, where the 1st pupil is linearly distributed while the 2nd remains a unchanged (delta function).
(a) (b)
[image:5.595.91.510.86.259.2]
57
(e) (f)
(g)
Figure 6. (a) Image profile of the original image of H1N1 virus at slice x = [12,127,575] and slice y = [1,180,100,100]; (b) Image
profile of the sine FZP reconstructed image at slice x = [12,127,575] and slice y = [1,180,100,100]; (c) Image profile of the sine
FZP reconstructed image at slice x = [12,127,575] and slice y = [1,180,100,100] using linear amplitude modulation; (d) Image
profile of the cosine FZP reconstructed image at slice x = [12,127,575] and slice y = [1,180,100,100]; (e) Image profile of the
cosine FZP reconstructed image at slice x = [12,127,575] and slice y = [1,180,100,100] using linear amplitude modulation; (f)
Image profile of the complex FZP reconstructed image at slice x = [12,127,575] and slice y = [1,180,100,100]; (g) Image profile
of the complex FZP reconstructed image at slice x = [12,127,575] and slice y = [1,180,100,100] using linear amplitude
modula-tion.
4. Conclusions
Firstly, we conclude that the complex FZP hologram gives better resolution for the reconstructed images as compared with the reconstructed images obtained from the sine and cosine FZP holograms.
Secondly, the reconstructed images in case of the sine- FZP hologram provided with linearly modulated aperture is better in resolution than the reconstructed images ob-tained in case of uniform circular pupil. This resolution improvement of the reconstructed holographic images in case of linear pupils is due to the sharp distribution of the PSF obtained in case of linear pupils as compared with the corresponding PSF obtained for circular uniform aperture.
5. References
[1] J. W. Goodman and R. W. Lawrence, “Digital Image For-mation from Electronically Detected Holograms,” Applied Physics Letters,Vol. 11, No. 1, 1967, pp. 77-79.
doi:10.1063/1.1755043
[2] A. W. Lohmann and D. P. Paris, “Binary Fraunhoffer Holograms, Generated by Computer,” Applied Optics, Vol. 6, No. 10, 1967, pp. 1739-1748.
doi:10.1364/AO.6.001739
[3] M. A. Kronrod and L. Yaroslavsky, “Reconstruction of a Hologram with Computer,” Soviet Physics: Technical Physics, Vol. 17, No. 2, 1972, pp. 329-332.
[image:6.595.74.522.74.434.2]D38-D43.doi:10.1364/AO.47.000D38
[8] J. P. Liu and T. C. Poon, “Two-Step-Only Quadrature Phase Shifting Digital Holography,” Optics Letters, Vol. 34, No. 3, 2009, pp. 250-252.doi:10.1364/OL.34.000250
[9] T. C. Poon,“Scanning Holography and Two-Dimensional Image Processing by Acousto-Optic Two-Pupil
Synthe-[14] A. M. Hamed, ”Image and Super-Resolution in Optical Coherent Microscopes,” Optik, Vol. 64, No. 4, 1983, pp. 277-284.

![Figure 6. (a) Image profile of the original image of H1profile of the cosine FZP reconstructed image at slice profile of the sine FZP reconstructed image at slice N1 virus at slice x = [12,127,575] and slice y = [1,180,100,100]; (b) Image x = [12,127,575]](https://thumb-us.123doks.com/thumbv2/123dok_us/9059459.402260/6.595.74.522.74.434/figure-profile-original-profile-reconstructed-profile-reconstructed-image.webp)
