Published by
Published by
Three-photon light-sheet fluorescence microscopy
A
DRIÀE
SCOBET-M
ONTALBÁN1, F
EDERICOM. G
ASPAROLI1, J
ONATHANN
YLK1, P
ENGFEIL
IU1,
Z
HENGYIY
ANG1,+,
ANDK
ISHAND
HOLAKIA1,*1SUPA, School of Physics and Astronomy, University of St Andrews, North Haugh, Fife, KY16 9SS, UK
+Present address: Electron Bio-Imaging Centre, Diamond Light Source, Harwell Science and Innovation Campus, Didcot, OX11 0DE, UK *Corresponding author: [email protected]
Compiled October 5, 2018
We present the first demonstration of three-photon exci-tation light-sheet fluorescence microscopy. Light-sheet fluorescence microscopy in single- and two-photon modes has emerged as a powerful wide-field, low photo-damage technique for fast volumetric imaging of biological samples. We extend this imaging modal-ity to the three-photon regime enhancing its penetra-tion depth. Our present study uses a standard con-ventional femtosecond pulsed laser at 1000 nm wave-length for the imaging of 450 µm diameter cellular spheroids. In addition, we show, experimentally and through numerical simulations, the potential advan-tages in three-photon light-sheet microscopy of using propagation-invariant Bessel beams in preference to Gaussian beams.
OCIS codes: (110.0180) Microscopy; (190.4180) Multiphoton processes; (180.2520) Fluorescence microscopy; (180.4315) Nonlinear microscopy; (180.6900) Three-dimensional microscopy;
http://dx.doi.org/10.1364/XX.XX.XXXXXX
Over the last two decades, the field of fluorescence mi-croscopy has witnessed remarkable developments including super-resolution and fast volumetric imaging among many other innovations. However, a key remaining challenge is to perform imaging in situations where the scattering of light limits the pen-etration and performance of optical microscopy. This is crucial for imaging minute details of live biological samples at depth, without compromising their viability.
To increase depth penetration, multiphoton microscopy has come to the fore particularly in the form of two-photon (2P) excitation microscopy which has become the approach of choice forin vivoimaging [1,2]. Recently, three-photon (3P) excitation
microscopy with either point scanning [3] or with temporal
focusing [4] has been employed to excite fluorophores with
close to diffraction limited resolution into biological tissue for a greater penetration depth. Compared to standard single-photon (1P) or 2P excitation, 3P has several benefits: the use of longer wavelengths reduces the effects of light scattering, increasing the
penetration depth of the illumination beam into the sample [3,
5]. Moreover, the nonlinear nature of the process confines the
excitation to a smaller volume, reducing out-of-focus light as
well as minimizing photo-bleaching on the biological sample [3,
6].
In parallel, the geometry used in light-sheet fluorescence microscopy (LSFM) has revolutionized the field of imaging by using a thin sheet of light to optically section samples which are typically transparent. In this technique, fluorescent light emitted by the sample is collected by a detection imaging system that is perpendicular to the illuminated plane. This particular config-uration results in improved contrast and high axial resolution with very short acquisition times because it avoids scanning a
focused beam across the field-of-view (FOV) [7]. In addition, as
only the plane of interest is illuminated during a single exposure, photo-toxicity is vastly reduced. This makes LSFM very
attrac-tive for long term live imaging of biomedical samples [8,9]. At
the same time, the FOV can be increased in LFSM notably by using propagation invariant light fields such as Bessel and Airy beams [10,11].
In this letter, we present the first demonstration of LSFM using 3P excitation. Our goal in the present work is to provide an approach to achieve greater imaging depths for biomedical imaging and explore advantages over the 2P counterpart in this particular imaging mode. The majority of research in the field of 3P microscopy has been performed using ultrashort pulsed lasers in imaging windows centered around wavelengths of 1300 nm and 1700 nm with pulse duration and repetition rate below 70 fs and 1.25 MHz [3–5,12–14], respectively. In this study we use a conventional Ti:Sapphire ultrashort pulsed laser (Coherent Chameleon Ultra II, central wavelength tunable between 680 nm and 1080 nm, 140 fs pulse duration, 80 MHz repetition rate), normally used for 2P microscopy, to generate 3P excitation of flu-orophores with 1P absorption peaks in the violet and UV region
of the spectrum (λ< 400 nm), including a PUREBLU™ Hoechst
33342 dye (Bio-Rad) and blue fluorescing polymer microspheres (B0100, 1 µm, Duke Scientific). The long pulse duration and high repetition rate compared to more conventional 3P laser sources results in less efficient 3P excitation and consequently higher average power delivered into the sample, which may re-sult in increased photo-damage. However, these widely tunable sources readily allow a comparative study between 2P and 3P microscopy with a single laser source. In this investigation we do not focus on the optimization of 3P excitation efficiency.
illumina-Published by
for the blue fluorescing beads and PUREBLU™ Hoechst 33342 dye, respectively. Additionally, their emission spectra were mea-sured and compared to 1P excitation at a laser wavelength of 405 nm (Melles Griot), showing good overlap and corroborating the presence of a 3P signal.
An openSPIM-style, digitally scanned light-sheet
fluores-cence microscope [16,17] was implemented for this
investi-gation. The ultrashort pulsed laser beam was expanded to illu-minate a single-axis galvanometric mirror (Thorlabs) driven by a triangular wave (Aim-TTi). A virtual light sheet was generated inside the sample chamber by relaying the scanning mirror onto the back aperture of the illumination objective (Nikon, 10x/0.3 numerical aperture (NA), 3.5 mm working distance (wd), water-dipping). Based on measurements of the beam size at the back aperture of the objective, the NA of the light sheet was
deter-mined to be 0.17±0.01. Samples were held from above and
accurately positioned using a XYZ linear translation stage (New-port). Stacks of images were acquired by stepwise motion of the sample across the light sheet using a motorized actuator (PI). Fluorescence was collected perpendicularly to the illumination plane by a second objective lens (Olympus, 20x/0.5 NA, 3.5 mm wd, water-dipping). A 400 mm tube lens (Thorlabs) focused the light on a water-cooled sCMOS camera (ORCA-Flash4.0, HAMAMATSU), yielding a magnification of 40x. Two fluores-cence filters (FF01-680/SP, FF01-468/SP, Semrock) were used to block scattered light from the illumination laser and also reject possible undesired 2P signal emitted at longer wavelengths. The microscope can be operated at 2P as well as at 3P by tuning the laser wavelength.
For showing the capability of 3P-LSFM, our first demonstra-tion imaged 1 µm diameter blue fluorescing beads embedded in 1.5 % agarose in a FEP (Fluorinated Ethylene Propylene) cap-illary. Stacks of images were acquired at steps of 0.25 µm and the performance of the system was compared to 2P. The aver-age laser power was adjusted for each experiment in order to achieve the same maximum intensity values on the camera in both imaging modalities to perform fair comparisons. The laser power available on the sample for the 3P excitation experiments with Gaussian beam illumination at 1000 nm was 259 mW while in the 2P experiments a power of 9.5 mW at a wavelength of 700 nm generated the same fluorescence intensity.
Maximum intensity projections in the axial direction clearly show the intrinsic optical sectioning capability of LSFM (Fig.
1(a, b)). The full width at half maximum (FWHM) of the point
spread function (PSF) was measured in various images
obtain-ing an axial resolution of 1.66±0.10 µm and 1.59±0.15 µm for
3P and 2P, respectively (Fig.1(c)). Approximately, the same axial
resolution is achieved in both modalities even using different illumination wavelengths due to the highly confined excitation of the 3P process. The FOV of a light-sheet microscope is usually defined as twice the Rayleigh range of the illumination beam, i.e. the propagation range in which the beam width remains less
than√2 times its minimum size. However, in 3P, the light sheet
remains thinenoughwell beyond the expected Rayleigh range
due to the properties of the higher order nonlinear excitation process. Consequently, the usable FOV was defined based on the edge-to-edge drop in fluorescence intensity in a 1/e-dependent
1/e 52.3 13.7 54.6 5.4 63.6 2.6 N o rma liz e d In te n si ty FW H M [ μ m ] 2.35 1.59
x [μm] x [μm]
2P
2.24
[image:3.612.315.564.48.178.2]1.66
Fig. 1.Comparison between 2P- and 3P-LSFM. Axial
maxi-mum intensity projections of 3D stacks of images of 1 µm blue
fluorescing microspheres embedded in agarose under (a) 2P excitation at 700 nm and (b) 3P excitation at 1000 nm. Scale
bar, 10 µm. x-axis: beam propagation; z-axis: optical axis of
detection lens. (c) Statistical estimates of the axial resolution and FOV based on FWHM. (d) Statistical estimate of the FOV based on 1/e drop in fluorescence intensity.
manner (Fig.1(d)). Furthermore, the tighter excitation
confine-ment of 3P compared to 2P results in much reduced fluorescence excitation outside the FOV along the propagation direction of
the light sheet. For instance, in 3P the usable FOV is 54.6±
5.4 µm and the total fluorescence excitation is contained within only 80 µm along the light sheet. In contrast, in 2P the usable
FOV is 52.3±13.7 µm but fluorescence excitation extends up
to 140 µm, resulting in additional background fluorescence and photo-damage outside the FOV. It should also be noted that chromatic aberrations in the illumination path make the beam shift both transversally and longitudinally when switching be-tween 3P and 2P. Such strong chromatic aberrations should be accounted for and corrected if simultaneous multicolor
experi-ments are to be performed [18].
The feasibility of using 3P-LSFM for biomedical applications
is demonstrated by imaging cellular spheroids of≈450 µm in
diameter. Human Embryonic Kidney cells (HEK 293 T17) were plated in an ultra-low attachment 96-well round bottom cell culture plate (Corning® Costar® 7007) and grown for 48 hours. After the spheroids were formed, their outer layer was labelled with the PUREBLU™ Hoechst 33342 nuclear staining dye (Fig.
2). Spheroids were embedded in 1% agarose in a FEP
capil-lary. Stacks of images with 0.5 µm spacing were acquired and 3D images were rendered to show the imaging capabilities of the microscope (Visualization 1). Single 3P slices in the XY
and YZ planes are shown in Fig. 2(b, c). In order to assess its
performance at depth in scattering samples, the near and far surfaces of the spheroid with respect to the illumination light
sheet (blue and red rectangles in Fig. 2(a), respectively) were
imaged first for 2P and then for 3P. Stacks were acquired with the same exposure time and the laser power was adjusted to gen-erate equivalent fluorescent signal in the two modalities. Image quality was quantified by measuring the contrast-to-noise ratio
(CNR) at various positions in the images [19]. Near the surface,
both modalities show the same image quality with similar CNR
values as expected (Fig.2(d, f)). However, at the far surface of
the spheroid, 2P-LSFM shows a dramatic drop in image quality
(Fig. 2(e)) while 3P-LSFM still preserves high contrast due to
the use of a longer wavelength (Fig.2(g)). The CNR in 2P drops
Published by
Fig. 2.HEK 293 T17 cellular spheroids labeled with PURE-BLU™ Hoechst 33342 nuclear staining dye imaged with
2P-and 3P-LSFM. (a) Brightfield image of a spheroid (diameter≈
450µm). The blue and red rectangles represent the near and
far surfaces of the spheroid with respect to the light-sheet illu-mination direction (black arrow). (b, c) Single XY and YZ near-surface planes (blue rectangle in (a)) imaged with 3P-LSFM. (d-g) Single XY planes imaged with 2P- (d, e) and 3P-LSFM in both the near (d, f) and far-surface (e, g). The 3D rendering of the image stacks acquired in both 2P and 3P can be found inVisualization 1. (h, i) Fluorescence intensity profiles along the yellow lines highlighted in (d-g). Average power on the sample for 2P and 3P was 9.5 mW and 259 mW, respectively. Brightfield image scale bar, 100 µm; Fluorescence images scale bar, 50 µm.
it only decreases by 15%. Line profiles in Fig.2(h, i) show the
clear improvement in contrast of 3P compared to 2P in imaging
at depth (see alsoVisualization 1).
To compare our results with theoretical expectations, light-sheet profiles for 2P and 3P were numerically modeled using Fourier beam propagation. In all cases, the following parameters
were used: NA=0.17,λ1P=405 nm,λ2P=700 nm andλ3P=
1000 nm. Our simulations of Gaussian light sheets predicted resolutions (given by the FWHM of the light-sheet profile) of 1.5
µm and 1.7 µm and FOV (based on 1/e drop in intensity) of 48
µm and 58µm for 2P and 3P respectively, which is in agreement
with the experimental results (Fig.1).
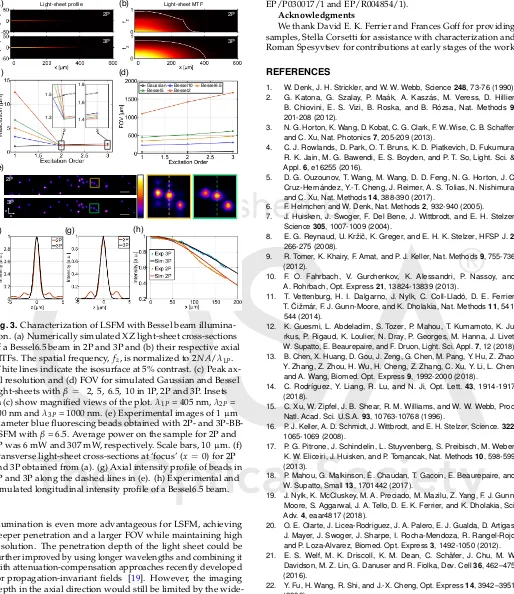
Numerical modeling also facilitated exploration of other beam types for 3P-LSFM. Bessel beams have been shown to have much better properties for light-sheet imaging in 2P than
1P [11,20]. So we also compared Bessel beam illumination for
3P light-sheet fluorescence microscopy (3P-BB-LSFM). Bessel beams were generated by a thin annulus in the pupil plane of
the illumination objective [11]. We define Besselβto denote a
Bessel beam generated by an annular ring whereβis the
percent-age thickness of the outer radius of the ring. Figure3(a) shows
the cross-sectional light-sheet profiles for a Bessel6.5 beam in 2P and 3P. Due to the extended transverse profile of the Bessel beam, it is not suitable to measure the FWHM to indicate resolu-tion, therefore this was determined from the axial modulation transfer function,MTFz(fz,x) =Fz(LS(z,x)), whereLS(x,z)
is the light-sheet cross-section andFzdenotes the 1D Fourier
transform along the axial direction (Fig. 3(b)). The MTF
con-cisely represents information of both resolution and contrast. We set a practical noise-floor at 5% contrast to determine the
maximum axial resolution, which is shown in Fig.3(c). The FOV
was determined from the 1/e points in the longitudinal intensity profile of the light sheet (Fig.3(d)). Figures3(c,d) show that, for the same NA, 3P-BB-LSFM has a slight reduction in resolution compared to 2P-BB-LSFM but greatly increases the FOV. It also shows that the resolution is effectively decoupled from the FOV
as it exhibits very little change withβ. This can be understood
from looking at the cross-section of the light sheet. Figure3(f)
shows the transverse intensity profiles of the light sheets in Fig. 3(a) at ‘focus’ (x=0). For 2P, the contribution of the Bessel beam side-lobes accounts for 24% of the total fluorescence excitation generated on the sample and, when scanned to form the light sheet, these blur into one another giving a broad profile. In 3P the contributions of the side-lobes are suppressed to a greater extent, containing only 4% of the total fluorescence excitation. This makes the light-sheet profile much more Gaussian in shape and so, increasing the propagation-invariant length of the beam (by decreasingβ) will not significantly affect the resolution. This
quantitative MTF study is in agreement with recent works by Chenet al. [13] and Rodríguezet al. [14] which show benefits of using Bessel beams in 3P confocal microscopy.
A 2P- and 3P-BB-LSFM was implemented experimentally to verify our simulations. A 1° axicon was used to generate an
annulus on the back pupil of the illumination objective withβ=
6.5. Fluorescent beads were imaged (Fig. 3(e)) and their axial
intensity profiles are shown in Fig. 3(g). The images obtained
in 2P show that the side-lobes are still clearly visible while in 3P their contribution is negligible. Excitation confinement in the main lobe is 80% for 2P and 98% for 3P proving that high aspect ratio light sheets can be generated without the need to use confocal slit detection or deconvolution to eliminate the
side-lobes [21]. The intensity profile along the Bessel beam,
measured in a Hoechst 33342 dye solution, demonstrates that the use of 3P-BB-LSFM achieves an extended FOV compared to its 2P counterpart (Fig.3(h)).
Although the average power used in our experiments may be too high for very sensitive biological samples, it can be greatly reduced by using high energy pulses delivered by the above-mentioned optimal laser sources. This, combined with the intrin-sic lower photo-damage of LSFM compared to point-scanning microscopy and the reduced photo-damage at longer
wave-lengths [22], makes 3P-LSFM a promising tool for deep imaging
of biological samples.
In summary, we have demonstrated a new LSFM approach based on 3P excitation that results in an extended imaging depth compared with the currently available 2P-LSFM. By imaging
≈450 µm spheroids, we show that its performance at shallow
Published by
3PGaussian Bessel5 Bessel2
Bessel10 Bessel6.5
1.5
1.3
2 1.8
1.6
1.4
3
2P
3P
x z
(c) (d)
(e)
[image:5.612.49.563.48.642.2](f) (g) (h)
Fig. 3.Characterization of LSFM with Bessel beam illumina-tion. (a) Numerically simulated XZ light-sheet cross-sections of a Bessel6.5 beam in 2P and 3P and (b) their respective axial MTFs. The spatial frequency,fz, is normalized to 2N A/λ1P.
White lines indicate the isosurface at 5% contrast. (c) Peak ax-ial resolution and (d) FOV for simulated Gaussian and Bessel
light-sheets withβ = 2, 5, 6.5, 10 in 1P, 2P and 3P. Insets
in (c) show magnified views of the plot.λ1P= 405 nm,λ2P=
700 nm andλ3P= 1000 nm. (e) Experimental images of 1 µm
diameter blue fluorescing beads obtained with 2P- and
3P-BB-LSFM withβ= 6.5. Average power on the sample for 2P and
3P was 6 mW and 307 mW, respectively. Scale bars, 10µm. (f)
Transverse light-sheet cross-sections at ‘focus’ (x=0) for 2P
and 3P obtained from (a). (g) Axial intensity profile of beads in 2P and 3P along the dashed lines in (e). (h) Experimental and simulated longitudinal intensity profile of a Bessel6.5 beam.
illumination is even more advantageous for LSFM, achieving deeper penetration and a larger FOV while maintaining high resolution. The penetration depth of the light sheet could be further improved by using longer wavelengths and combining it with attenuation-compensation approaches recently developed
for propagation-invariant fields [19]. However, the imaging
depth in the axial direction would still be limited by the wide-field detection of visible light which is a continuing avenue of research.
Funding
This work has received funding from the European Union’s Horizon 2020 Programme through the project Ad-vanced BiomEdical OPTICAL Imaging and Data Analysis (BE-OPTICAL) under grant agreement no. 675512 and the UK Engineering and Physical Sciences Research Council (grants
REFERENCES
1. W. Denk, J. H. Strickler, and W. W. Webb, Science248, 73-76 (1990). 2. G. Katona, G. Szalay, P. Maák, A. Kaszás, M. Veress, D. Hillier, B. Chiovini, E. S. Vizi, B. Roska, and B. Rózsa, Nat. Methods9, 201-208 (2012).
3. N. G. Horton, K. Wang, D. Kobat, C. G. Clark, F. W. Wise, C. B. Schaffer, and C. Xu, Nat. Photonics7, 205-209 (2013).
4. C. J. Rowlands, D. Park, O. T. Bruns, K. D. Piatkevich, D. Fukumura, R. K. Jain, M. G. Bawendi, E. S. Boyden, and P. T. So, Light. Sci. & Appl.6, e16255 (2016).
5. D. G. Ouzounov, T. Wang, M. Wang, D. D. Feng, N. G. Horton, J. C. Cruz-Hernández, Y.-T. Cheng, J. Reimer, A. S. Tolias, N. Nishimura, and C. Xu, Nat. Methods14, 388-390 (2017).
6. F. Helmchen and W. Denk, Nat. Methods2, 932-940 (2005). 7. J. Huisken, J. Swoger, F. Del Bene, J. Wittbrodt, and E. H. Stelzer,
Science305, 1007-1009 (2004).
8. E. G. Reynaud, U. Kržiˇc, K. Greger, and E. H. K. Stelzer, HFSP J.2, 266-275 (2008).
9. R. Tomer, K. Khairy, F. Amat, and P. J. Keller, Nat. Methods9, 755-736 (2012).
10. F. O. Fahrbach, V. Gurchenkov, K. Alessandri, P. Nassoy, and A. Rohrbach, Opt. Express21, 13824-13839 (2013).
11. T. Vettenburg, H. I. Dalgarno, J. Nylk, C. Coll-Lladó, D. E. Ferrier, T. ˇCižmár, F. J. Gunn-Moore, and K. Dholakia, Nat. Methods11, 541-544 (2014).
12. K. Guesmi, L. Abdeladim, S. Tozer, P. Mahou, T. Kumamoto, K. Ju-rkus, P. Rigaud, K. Loulier, N. Dray, P. Georges, M. Hanna, J. Livet, W. Supatto, E. Beaurepaire, and F. Druon, Light. Sci. Appl.7, 12 (2018). 13. B. Chen, X. Huang, D. Gou, J. Zeng, G. Chen, M. Pang, Y. Hu, Z. Zhao, Y. Zhang, Z. Zhou, H. Wu, H. Cheng, Z. Zhang, C. Xu, Y. Li, L. Chen, and A. Wang, Biomed. Opt. Express9, 1992-2000 (2018).
14. C. Rodríguez, Y. Liang, R. Lu, and N. Ji, Opt. Lett.43, 1914-1917 (2018).
15. C. Xu, W. Zipfel, J. B. Shear, R. M. Williams, and W. W. Webb, Proc. Natl. Acad. Sci. U.S.A.93, 10763-10768 (1996).
16. P. J. Keller, A. D. Schmidt, J. Wittbrodt, and E. H. Stelzer, Science.322, 1065-1069 (2008).
17. P. G. Pitrone, J. Schindelin, L. Stuyvenberg, S. Preibisch, M. Weber, K. W. Eliceiri, J. Huisken, and P. Tomancak, Nat. Methods10, 598-599 (2013).
18. P. Mahou, G. Malkinson, É. Chaudan, T. Gacoin, E. Beaurepaire, and W. Supatto, Small13, 1701442 (2017).
19. J. Nylk, K. McCluskey, M. A. Preciado, M. Mazilu, Z. Yang, F. J. Gunn-Moore, S. Aggarwal, J. A. Tello, D. E. K. Ferrier, and K. Dholakia, Sci. Adv.4, eaar4817 (2018).
20. O. E. Olarte, J. Licea-Rodriguez, J. A. Palero, E. J. Gualda, D. Artigas, J. Mayer, J. Swoger, J. Sharpe, I. Rocha-Mendoza, R. Rangel-Rojo and P. Loza-Alvarez, Biomed. Opt. Express3, 1492-1050 (2012). 21. E. S. Welf, M. K. Driscoll, K. M. Dean, C. Schäfer, J. Chu, M. W.
Davidson, M. Z. Lin, G. Danuser and R. Fiolka, Dev. Cell36, 462–475 (2016).
Published by
REFERENCES
1. W. Denk, J. H. Strickler, and W. W. Webb, “Two-photon laser scanning fluorescence microscopy,” Science248, 73–76 (1990).
2. G. Katona, G. Szalay, P. Maák, A. Kaszás, M. Veress, D. Hillier, B. Chiovini, E. S. Vizi, B. Roska, and B. Rózsa, “Fast two-photon in vivo imaging with three-dimensional random-access scanning in large tissue volumes,” Nat. Methods9, 201–208 (2012).
3. N. G. Horton, K. Wang, D. Kobat, C. G. Clark, F. W. Wise, C. B. Schaffer, and C. Xu, “In vivo three-photon microscopy of subcortical structures within an intact mouse brain,” Nat. Photonics7, 205–209 (2013). 4. C. J. Rowlands, D. Park, O. T. Bruns, K. D. Piatkevich, D. Fukumura,
R. K. Jain, M. G. Bawendi, E. S. Boyden, and P. T. So, “Wide-field three-photon excitation in biological samples,” Light. Sci. & Appl.6, e16255 (2016).
5. D. G. Ouzounov, T. Wang, M. Wang, D. D. Feng, N. G. Horton, J. C. Cruz-Hernández, Y.-T. Cheng, J. Reimer, A. S. Tolias, N. Nishimura, and C. Xu, “In vivo three-photon imaging of activity of GCaMP6-labeled neurons deep in intact mouse brain,” Nat. Methods14, 388–390 (2017). 6. F. Helmchen and W. Denk, “Deep tissue two-photon microscopy,” Nat.
Methods2, 932–940 (2005).
7. J. Huisken, J. Swoger, F. Del Bene, J. Wittbrodt, and E. H. Stelzer, “Op-tical sectioning deep inside live embryos by selective plane illumination microscopy,” Science305, 1007–1009 (2004).
8. E. G. Reynaud, U. Kržiˇc, K. Greger, and E. H. K. Stelzer, “Light sheet based fluorescence microscopy: More dimensions, more photons, and less photodamage,” HFSP J.2, 266–275 (2008).
9. R. Tomer, K. Khairy, F. Amat, and P. J. Keller, “Quantitative high-speed imaging of entire developing embryos with simultaneous multiview light-sheet microscopy,” Nat. Methods9, 755–763 (2012).
10. F. O. Fahrbach, V. Gurchenkov, K. Alessandri, P. Nassoy, and A. Rohrbach, “Light-sheet microscopy in thick media using scanned bessel beams and two-photon fluorescence excitation,” Opt. Express
21, 13824–13839 (2013).
11. T. Vettenburg, H. I. Dalgarno, J. Nylk, C. Coll-Lladó, D. E. Ferrier, T. ˇCižmár, F. J. Gunn-Moore, and K. Dholakia, “Light-sheet microscopy using an airy beam,” Nat. Methods11, 541–544 (2014).
12. K. Guesmi, L. Abdeladim, S. Tozer, P. Mahou, T. Kumamoto, K. Ju-rkus, P. Rigaud, K. Loulier, N. Dray, P. Georges, M. Hanna, J. Livet, W. Supatto, E. Beaurepaire, and F. Druon, “Dual-color deep-tissue three-photon microscopy with a multiband infrared laser,” Light. Sci. Appl.7, 12 (2018).
13. B. Chen, X. Huang, D. Gou, J. Zeng, G. Chen, M. Pang, Y. Hu, Z. Zhao, Y. Zhang, Z. Zhou, H. Wu, H. Cheng, Z. Zhang, C. Xu, Y. Li, L. Chen, and A. Wang, “Rapid volumetric imaging with Bessel-Beam three-photon microscopy,” Biomed. Opt. Express9, 1992–2000 (2018). 14. C. Rodríguez, Y. Liang, R. Lu, and N. Ji, “Three-photon fluorescence
microscopy with an axially elongated Bessel focus,” Opt. Lett.43, 1914– 1917 (2018).
15. C. Xu, W. Zipfel, J. B. Shear, R. M. Williams, and W. W. Webb, “Mul-tiphoton fluorescence excitation: new spectral windows for biological nonlinear microscopy,” Proc. Natl. Acad. Sci. U.S.A.93, 10763–10768 (1996).
16. P. J. Keller, A. D. Schmidt, J. Wittbrodt, and E. H. Stelzer, “Recon-struction of Zebrafish Early Embryonic Development by Scanned Light Sheet Microscopy,” Science.322, 1065–1069 (2008).
17. P. G. Pitrone, J. Schindelin, L. Stuyvenberg, S. Preibisch, M. Weber, K. W. Eliceiri, J. Huisken, and P. Tomancak, “OpenSPIM: an open-access light-sheet microscopy platform,” Nat. Methods10, 598-599 (2013).
18. P. Mahou, G. Malkinson, É. Chaudan, T. Gacoin, E. Beaurepaire, and W. Supatto, “Metrology of Multiphoton Microscopes Using Second Harmonic Generation Nanoprobes,” Small13, 1701442 (2017). 19. J. Nylk, K. McCluskey, M. A. Preciado, M. Mazilu, Z. Yang, F. J.
Gunn-Moore, S. Aggarwal, J. A. Tello, D. E. K. Ferrier, and K. Dholakia, “Light-sheet microscopy with attenuation-compensated propagation-invariant beams,” Sci. Adv.4, eaar4817 (2018).
20. O. E. Olarte, J. Licea-Rodriguez, J. A. Palero, E. J. Gualda, D. Artigas, J. Mayer, J. Swoger, J. Sharpe, I. Rocha-Mendoza, R. Rangel-Rojo
and P. Loza-Alvarez, “Image formation by linear and nonlinear digital scanned light-sheet fluorescence microscopy with gaussian and bessel beam profiles,” Biomed. Opt. Express3, 1492–1505 (2012). 21. E. S. Welf, M. K. Driscoll, K. M. Dean, C. Schäfer, J. Chu, M. W.
Davidson, M. Z. Lin, G. Danuser and R. Fiolka, “Quantitative Multiscale Cell Imaging in Controlled 3D Microenvironments.” Dev. Cell36, 462– 475 (2016).