ORBITING CLOUDS OF MATERIAL AT THE KEPLERIAN CO-ROTATION RADIUS OF RAPIDLY ROTATING LOW MASS WTTS IN UPPER SCO
John Stauffer1, Andrew Collier Cameron5, Moira Jardine5, Trevor J. David2, Luisa Rebull1,3, Ann Marie Cody4, Lynne A. Hillenbrand2, David Barrado6, Scott Wolk7, James Davenport8, Marc Pinsonneault9
1
Spitzer Science Center (SSC), California Institute of Technology, Pasadena, CA 91125, USA
2Astronomy Department, California Institute of Technology, Pasadena, CA 91125 USA
3Infrared Science Archive (IRSA), 1200 E. California Blvd, MS 314-6, California Institute of Technology, Pasadena, CA 91125 USA
4
NASA Ames Research Center, Space Sciences and Astrobiology Division, MS245-3, Moffett Field, CA 94035 USA
5School of Physics and Astronomy, University of St. Andrews, North Haugh, St Andrews KY16922, UK
6
Centro de Astrobiolog´ıa, Dpto. de Astrof´ısica, INTA-CSIC, E-28692, ESAC Campus, Villanueva de la Ca˜nada, Madrid, Spain
7Harvard-Smithsonian Center for Astrophysics, 60 Garden Street, Cambridge, MA 02138, USA
8Department of Physics & Astronomy, Western Washington University, 516 High Street, Bellingham, WA 98225, USA
9Department of Astronomy, The Ohio State University, Columbus, OH 43210, USA
ABSTRACT
Using K2 data, we have identified 23 very low mass members of the ρ Oph and Upper Scorpius
star-forming region as having periodic photometric variability not easily explained by well-established physical mechanisms such as star spots, eclipsing binaries, or pulsation. All of these unusual stars are mid-to-late M dwarfs without evidence of active accretion, and with photometric periods generally
<1 day. Often the unusual light curve signature takes the form of narrow flux dips; when we also
have rotation periods from star spots, the two periods agree, suggesting that the flux dips are due to material orbiting the star at the Keplerian co-rotation radius. We sometimes see “state-changes” in
the phased light curve morphologies where ∼25% of the waveform changes shape on timescales less
than a day; often, the “state-change” takes place immediately after a strong flare. For the group of stars with these sudden light curve morphology shifts, we attribute their flux dips as most probably arising from eclipses of warm coronal gas clouds, analagous to the sling-shot prominences postulated
to explain transient Hαabsorption features in AB Doradus itself and other rapidly rotating late type
stars. For another group of stars with somewhat longer periods, we find the short duration flux dips to be highly variable on both short and long timescales, with generally asymmetric flux dip profiles. We believe that these flux dips are due to particulate clouds possibly associated with a close-in planet or resulting from a recent collisional event.
1. INTRODUCTION
We have entered into a new era, where synoptic photometry for millions of stars is currently being collected and analysed (e.g., OGLE, Gaia, WASP). In the relatively near future, LSST will obtain synoptic photometry for billions of stars. In order to make the most of those data, we need to develop automated routines to sift through enormous datasets in order to identify light curves of interest. A precursor to that activity is to develop a better understanding of all the types of photometric variability present in real stars, and where possible to assign physical mechanisms to those variability classes.
TheKepler mission provided one very well characterized training set of light curves for >100,000 stars. However, because it was tied to a single position in the sky and the target stars were primarily chosen for one science goal, the Keplerdata only provide templates for a limited range of stellar variability types. TheK2mission (Howell et al. 2014)
is providing a greatly augmented set of data by observing a new group of∼20000 stars every three months, with those
stars having a much wider range of characteristics. One specific variability type for whichK2is providing a wealth of
new data is young stellar objects (YSOs).
form the largest set of precision YSO optical light curves that have ever been obtained. Those light curves provide a hunting ground for the search for newly formed planets via their transits (David et al. 2016a; Mann et al. 2016), for the identification of YSO eclipsing binaries (Alonso et al. 2015; David et al. 2016b; Kraus et al. 2015; Lodieu et al. 2015), and for the determination of the rotational periods for a large sample of low mass stars of 5-10 Myr age (Rebull et al. , in preparation). A small fraction of the Upper Sco YSOs have IR excesses and are likely classical T Tauri stars (CTTs); a sub-group of “burster” lightcurves associated with some of these accreting systems is discussed in Cody et al. (2017a).
The discussion of our process for identifying a best set of probable Upper Sco members, and the categorization of light curve morphologies for the disked stars is provided in Cody et al. (2017b, in preparation). Our sorting of those members into stars with primordial disks and those without disks (weak-lined T Tauri stars, WTTs) is described briefly below, and more fully in Cody etal (2017b).
About 1100 of the Upper Sco and ρ Oph stars appear not to have infrared (IR) excesses and presumably have
shed their primordial circumstellar disks. In the course of our processing and analysis of those light curves, the vast majority were identified as showing periodic variability characteristic of stars with dark, non-axisymmetrically distributed spots. A handful were found to be eclipsing binaries, and another handful (all relatively high mass stars) are pulsators. However, twenty-three of the stars showed periodic photometric variability which did not fit into any of those categories. It is those stars that are the subject of this paper. All of these stars are M dwarfs, with most having spectral types between M4 and M6. All have short periods – more than half less than one day, and all but one less than two days.
In§2, we describe the sources of data for this paper. Our process for identifying unusual light curve classes, and
the working definitions we have developed for our three classes is provided in§3. The empirical characteristics of the
variability for each of the three classes is laid out in§4-6.
2. OBSERVATIONAL DATA
2.1. K2 Light Curves
For the first threeK2 campaigns, the K2 Science Center did not produce detrended light curves. Instead, what
was provided was the raw CCD pixel data for each star at each epoch. We (Cody et al. 2017a) therefore created our own detrended light curves. We produced two primary versions – one where the aperture centers were held fixed
over the course of the K2campaign, and another where a new center was derived at each epoch. For each flavor of
reduction, photometry was produced with 2 and 3 pixel radius apertures. For each of these four light curve versions, we then applied a version of the detrending routine described in Aigrain et al. (2016) to remove the short-term, non-astrophysical trends in the data.
After we had begun writing this paper, two other light curve reductions became publicly available for Campaign 2, the Vanderburg reduction (Vanderburg & Johnson 2014) and the EVEREST reduction (Luger et al. 2016). We downloaded light curves for each of the stars that we considered as possibly relevant to this paper.
For each star addressed in this paper, we examined all of the light curve variants that we had available, and chose the one which appeared to have the least non-astrophysical contribution (when several variants were about the same, we simply adopted our own detrended light curve). In all cases, the unusual features which caused us to include the star in our paper were present in multiple light curve variants. In a few cases, one of the light curve variants did not have the same signature. We believe this indicates that the detrending algorithm employed in that version removed some real astrophysical signature, or that the aperture size used in that version or the centering algorithm in that version resulted in the light curve being dominated by light from a different star. We made special effort in these cases to closely examine all the available data (finding charts, literature, all light curve variants and different aperture sizes) in order to make sure that the light curve we present here is the best available for that star.
2.2. Ancillary Data
The Ecliptic Plane Input Catalog (EPIC; Huber et al. 2016) catalog available at MAST provides accurate coordinates for all of the stars in our sample. Using those coordinates, we downloaded all available near and mid-IR photometry
for our stars from the 2MASS (Skrutskie et al. 2006), WISE (Wright et al. 2010), Spitzer (Werner et al. 2004) SEIP1
and FEPS (Meyer et al. 2006), AKARI (Murakami et al. 2007), and SDSS (e.g., Ahn et al. 2014) archives as well as
B andV band photometry from APASS (Henden & Munari 2014). We also downloaded grizy photometry for most
of our stars from the PAN-STARRS database (Flewelling et al. 2016). Spectral types were available in the literature (Preibisch et al. 2002, Erickson et al. 2011, Lodieu et al. 2011, Luhman & Mamajek 2012, Rizzuto et al. 2015) for
80% of our stars; for most of the stars, those same references also provided Hαand lithium (6708˚A) equivalent widths.
We have used our own Keck HIRES spectra to provide a small amount of new spectral information, as described in the Appendix.
One goal for the ancillary data was to provide a color-magnitude diagram which would include all the stars in our
sample, and for that we decided to attempt to determine estimated V −Ks colors for every star. Because only a
small fraction of the Upper Sco members have publishedV band photometry, this required transforming photometry
or colors obtained at other optical bands. As the first step in that process, we downloaded Gband photometry for
all of our stars from the newly released Gaia DR1 archive (Gaia Collaboration 2016). We then derived a formula to
convertG−Ks colors to V −Ks colors based on a large sample of low mass stars with published V −Ks colors in
Praesepe (Rebull et al. 2017, submitted). For the stars lacking Gaia photometry, we obtainedI magnitudes from the
Deep Near-Infrared Survey of the Southern Sky (DENIS; Epchtein et al. 1997) and derived a conversion formula in a
similar way betweenI(DENIS)−KsandV −Ks.
We used all of the available photometry and spectral types to produce spectral energy distributions (SEDs) for each star (the individual SEDs are shown in the Appendix). From those SEDs, we identified stars with possible IR excesses. For each of the sources thought to have an IR excess, we looked at the images, where available, to assess the quality
of the photometry. The longest wavelength data we have is either WISE 22µm or, for just four stars Spitzer 24µm.
In several cases, the 22µm point from WISE, in particular, was not a secure detection, and the apparent IR excess
therefore vanished. Only one star in our final sample has a relatively secure, though small IR excess (only at 24µm),
and that is EPIC 205024957. Carpenter et al. (2009) also determined that EPIC 205024957 has a 24 µm excess and
identified it as a debris disk. For the stars where our longest wavelength detection is at 12µm, the lack of an excess
at that wavelength precludes them from having primordial disks. Because of the paucity of good data longward of
12µm for most of our stars, a larger fraction could harbor debris disks.
3. SAMPLE SELECTION AND LIGHT CURVE TAXONOMY
3.1. Sample Selection
The first step in our sample selection was to eliminate stars with active accretion (CTTs) from the Upper Sco and
ρ Oph K2 sample, since the accretion process in CTTs and interactions with the primordial circumstellar disk can
produce unusual light curves of many types, and addressing those types of variability was beyond the scope we wanted here (but see Cody et al. 2017a). None of the stars we retained for this paper have SEDs consistent with Class I or II primordial disks (see the SED plots in the Appendix, and compare, for example, to the SEDs of Class I and II sources in Upper Sco shown in Cody et al. 2017a or similar sources in Taurus as shown in Rebull et al. 2010). Two of the
stars are considered asρOph members in the literature (EPIC 203962559 and EPIC 203927435); all of the others are
considered as members of Upper Sco.
Once we had identified the full set of Upper Sco weak-lined T Tauri (WTTS) members withK2 data, three of the
authors (TJD, LMR, AMC) independently examined the data for each star, including each of the light curve variants described above. They also independently searched for periodicities in those light curves and examined the phased light curves. Those efforts were aimed primarily at identifying possible planet transits, or eclipsing binary candidates, or variability related to accretion or circumstellar disk structure, or in compiling stellar rotation periods. During the course of those efforts, a few dozen stars were identified as having light curves that were not easily explained by any of those mechanisms. In those cases, further analysis was done and other members of the team were brought in to perform more manual detrending of the light curves. This more detailed analysis resulted in some of these light curves being ascribed to artifacts in the data or to allowing them to fit into one of the established light curve classes. However, 23 of these stars survived. These stars are listed in Table 1.
3.2. Definition of Light Curve Classes and Their Morphologies
0 0.2 0.4 0.6 0.8 1 8000
8500 9000
204117263,P=0.6423
0 0.2 0.4 0.6 0.8 1
15500 16000 16500
203692610,P=1.821
0 0.2 0.4 0.6 0.8 1
13800 14000 14200 14400
205046529B,P=1.835
0 0.2 0.4 0.6 0.8 1
17000 18000
19000 203462615A P=0.5204
0 0.2 0.4 0.6 0.8 1
18500 19000 19500 20000
20500 204364515B,P=1.456
0 0.2 0.4 0.6 0.8 1
7800 8000 8200
[image:4.612.124.495.121.398.2]8400 205024957,P=1.669
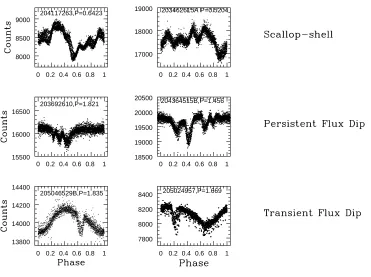
Figure 1. Phased light curves for exemplary members of the “scallop-shell” light curve class (top row), the persistent, short-duration flux dip class (middle row), and the transient, short-short-duration flux dip class (bottom row).
Table 1 provides a list of all 23 stars we have identified as belonging to these three classes, along with some of their overall defining properties. Spectral types are known for 20 of these stars; all are M dwarfs with 17 of the 20
having spectral types between M4.0 and M5.5. Most of the Upper ScoK2sample are M dwarfs, but the stars in Table
1 are predominantly weighted towards later M sub-types (this is also reflected in their CMD locations – see Figure
23). Eighteen of the stars in Table 1 have known Hαequivalent widths, all but one of which have equivalent widths
appropriate for WTTS (−3.0 ˚A<EqW<−16 ˚A). Thirteen of the stars in Table 1 have measured Li 6708˚A equivalent
widths, all of which are∼0.5 ˚A, also as appropriate for WTTS mid-to-late M dwarfs (the spectral types for two stars
and the lithium data for six stars are from our own HIRES spectra, as described in the Appendix).
Eleven of 23 (48%) of the stars in Table 1 have two Lomb-Scargle periods (i.e. are apparent binaries), which seems
high. From the full sample ofK2M dwarf WTTs with 2<P<8 days (∼280 stars), only 16% are apparent binaries
by the same measure. However, for the ∼140 K2 M dwarfs with P < 1 day, 38% are apparent binaries. Thus, the
stars in Table 1 may have a high binary fraction simply because the rapidly rotating low mass stars in Upper Sco are often binaries. This is consistent with the conclusion from Stauffer et al. (2016) that M dwarfs in the Pleiades with two Lomb-Scargle peaks were both more rapidly rotating and the two periods were closer together than would have been true if their periods were drawn at random from the single star population.
Figure1shows phased light curves for two examples of each of the three classes; phased light curves for all members of
the scallop-shell and persistent flux dip classes are provided in the Appendix, along with a description of the processing we have done to the original light curves. The class definitions are as follows:
• scallop-shells – phased light curves that look like the rim of a scallop shell. They have many wave-shaped
undulations in their phased light curves. Usually the shape remains nearly constant for the entireK2campaign,
• persistent flux dip class – discrete, triangularly shaped flux dips, generally covering less than 0.15 in phase
(for each of up to 4 dips). The flux dips are often more or less stable in depth over the K2campaign, with dip
depths generally a few percent. Outside of the dips, the phased light curves are either nearly flat or consistent with sinusoidal variation due to cool starspots. Periods range from 0.5 to 1.8 days. A half dozen rapidly rotating,
late M dwarf members of the Pleiades with this light curve signature were identified from K2Campaign 4 data
(Rebull et al. 2016,§3.6; Collier Cameron et al. 2017). Eight of our Upper Sco stars fall in this category.
• transient, narrow dip class– more or less triangularly shaped flux dips, narrow in phase, but always variable
in depth, on both short and long timescales, over the 78 day K2campaign. Only one prominent dip present in
the phased light curve. Dip depths generally a few percent, but up to 20% for EPIC 205483258 (RIK-210). All four stars also show a spotted-star waveform, whose period is identical to the dip period within our uncertainties. Periods ranging from 1 to 5.5 days.
In the next sections, we discuss specific examples of these categories.
4. STARS WITH SCALLOP-SHELL PHASED LIGHT CURVES
As illustrated in the top row of Figure 1, these stars show complex phased light curves, with many local maxima
and minima. For half of these stars, their waveform is relatively stable for the entire 78 dayK2 campaign. However,
for five of the eleven stars we put in this category, there is distinct evolution in the waveform within the campaign. Because we believe the nature of this evolution provides important clues as to the physical mechanism responsible for creating this light curve morphology, we discuss in detail these five stars and their light curve evolution during the campaign. First, however, we illustrate the class by describing the light curve of one of the six members whose phased
light curve shape does not change appreciably over the duration of theK2 campaign.
4.1. EPIC 204066898a
EPIC 204066898 (a.k.a. UScoCTIO 80A2; Kraus & Hillenbrand 2009=KH2009; Kraus & Hillenbrand 2012=KH2012)
is an M3 member of Upper Sco with no apparent IR excess. It has been identified as a wide binary, with separation
about 1300 and ∆Ks = 1.9 mag (Kraus & Hillenbrand 2009=KH2009). KH2012 also identify UScoCTIO 80A as a
close (0.0500), nearly equal mass binary (see their Table 3). We find two independent peaks in the Lomb-Scargle
periodogram with periods of 0.3956 and 0.5386 days. We have experimented with one pixel and 1.5 pixel apertures for the light curve extraction in order to assess the contribution of UScoCTIO 80B to the EPIC 204066898 light curve; our conclusion is that the two Lomb-Scargle peaks are both correctly associated with UScoCTIO 80A (UScoCTIO 80B is also EPIC 204066097, for which we derive a period of 0.36d). We thus assume the two stars associated with the two Lomb-Scargle peaks are also the close binary pair identified in KH2012. The longer period system for EPIC 204066898 (which we designate as the secondary component) has a more or less sinusoidal light curve with about 1% peak-to-trough amplitude. After removing the signal from this system and phasing the remaining signal to the 0.3956
day period of the primary component, the light curve shape for this star (Figure2) is fairly typical of the scallop-shell
class, with a full amplitude of about 5% and multiple peaks and troughs in its phased light curve.
4.2. EPIC 205110559
There are no published spectra for EPIC 205110559, but its colors suggest it is a mid to late M dwarf. Its light
curve (Figure 3) is also fairly typical of the scallop-shell class, with a full amplitude of about 5% and multiple peaks
and troughs in its phased light curve. For phase 0.45 to 1.0, the waveform is relatively stable over the duration of the
campaign. However, as emphasized in the second panel of Figure 3, the waveform shows considerable evolution over
the campaign for the phase range 0 to 0.45. The primary shift in waveform shape appears to occur almost exactly
at the boundary between the first window (day 2060-2099) and the second window (day 2099.2-2107.5).3 The third
panel of Figure 3 shows an expanded view of the timeframe when the waveform changed state, which reveals that a
strong flare occurred at day 2099. This is by far the strongest flare for this star during theK2campaign, and it occurs
at exactly the point that the waveform made its state transition. This latter point is illustrated in the last panel in
Figure 3. The “excess” flux at phase ∼0.15 gradually declines, returning to approximately the pre-flare level by day
∼2128. We conclude that there is very likely a physical link between the occurrence of the flare and the change in
morphology of the phased light curve.
2KH2009 actually call this star USco 80A, but in keeping with the SIMBAD usage, the more appropriate name is UScoCTIO 80A. The
star designated UScoCTIO 80 in Ardila et al. 2000 is UScoCTIO 80B, as explained in the note to Table 9 of KH2009.
3 The times listed here and throughout the remainder of the paper are in days since January 1, 2009, or as JD - 2454833. Keplerwas
EPIC ID Name RA Dec Ks V −Ks [W1]−[W3] λmax SpT HαEqW Li EqW P1 P2 Class
(deg) (deg) (mag) (mag) (mag) (µm) (˚A) (˚A) (days) (days)
204918279 RIK-21 239.1046 -20.2711 9.86 6.90d 0.38 12 M5.0 -10.2 0.61 0.4594 0.4665* 1
204066898 UScoCTIO 80A 239.6509 -23.8005 10.19 5.59 0.27 12 M3 -9.9 · · · 0.3956* 0.5386 1
203462615 RIK-42 239.9086 -26.0565 10.25 6.13 0.47 12 M5.5 -16.2 0.81 0.5201* 0.4421 1
204897050 UScoCTIO 56 240.4208 -20.3689 10.86 7.16d 0.42 12 M5 · · · 0.2639 · · · 1
202724025 RIK-90 242.2373 -28.5993 9.63 5.78 0.33 12 M4.5 -10.2 0.21 0.2595* 0.2795 1
204117263 LHJ-65 242.7589 -23.5973 10.95 6.42 0.35 12 M5 -11.6 · · · 0.6423 · · · 1
204367193 LHJ-77 242.9766 -22.6137 13.30 8.33 · · · 4.6 M6.3 -10.3 · · · 0.4835 · · · 1
203534383 243.5125 -25.8148 11.71 7.73 0.73 12 M4: -9.5 · · · 0.2784* 0.3234 1
205110559 243.8322 -19.3520 10.46 7.74 0.61 12 · · · 0.4031 · · · 1
203050730 RIK-246 247.7741 -27.4295 10.53 5.87 0.53 12 M4.5 -9.1 0.38 0.4865* 0.7740 1
203185083 RIK-253 248.6464 -26.9675 10.48 6.62 0.18 12 M4.5 -27.1 0.54 0.4400 · · · 1
204364515 240.3398 -22.6240 10.05 6.84 0.34 24 M4 -8.4 0.55 3.0863 1.456* 2
203849738 RIK-100 242.4703 -24.6982 10.93 6.69d 0.37 12 M5.5 -15.1 0.40 0.6190 · · · 2
203692610 242.6318 -25.2671 11.60 5.92 0.28 12 M4 -3.0 0.54 1.821 · · · 2
205374937 242.8255 -17.9580 9.33 6.35 0.34 24 M4 -4.8 0.55 0.6345* 0.5436 2
202873945 245.4164 -28.0518 11.24 8.21 0.75 12 · · · 0.6258 · · · 2
204296148 246.2158 -22.8952 10.99 8.06k 0.10 12 · · · 0.5314* 0.4717 2
203962559 AOC 64 246.7103 -24.2312 10.80 8.83d · · · 8 M4 -6.0 · · · 1.5402 · · · 2
203927435 WMR 2-23 247.1794 -24.3812 10.14 9.11d 0.13 12 M4.5 -6.8 0.76 0.4820* 0.4162 2
205024957 242.5459 -19.7678 11.38 6.53 0.46 24+ M5 -4.4 0.56 1.6656 · · · 3
205046529 242.6099 -19.6642 10.40 6.52k 0.35 24 M4 -4.4 0.54 2.5619 1.8358* 3
204143627 LHJ-120 243.9969 -23.4934 11.31 6.29 0.13 12 M5 · · · 1.125 · · · 3
205483258 RIK-210 245.8523 -17.2909 9.65 5.04 0.37 12 M2.5 -5.3 0.59 5.667 · · · 3
asources of the names are: RIK: Rizzuto, Ireland and Kraus 2015; UScoCTIO: Ardila, Martin & Basri 2000; LHJ: Lodieu, Hambly, Jameson et al. 2007; AOC:
Alves de Oliveira & Casali 2008; WMR: Wilking, Meyer, Robinson & Greene 2005.
b V−Ks estimated preferentially using a conversion based on the Gaia DR1 ‘G’ magnitudes and 2mass Ksvalues. A ‘d’ is appended if instead theV −Ks
estimate is based on Denis ‘I’ magnitudes and 2massKs. A ‘k’ is appended if theK2countrate itself was used to estimateV.
cLongest wavelength at which there is a secure detection, inµm. A plus sign indicates if there is a plausible, small IR excess
dSpectral type, Hαequivalent width, and Li equivalent width for EPIC 203534383 and 203692610 are from our own HIRES spectra. The Li equivalent widths
for EPIC 203849738, 204364515, 205024957 and 205046529 are also from our own HIRES spectra. See discussion in the Appendix.
eAn asterisk is attached to the period (P1 or P2) to designate which star in a binary has the unusual light curve which is discussed in this paper. All of the
binary companions have normal, spotted-star light curve morphologies.
fLight curve classes: 1 = scallop-shell; 2 = persistent short-duration flux dip; 3 = transient, short-duration flux dip.
4.3. EPIC 204918279B
TheK2 light curve for EPIC 204918279 has a beating appearance and the Lomb-Scargle periodogram shows two
strong peaks at very similar periods, 0.4594 and 0.4665 days, which we interpret as indicating it is a binary with the two components having nearly the same period.
After separating the variability at those two periods, we find that the star withP=0.4665 days has a light curve
shape which places it in the scallop-shell category at least for the first∼60 days of theK2campaign, as shown in the
first panel of Figure4. The phased light curve changed abruptly in shape at day∼2123.5, as illustrated in the second
and third panels of Figure4. The state transition of the light curve shape again appears to have been triggered by a
flare; see the fourth panel of Figure4. In this case, this is a much weaker flare than for EPIC 2051105594. Nevertheless,
4 Because this is a binary, we cannot know for certain which of the two stars was the site of the flare. However, because of the close
0.96 0.98 1 1.02 1.04 1.06
0 0.2 0.4 0.6 0.8 1
25000 26000 27000
Figure 2. The phased light curve of EPIC 204066898a (UScoCTIO 80Aa). The left-side y-axis is in ”counts”; the right-side y-axis normalizes to the median-count rate in order to allow easy determation of amplitudes in terms of per cent change in the
light curve flux. The light curve shows no evidence for significant change over the 78 days of theK2campaign. The phased
light curve shows more structure than can be produced by cool spots on the photosphere. The inset is a not-to-scale spatial
cartoon of the orientation of the Upper Sco CTIO 80 triple system; the actual separation between “Aa” and “Ab” is 0.0500and
between “Aab” and “B” is 1300. This cartoon does not represent theK2stamp image for this system nor the aperture we have
used for the photometry.
this was the strongest flare seen in the K2 light curve for EPIC 204918279, at least during the last 60 days of the
campaign. Prior to and after the flare, the light curve shape appears quite stable during theK2campaign.
4.4. EPIC 203185083
EPIC 203185083 is an M4.5 YSO Upper Sco member with unusually strong Hαemission (equivalent width =−27
˚
A) for a WTTS of that spectral type (Rizzuto et al. 2015). However, it appears to have no IR excess, so we consider it to be a WTTS. The Lomb-Scargle periodogram indicates a period of 0.4400 days.
After phasing the light curve to the 0.44 day period, we find a waveform shape which is not plausibly explained by
cool spots and which seems to evolve over the duration of the K2 campaign. After some investigation, we find the
waveform evolution basically occurs at two rapid transitions on day 2093 and day 2102, as shown in the left panel
of Figure5. The first state transition of the light curve shape again appears to have been triggered by a flare (right
panel of Figure 5), though again a much weaker flare than for EPIC 205110559. Nevertheless, this was the strongest
flare seen in the K2 light curve for EPIC 203185083. The second state transition appears to happen without any
obvious trigger as seen from our vantage point. Finally, for both EPIC 203185083 and EPIC 204918279, the flares at the state-transition seem unusual in that they have nearly symmetric shape (rather than a rapid rise and slow decay
0 0.2 0.4 0.6 0.8 1 8200 8400 8600 8800 9000 black=d2060-d2099 red=d2099.2-d2107.5 green=d2107.5-2128 blue=d2128-d2139 0.95 1
0 0.1 0.2 0.3 0.4 8200 8400 8600 8800 9000 black=d2060-d2099 red=d2099.2-d2107.5 green=d2107.5-2128 blue=d2128-d2139
2097 2098 2099 2100 2101 2102 10000 12000 14000 16000 18000 EPIC205110559 pre-flare post-flare 0.95 1 1.05
2097 2098 2099 2100 2101 2102 9000
9500
10000 EPIC205110559
Figure 3. The phased light curve and other plots to illustrate the light curve evolution of EPIC 205110559. Top left: full phased light curve. The different colors correspond to the windows in time noted within the plot. Top right: an expanded view of just the first half of the phased light curve. Bottom left: A strong flare occurred at day 2099 (by far the strongest for
this star during theK2campaign). Bottom right: expanded view of the light curve around the time of the flare, showing that
the periodic waveform changed following the flare. For the top-right and bottom-right plots, y-axis labels for both counts and counts normalized to the median value are provided.
0 0.2 0.4 0.6 0.8 1 19800
20000 20200 20400
20600 EPIC204918279B P=0.4665dpre-flare
day < 2110.0
day 2110-2123. 0.98
0.99 1 1.01 1.02
0 0.2 0.4 0.6 0.8 1 19800
20000 20200 20400
20600 EPIC204918279B P=0.4665dpost-flare
day > 2124.0
0 0.2 0.4 0.6 0.8 1 19800 20000 20200 20400 20600 20800 EPIC204918279B P=0.4665d
day < 2123.0
day > 2124.0 0.99
1 1.01 1.02 1.03
2122 2123 2124 2125 20000 20200 20400 20600 20800 post-flare EPIC204918279B pre-flare
Figure 4. The phased light curve and other plots to illustrate the light curve evolution of EPIC 204918279B. Top left: phased
light curve for d <2123. Top right: phased light curve for d>2124. Bottom left: superposition of the two previous panels,
showing that the change in waveform was restricted to the phase range 0.45 to 0.7. Bottom right: expanded view of the light curve around the time of the phase transition, showing the presence of a small flare when the change occurred.
as true for most flares and for the flare on EPIC 205110559).
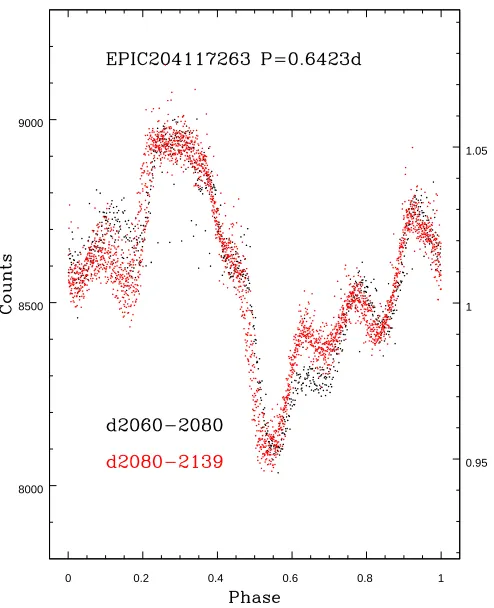
4.5. EPIC 204117263
The Lomb-Scargle periodogram for EPIC 204117263 shows a single strong peak atP=0.6423 days; when phased
to that period, the light curve has a scallop-shell appearance for the entire campaign. There was, however, a small,
abrupt change in the phased light curve shape at day 2080.0, as illustrated in Figure6. In this case, the state transition
0 0.2 0.4 0.6 0.8 1 9000
10000 11000 12000 13000 14000
Phase d2060-2092.5 (pre-flare) EPIC203185083 P=0.4400
d2093.3-2102. (post-flare) d2102-2139
2090 2092 2094 2096 9000
10000 11000 12000 13000
Time (days) EPIC203185083
pre-flare post-flare
Figure 5. Plots illustrating the light curve evolution of EPIC 203185083. Left: phased light curve for three time intervals: blue (day 2060-2092.5), green (day 2093.3-2102), red (day 2102-2139). There is a transition in waveform shape at day 2093, and another transition in shape at day 2102. The light curves at the top of the plot are offset in y by 2000 counts for clarity. Right: expanded view of the light curve near the 1st state-transition in the phased waveform, showing the presence of a small flare when the change occurred.
4.6. EPIC 204897050
The Lomb-Scargle periodogram for EPIC 204897050 shows a dominant strong peak at a very short period of
P=0.2639 days; when phased to that period, the light curve has a scallop-shell appearance for the entire campaign.
As illustrated in Figure 7, there is a small portion of the phased light curve around phase=0.6 where the waveform
shape gradually changes throughout the length of the campaign. This could be consistent with the other three stars discussed above, if there was a trigger event just prior to the beginning of Campaign 2; no significant flares are seen during the time period of our light curve.
4.7. Shared Characteristics of the Stars with Scallop-Shell Light Curves
The stars having scallop-shell light curves have many shared characteristics, which presumably provide clues to the physical process driving their unusual light curve morphology. Below we collect the most salient of those shared characteristics:
• All have periods less than 0.65 days. We do not know that this is, in fact, the stellar rotation period, but we
will assume that is the case. With that assumption, their periods place them among the most rapidly rotating
M dwarfs in Upper Sco (see also§7).
• All have mid to late M spectral types (M4 to M6.5).
• They have full amplitudes for their K2light curves of 2% to 10%.
• Six of eleven of them show relatively stable phased light curve shapes over the entire 78 dayK2campaign.
• Five of them show evolving waveforms. In all but one case, there is an abrupt transition from one waveform to
another with the switch happening in generally less than a day. In three cases, the phase change takes place when a strong flare occurs. In four of the five cases, the change in shape only significantly affects 20 to 30% of the waveform, with the remaining waveform staying essentially constant in shape. For EPIC 205110559,
the fractional flux change between states at phase=0.1 is of order 4% (Figure 3, second panel). Any physical
mechanism to explain this light curve morphology must be able to accomodate events of this size. For all three events with triggering flares, the affected portion of the light curve brightened after the flare.
0.95 1 1.05
0 0.2 0.4 0.6 0.8 1
[image:10.612.187.434.80.384.2]8000 8500 9000
Figure 6. The phased light curve of EPIC 204117263, illustrating the abrupt change in shape at day 2080. Black points
correspond to the time window for days 2060-2080; red points correspond to data after day 2080. The largest change in
waveform shape is near phase=0.65, but there is also a small change near phase 0.15. Otherwise, the shape of the phased light
curve was very stable over the entireK2campaign.
• There are 83 WTTs in our sample with P <0.65 days and (V −Ks)>5. The fraction that have scallop-shell
light curve morphologies for that period range is therefore 13%.
• We have also examined this WTT control group for obvious flares. Based on a simple visual check of the
detrended light curves of our Table 1 stars and our WTT control group, we find no obvious difference in either the frequency or strength of flares.
5. STARS WITH SHORT-DURATION, PERSISTENT FLUX DIPS
There are eight stars in Table1 in this category. The phased light curves of these stars are dominated by shallow,
triangularly shaped flux dips, superposed either on a flat “continuum” or on a waveform consistent with that due to rotational modulation of cool spots at the same period as the flux dips. Four of these stars show little or no evolution
in their phased light curve morphology over the time frame of theK2 campaign; we describe one of these four stars
(EPIC 205374937) in detail. The other four members of the class show demonstrable evolution in their light curve
morphology over the K2 campaign, and we discuss each case individually in order to illustrate the nature of this
evolution.
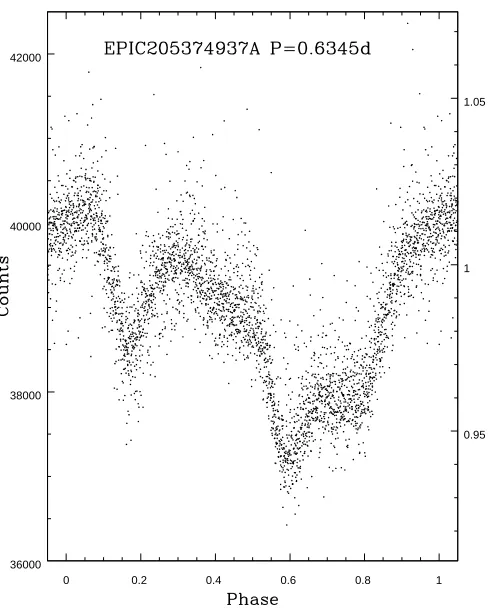
5.1. EPIC 205374937
Preibisch et al. (2001) first identified EPIC 205374937 as a low mass member of Upper Sco. Carpenter et al. (2009) and Luhman & Mamajek (2012) both reported no IR excess. Using Gemini North adaptive optics (AO) imaging,
Lafreniere et al. (2014) identified EPIC 205374937 as a nearly equal mass binary with a 0.100separation. TheK2light
0.95 1 1.05
0 0.2 0.4 0.6 0.8 1
[image:11.612.188.436.78.383.2]6200 6400 6600 6800 7000 7200
Figure 7. The phased light curve of EPIC 204897050, illustrating the gradual change in the shape of the phased light curve
near phase=0.60. Otherwise, the shape of the phased light curve was stable over the entireK2campaign. Colors (black, blue,
green, yellow, red, in order) correspond to approximately fifteen day long windows. The flux minimum near phase 0.5 became deeper and broader as the campaign progressed.
we somewhat arbitrarily assign the the larger periodogram peak as the A component. The phased light curve for the
A component is shown in Figure8.
We interpret the phased light curve for EPIC 205374937A as the superposition of a more or less sinusoidal variation due to star spots and two (or possibly three) short-duration flux dips. The two most prominent flux dips are centered at phases about 0.2 and 0.6; the full width at zero intensity (FWZI) of the dips are 0.16 and 0.12 in phase (or about 2 hours in time) and their depths are about 3% of the continuum. There is no suggestion of the dips varying in depth or width over the course of the campaign (that is, the noise level in the phased light curve appears the same inside and outside the dips). The period that phases the dips best also produces the least scatter in the rest of the light curve, indicating that the dip period is essentially the same as the spot period. Two of the other stars in this group (EPIC 204296148 and 203849738) also have both spotted star waveforms and persistent flux dips where the periods are the
same (see FigureC10).
5.2. EPIC 203692610
EPIC 203692610 is an essentially anonymous, red star with proper motion consistent with Upper Sco membership.
Our own Keck HIRES spectra for this star shows it to have a spectral type of about M4, with weak Hα emission
(equivalent width = −3.0 ˚A), and strong lithium absorption (equivalent width = 0.54 ˚A), typical of Upper Sco M
dwarfs. The Lomb-Scargle periodogram for itsK2light curve shows a single strong peak atP = 1.821 days5. When the
light curve is phased to that period, it shows a relatively flat continuum with three sharp, triangular shaped flux dips
(Figure9). The dip depths are about 3% to 7%, and the FWZI for each dip is about 0.1 in phase. Close examination
5 Because there is a brighter star located about 1300away, we have analysed a light curve derived using a 1.5 pixel aperture for EPIC
0.95 1 1.05
0 0.2 0.4 0.6 0.8 1
[image:12.612.188.432.79.383.2]36000 38000 40000 42000
Figure 8. The phased light curve of EPIC 205374937A. The two most prominent features are short duration, triangularly shaped flux dips at phases of about 0.2 and 0.6. These are superposed on a more slowly varying waveform which is broadly consistent with the approximately sinusoidal shape often produced by non-axisymmetrically distributed star spots.
of the light curve shows that the dip depths vary in time, with the time dependence being somewhat different for each
dip, as illustrated in the top-right panel of Figure9. The left-most dip is more or less stable in its depth until day 2119,
when it essentially disappears. The central dip is more or less stable in depth until day 2131, when it too disappears. The strongest (right-most) dip is quite deep until day 2089; from 2089 to 2131 it is about half as deep (and somewhat
shifted in phase), and at day 2131 it becomes significantly weaker again. There are no strong flares in the K2light
curve for this star. However, the strongest flare-like event (or events) occurs at the time of the first state-transition of
the flux dips at day 2089, as illustrated in the bottom-left panel of Figure9. There are no obvious flares of any sort
at the other two state-transitions. Finally, we note that the dip properties and the general appearance of the phased
light curve for EPIC 203692610 are quite similar to theK2light curve for HHJ 135, one of the six late M dwarfs with
persistent, short-duration flux dips identified in the Pleiades by Rebull et al. (2016).
5.3. EPIC 203962559
While EPIC 203962559 has been identified as aρOph member (Wilking et al. 2005); it appears to have no IR excess
and has relatively weak Hαemission, from which we conclude it is a WTTS. The Lomb-Scargle periodogram shows
one strong, real peak at P = 1.5402d. When phased to that period and examined closely, the light curve appears to
undergo a major change in shape at about day 2106. This is illustrated in Figure 10. Prior to that day, there were
four well-defined flux dips in the light curve; after that day, only two flux dips remain, and one of those is significantly
narrower and less deep. We are unable to determine if there was a flare at day∼2106 because that date also is when
Mars transited theK2FOV (near the position of EPIC 203962559), corrupting its light curve for∼10 hours. We can
think of no possible way for the Mars transit to induce systematic flux errors in a specific phase range in the extracted light curve for this star, so we assume this was a bizarre coincidence.
0 0.2 0.4 0.6 0.8 1 5200
5400 5600 5800
6000 EPIC203692610 P=1.821d
0.9 0.95 1 1.05 1.1
0 0.2 0.4 0.6 0.8 1 5200 5400 5600 5800 6000 6200
6400 EPIC203692610 P=1.821d
d2065-2089 d2089-2119 d2119-2131 d2131-2139
2088 2090 2092 5200 5400 5600 5800 6000 6200
EPIC203692610 - 1st transition
pre-flare flare post-flare 0.9 0.95 1 1.05
2125 2130 2135
5400 5600 5800 6000
6200 EPIC203692610 - 3rd transition
Figure 9. (top left) The phased light curve of EPIC 203692610 showing data for the fullK2campaign, illustrating the three short-duration flux dips that are present. (top right) Phased light curve for EPIC 203692610, with the data now broken up into four time windows: black (d2065-2089), blue (d2089-2119), green (d2119-2131), and red (d2131-2139). The green and red curves are shifted vertically by 300 counts. The three flux dips appear to evolve in shape with different timescales, with the main changes appearing to happen in sudden events. (bottom left) Expanded view of the light curve at the time of the first state-transition in the flux dips, showing two possible flares at day 2089 and the much reduced amplitude of the flux dips after that day. (bottom right) Expanded view of the time period associated with the 3rd state-transition of the flux dip depths (day 2131); no obvious flare or other trigger is present at that time. For the top-right panel, the normalized count rate values (RHS of the plot) apply to the blue and black points.
EPIC 203927435 has also been identified as aρ Oph member (Wilking et al. 2005); it too appears to have no IR
excess and relatively weak Hαemission (equivalent width−6.8 ˚A). The Lomb-Scargle periodogram shows two resolved
peaks, with periods of 0.4817 and 0.4162 days. After removing the signal from the star withP = 0.4162 days (which
we refer to as the B component), we find that the phased light curve for the A component shows a waveform which
is not explainable by cold spots, but that also shows some evolution during the K2 campaign. The first panel of
Figure 11 shows the phased light curve for the first 63 days of the campaign; the light curve for the last 13 days of
the campaign is shown in the second panel of Figure11. A very strong flare occurred at the transition point – third
panel of Figure11– on day 2123.3; this was by far the strongest flare for this star during the K2campaign. Prior to
that day, there were four well-defined flux dips in the light curve; after the flare, only one (weaker) dip remains. In this case, the transition between states took place over about 3 days. During the middle of that transition period, a
second weaker flare-like event occurred; see the last panel of Figure11. That event, however, has a symmetrical shape
(as was the case for the triggering events for EPIC 204918279 and EPIC 203185083).
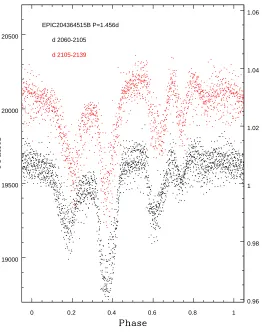
5.5. EPIC 204364515B
Bouy et al. (2006) showed that EPIC 204364515 is a possible resolved triple system, consisting of a close, equal
brightness pair with a 0.1500 separation and a fainter possible companion at a separation of about 100 (with its∼400
pixels, the K2 light curve includes light from all three stars). The Lomb-Scargle periodogram for EPIC 204364515
shows two dominant periods of 3.0863 and 1.456 days. After removal of the light from the star with P=3.086 days,
the phased light curve for the star withP=1.456 days shows four well-defined flux dips. Figure12shows the phased
light curve, where we have split the data into two windows of time (black for day 2060-2105; red for day 2105-2139). The two strongest flux dips appear to be approximately stable in position, shape and depth. The flux dip at phase
∼0.2, however, appears to shift in phase by about 0.03 in phase (10 degrees in azimuth) between the two windows.
The fourth flux dip at phase∼0.75 appears to become considerably deeper in the second time window.
5.6. Shared Characteristics of the Stars with Persistent Flux Dips
We have measured widths and depths for all the prominent flux dips in these eight stars; see Table2. The widths we
0.95 1 1.05 1.1
0 0.2 0.4 0.6 0.8 1
3000 3200 3400 3600
2060-2105
2107-2139
Figure 10. The phased light curve of EPIC 203962559, illustrating the abrupt change in shape at day 2106. The largest change
in waveform shape is near phase=0.3, but the dip at phase∼0.5 essentially disappears and the dip at phase∼0.85 weakens and
possibly shifts somewhat in phase. The second time interval data have been offset by 200 counts in they-axis in order to more
clearly show the differing light curve shapes. The RHS y-axis normalized count labels are derived for the first time interval (the black points).
0 0.2 0.4 0.6 0.8 1 4300
4400 4500 4600
4700 EPIC203927435A P=0.48198d d2060-2123
pre-flare
0 0.2 0.4 0.6 0.8 1 4200
4300 4400 4500
4600 EPIC203927435A d2126-2139
post-flare
2122.5 2123 2123.5 2124 5000
6000 7000 8000
9000 EPIC203927435A
2122 2124 2126 2128 4500
5000 5500 6000
[image:14.612.189.433.79.382.2]EPIC203927435A pre-flare flaring post-flare
0.96 0.98 1 1.02 1.04 1.06
0 0.2 0.4 0.6 0.8 1
19000 19500 20000 20500
EPIC204364515B P=1.456d
d 2060-2105
[image:15.612.182.444.82.416.2]d 2105-2139
Figure 12. The phased light curve of EPIC 204364515B. There is little change in the shape or depth of the central two dips
over theK2campaign. The left-most dip appears to move to longer phase as time progressed, and the right-most dip became
stronger in the latter half of the campaign. The RHS y-axis normalized count labels are derived for the first time interval (the black points).
to 0.15 in phase; for a typical star with P = 0.6 days, a FWZI of 0.12 corresponds to about 1.7 hours. The depths
EPIC ID Dip Number Phase FWZIa Dip Depthb
204296148A 1 0.32 0.16 3.0
204296148A 2 0.62 0.11 1.4
204364515B 1 0.19 0.12 1.5
204364515B 2 0.38 0.11 3.1
204364515B 3 0.62 0.11 1.9
204364515B 4 0.74 0.07 0.9
202873945 1 0.10 0.09 0.8
202873945 2 0.42 0.10 2.3
202873945 3 0.63 0.09 1.2
203962559W1 1 0.37 0.08 3.2
203962559W1 2 0.52 0.06 0.9
203962559W1 3 0.67 0.11 3.1
203962559W1 4 0.87 0.15 3.5
203962559W2 1 0.65 0.12 3.2
203962559W2 2 0.85 0.15 2.2
203692610 1 0.19 0.06 2.5
203692610 2 0.29 0.06 2.5
203692610 3 0.41 0.13 7.5
203849738 1 0.13 0.19 3.9
203849738 2 0.79 0.07 1.2
205374937A 1 0.17 0.16 3.2
205374937A 2 0.60 0.12 3.0
203927435A 1 0.26 0.2 4.5
203927435A 2 0.39 0.2 3.6
203927435A 3 0.63 0.14 1.4
203927435A 4 0.78 0.14 1.3
aFull-width, zero-intensity values.
bNote that for the stars which we interpret as likely physical binaries
because of the presence of two significant peaks in the Lomb-Scargle periodogram (EPIC 204296148, 204364515, and 203927435), we do not know the relative contribution to the total counts for the two stars. We can therefore derive the amplitude in counts for the flux dip, but when stated as a percent in depth this is just a lower limit. If the two stars are similar in brightness, then the reported depths would be half of the true value. For EPIC 203692610, the measured dip properties are for the time window when the dips were strongest (day 2065 to 2089).
Additional shared characteristics of these stars include:
• All eight of these stars have P < 2 days. Five of them haveP < 0.65 days. In three cases, the period derived
for the flux dips agrees with the period inferred from a spotted-star waveform, confirming that the dip period is also the stellar rotation period. For the other five, we believe it is likely that the dip period is the rotation period, but that is not proven.
• All have mid to late M dwarf spectral types (M4 to M5.5).
• The deepest flux dips for each star have depths from 2% to 7%; their widths (FWZI) are generally 0.1 to 0.15 in
phase, corresponding to about 1 to 5 hours duration in time.
[image:16.612.188.425.106.456.2]• For four of these stars, the dip depths appear fairly stable over the duration of theK2campaign. In three of the other stars, one or more of the flux dips disappears abruptly (or becomes markedly weaker) during the course of the campaign. At least two of the abrupt changes in flux dip depth occurs immediately following a flare (or flare-like event).
6. STARS WITH SHORT-DURATION, TRANSIENT FLUX DIPS
There are only four members of this class; we discuss each of them here.
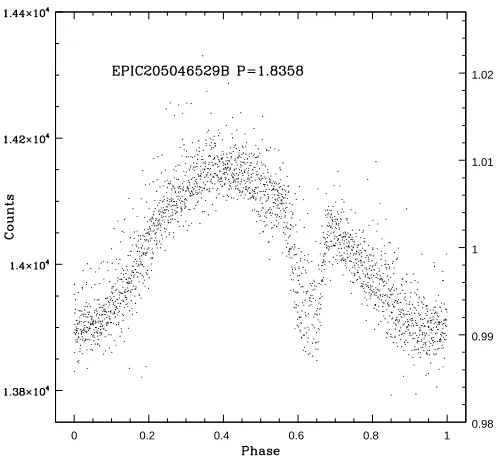
6.1. EPIC 205046529B
The Lomb-Scargle periodogram for EPIC 205046529 shows two strong peaks indicating it is a binary, with P1 =
2.5619d and P2 = 1.837d. This star appeared as a close pair in the Keck/HIRES guider camera, and we assume the
two spatially resolved stars seen with Keck correspond to the two periodogram peaks. After removing the signal from the longer period star and then phasing to 1.837 d, we noted the presence of an apparent flux dip in the light curve
for the second star. After further processing, we determined a best-fit period to highlight the flux dip of P =1.8358
days. Figure 13shows the phased light curve; the dominant feature is a spotted star waveform, superposed on which
is a well-defined flux dip centered at phase∼0.6. The flux dip, however, appears somewhat noisy either due to jitter
in the individual dip depths or their timing or both. We believe this fuzziness is primarily due to variations in the
depth of the dip both on short and long timescales. Figure14shows four 10 day windows in the light curve for EPIC
205046529B. Close examination of those traces shows that the dip depth seems to decrease slowly with time over the
K2 campaign, but also varies in depth from cycle to cycle. In order to determine better the nature of the variations
in the dip times and depths, we measured the depths and first-moment times of occurrence of all the dips where we
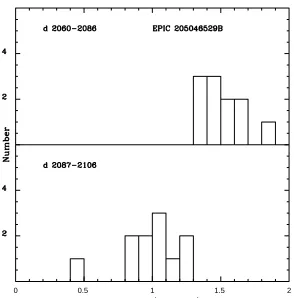
could identify a dip was present. Those times and depths are provided in Table 3. Histograms of the dip depths in
two time windows (day 2060-2086 and day 2087-2106) are shown in Figure15, demonstrating the decreasing dip depth
with time. After day 2107, the flux dip was no longer detected with certainty. Figure16shows the phased light curves
for those same two time windows, also illustrating the decrease in dip strength as the K2 campaign progressed. For
both time windows, the dip profile appears to show a shallower ingress slope compared to the egress slope. For the stronger, better defined dips, we measure a mean width (FWZI) of 0.195 days, or as a fraction of the period, (dip duration)/period = 0.106.
Table 3. Times and Depths for Flux Dips in EPIC 205046529B
Date Dip Depth (percent) Date Dip Depth (percent)
2061.45 1.5 2087.18 1.2
2063.31 1.6 2089.05 0.4
2065.14 1.3 2090.89 1.0
2066.99 1.4 2092.69 0.8
2068.81 1.3 2094.52 1.0
2070.66 1.4 2096.34 0.8
2072.48 1.8 2098.19 0.9
2074.31 1.3 2100.04 0.9
2076.15 1.5 2101.87 1.0
2083.50 1.4 2103.70 1.2
0.98 0.99 1 1.01 1.02
[image:18.612.184.433.101.330.2]0 0.2 0.4 0.6 0.8 1
0 0.5 1 1.5 2
Figure 15. Histograms of the dip depths for EPIC 205046529b for two date ranges – top: day 2060-2086; bottom: day 2087-2106. After day 2106, the dip was either not detectably present or was relatively weak.
0 0.2 0.4 0.6 0.8 1
0.98 0.99 1 1.01 1.02
[image:20.612.236.383.88.237.2]0 0.2 0.4 0.6 0.8 1
6.2. EPIC 205024957
EPIC 205024957 is the one star in our sample that appears to have a significant 24 µm IR excess; however, as
originally concluded by Carpenter et al. (2009), the lack of an excess at shorter IR wavelengths indicates that this is
likely a debris disk and not a primordial disk. Its weak Hαemission (Table 1) also supports it being a WTTS and not a
CTTS. The Lomb-Scargle periodogram for EPIC 205024957 shows a single strong peak atP = 1.6672d, largely driven
by a nearly sinusoidal spotted-star waveform; however, the phased light curve also shows a definite but fuzzy flux dip
(Figure17). We have analysed the light curve for this star in the same way as for EPIC 205046529, and reach similar
conclusions. That is, we believe the fuzzy appearance of the flux dip is due to both short and long term variations in
the dip depth, with little contribution from variations in the occurrence times for the dips. Figure18 illustrates the
short and long term variability of the flux dip depths with four 10 day portions of its light curve. Based on Gaussian
fits to the well-detected flux dips, we derive a best period for the dips ofP=1.6656d. For the stronger, better defined
dips, we measure a mean dip width (FWZI) of 0.203 days, or as a fraction of the period, (dip duration)/period = 0.122.
Times and depths for the individual flux dips we could measure are provided in Table4. As for EPIC 205046529, in
Figure19and Figure20we also provide histograms of the dip depths and phased light curves for EPIC 205024957 in
two time windows to illustrate the evolution of the dip character during theK2 campaign.
0.96 0.98 1 1.02 1.04
0 0.2 0.4 0.6 0.8 1
7800 8000 8200 8400
[image:21.612.189.435.309.533.2]0 2 4 6 8 10 7000
[image:22.612.175.432.97.353.2]7500 8000
Table 4. Times and Depths for Flux Dips in EPIC 205024957
DATE Dip Depth (percent) DATE Dip Depth (percent)
2072.48 4.3 2115.75 1.7
2074.13 2.5 2117.43 1.6
2080.78 1.0 2119.06 1.9
2084.11 0.9 2120.78 1.8
2090.83 1.6 2122.45 1.9
2095.9 1.0 2124.08 2.3
2099.08 0.8 2125.77 2.1
2100.75 0.7 2127.44 2.8
2102.43 1.0 2129.08 3.2
2104.1 0.7 2130.78 3.2
2105.75 1.6 2132.43 2.5
2109.1 1.5 2134.12 2.6
2110.8 0.9 2135.73 2.6
2112.5 1.0 2137.42 2.9
2114.1 1.3
0 1 2 3 4
Figure 19. Histograms of the dip depths for EPIC 205024957 for two date ranges – top: day 2099-2120; bottom: day 2120-2139. Prior to day 2099, the dip was either not detectably present or was relatively weak.
6.3. EPIC 204143627
The Lomb-Scargle periodogram for EPIC 204143627 shows a single strong peak atP = 1.125 days, largely driven
by a nearly sinusoidal spotted-star waveform; however, the phased light curve also shows a definite but weak flux dip
(Figure21). We have analysed the light curve for this star in the same way as for EPIC 205046529, and reach similar
though more limited conclusions due to the lower S/N for this star. That is, we believe the fuzzy appearance of the flux dip is due to variations in the dip depth, with little contribution from variations in the occurrence times for the
0 0.2 0.4 0.6 0.8 1 7800
8000 8200
0.98 1 1.02
0 0.2 0.4 0.6 0.8 1
7800 8000 8200
Figure 20. Phased light curve for EPIC 205024957, for the same two time windows as used in Figure19– left: day 2099-2120; right: day 2120-2139.
campaign, and slowly diminished in depth over the duration of the campaign. For the first time window in Figure21,
we measure a dip width (FWZI) of 0.06 days, or relative to the period, (dip duration)/period = 0.055.
0 0.2 0.4 0.6 0.8 1
7100 7200 7300
0.98 0.99 1 1.01 1.02
0 0.2 0.4 0.6 0.8 1
7100 7200 7300
0 0.2 0.4 0.6 0.8 1
7100 7200 7300
0.98 0.99 1 1.01 1.02
0 0.2 0.4 0.6 0.8 1
7100 7200 7300
Figure 21. The phased light curve of EPIC 204143627. The four panels show successive 20 day sections of the day, all phased to a period of 1.125 days. The flux dip at phase about 0.45 became less distinct and shallower as the campaign progressed.
6.4. EPIC 205483258 (RIK-210)
EPIC 205483258 is a relatively anonymous (only two references in SIMBAD as of this date) Upper Sco member. Its literature name is RIK-210 (Rizzuto et al. 2015). It is both the earliest type star in Table 1 and has the longest period. Its phased light curve is dominated by a well-defined, stable sinusoidal variation presumably due to a highly non-axisymmetric spot distribution. Superposed on that waveform is a single strong, narrow flux dip – as shown in
Figure22. The dip width (FWZI) varies from epoch to epoch, but is about 0.4 to 0.5 days, or relative to the period,
(dip duration)/period∼0.08. The dips are generally asymmetric, with a shallower and more variable ingress profile.
We have much more followup data for RIK-210 than for any of our other stars. In David et al. (2016c), we provide a
detailed examination of theK2light curve for RIK-210 and an analysis of synoptic spectra for it which we obtained with
0 0.2 0.4 0.6 0.8 1
0.8 0.9 1 1.1
0.3 0.4 0.5 0.6 0.7
Figure 22. (left) The phased light curve of EPIC 205483258 (aka RIK-210). (right) An expanded view of the light curve, highlighting the narrow flux dip. Different colors correspond to different time windows – illustrating that the shape of the flux dip varies significantly on short timescales.
star at the Keplerian co-rotation radius and with physical dimension similar in size to the stellar radius. We return to
the implications of these data in §8.
6.5. Shared Characteristics of the Stars with Transient Flux Dips
All of the stars in this class share these characteristics:
• All four stars have P >1 day. In all four cases, there is a well defined spotted star waveform in addition to the
flux dip, and both share the same period to within the uncertainties. Therefore, for these stars, we are certain that the flux dip period is the same as the rotation period.
• All have M spectral types (M2.5 to M5).
• In all cases, there is only one major flux dip per star. The maximum depths are 1.5%, 2.5%, 3%, and 20% (the
latter for RIK-210). The widths (full width zero intensity) are of order 0.1 in phase or slightly less, corresponding to about 10 hours for RIK-210 and to a few hours for the other three stars.
• The dip depths vary significantly on both short (cycle to cycle) and long (campaign duration) timescales. From
one cycle to the next, the dip can go from present and near maximum depth to absent.
• In one case for sure, and probably in two of the other cases, the dip shape is asymmetric, with the slope of the
ingress being steeper or shallower than the slope of the egress.
• Of all 23 stars discussed in this paper, only one has a relatively secure IR excess and that is EPIC 205024957.
7. FURTHER CHARACTERIZATION
How do the stars we have discussed in the previous three sections compare to other low mass Upper Sco WTTs in
terms of their basic physical properties? Figure 23provides three such comparisons – a color-magnitude diagram, a
spectral type histogram, and a period-color diagram. The color-magnitude diagram shows that despite their unusual
light curves, our stars do not appear to have unusual locations in the V vs. V −Ks CMD, other than their being
concentrated to colors corresponding to mid to late M spectral types. There is also no obvious displacement of one of our groups relative to the other two groups in this diagram (as might have been true if they sampled different
age or mass ranges). Spectral types are available for about a third of the 1100 WTTS with K2light curves, and for
>80% of the stars in Table 1. The spectral type histogram reinforces the conclusion from the CMD that our stars
are concentrated to mid to late M dwarfs. A very large fraction of theK2Upper Sco stars are M dwarfs, so the fact
Conversely, the period-color diagram does show striking correlations. Most importantly we believe, this diagram emphasizes that the stars with scallop-shell light curves segregate to the most rapidly rotating stars in Upper Sco. Several of them have periods quite close to break-up at ages appropriate for Upper Sco. The persistent, short-duration flux dip class are also relatively rapidly rotating on average, but less so than for the scallop-shells. The stars with
transient short-duration flux dips have periods that are essentially typical of Upper Sco members for their V −Ks
color.
0 2 4 6 8
20 15 10
Persistent dips
Transient dips Scallops
BHAC15, 8 Myr BHAC15, 5 Myr
0 2 4 6 8
0 20 40 60 80
Spectral Type
4 6 8
-1 0 1
Persistent dips
Transient dips Scallops
P(break-up) 5 Myr
[image:26.612.153.462.194.437.2]P(break-up) 10 Myr
Figure 23. (left)V versus (V −Ks) color-magnitude diagram for the Upper Sco WTTs withK2light curves. All of the stars
from this paper are in the lower half of the diagram (i.e., mid to late M dwarfs), but we see no striking differences among our three groups. (middle) Spectral type histogram for the Upper Sco members with known spectral types (not shown are FGK stars). The x-axis are M subtypes (e.g. “0” is M0; ”8” is M8). The stars with unusual light curves from this paper are shown
in red; they preferentially occur among the stars with spectral types M4 and later. (right) Log Period versusV −Ks diagram
for the same set of stars. The most obvious correlation here is that the stars with scallop-shell light curve morphology have among the shortest periods in Upper Sco; they also have systematically shorter periods than our other two classes. Some of their periods are very near or at the theoretical breakup period for an age of 5-10 Myr.
Figure 24provides two additional plots, both of which relate to whether the M dwarfs with unusual phased light
curves in Upper Sco have significant signposts of circumstellar disks or active accretion from a disk. The left panel
of Figure 24compares the [W1]−[W3] (3.5µm −12.0µm) color of our stars versus the other Upper Sco stars with
and without primordial disks. We label our stars as “PEV” in this diagram, for Periodic Exospheric Variables; for the
moment, this is simply a conveniently short alias. The PEV stars appear to be quite normal for theirV −Ks color,
and very well separated from the stars of the same mass with primordial disks. The right panel of Figure24compares
the Hαequivalent widths for the PEV stars to the other stars without obvious IR excesses. With one exception, the
PEV stars are again unremarkable. The one exception is EPIC 203185083 (V−Ks= 6.6, Hα=−27). Our conclusion
from this is that the types of variability associated with active accretion from a close-in disk (accretion hot spots, flux dips due to an inner warped disk or dust entrained in an accretion stream) are unlikely to be relevant for our stars.
It is also useful to compare the size of our stars to their Keplerian co-rotation radii and to distances from the star
where grains would be expected to sublimate. That comparison is provided in Figure25. For the calculations, we have
Figure 24. (left) WISEW1−W3 color vs. V −Ks for Upper Sco members with and without primordial disks (Cody et al.
2017b) and the stars from Table 1. The stars without IR excesses are shown as black dots; the stars with strong IR excesses are shown as cyan dots, and the Table 1 stars are shown as red dots. The figure legend refers to the Table 1 stars as PEVs, or
Periodic Exospheric Variables. The PEV stars appear to track well the locus of the other WTTs. (right) Plot of Hαequivalent
width vs. V −Ks for the stars without IR excesses and the PEV stars. The Hαdata comes from Preibisch et al. (2001),
Slesnick et al. (2008), Lodieu et al. (2011), Rizzuto et al. (2015), and from Table 1. The PEV stars are again normal for their
V −Kscolor, with one exception (EPIC 203185083).
adequate for our current purposes. We use the formula in Monnier & Millan-Gabet (2002) to determine sublimation
radii, with the two curves corresponding to minimum and maximum QR values of 1.0 and 4.0, corresponding to a
plausible range of sizes for silicate or carbon grains. Based on the spectral types in Table 1, most of our stars should
have masses about 0.3 M. The BHAC15 radius for such a star is 0.8 R at 8 Myr; the corresponding Keplerian
co-rotation radii for 0.5, 1.5 and 5.5 days are 1.8, 3.7 and 8.7 R. The curves in Figure 25 show that for the stars
with period near 0.5 days, dust is unlikely to be able to form or survive; dust may be able to survive at the Keplerian
co-rotation radius for the stars with P ∼1.5 days; and dust would certainly be able to form and survive for extended
periods for RIK-210, the star withP ∼5.5 days.
For the persistent and transient short-duration flux dip stars, the duration, shape and depth of the flux dip encodes information on the size and nature of the object that is transiting (or being eclipsed by) the star, if that is the correct
physical explanation for their variability. For a point source at the Keplerian co-rotation radius (Rco) whose orbit
passes through the Earth-star line, the duration of a transit (or eclipse) is just:
duration = 2R∗
(2πRco)
Prot (1)
For radii and masses in solar units and rotation periods in days, the durations are just:
duration = 0.076R∗(Prot/M∗)0.333 (2)
For an adopted age of 8 Myr, our stars have masses from the BHAC15 models ranging from about 0.2 to 0.6 M, and
corresponding radii of 0.64 to 1.02 R.
Figure26plots the dip durations we have measured in§5 and§6 for the short-duration flux dip stars as a function
of their periods, and compares those data to the duration predicted for a point source for stars with mass of 0.2 and
0.6 M. For the shortest periods, most of the stars have their maximum observed dip durations consistent with the
prediction for a point source; for periods longer than about 1.5 days, however, the observed durations are significantly longer than the point source prediction, indicating that the occulting (occulted) object has size comparable to the star. The relationship between dip duration and period appears tight based on the limited amount of data that exists, but is clearly much steeper than our simple Keplerian model.
To illustrate this point in another way, we have estimated stellar radii for each of the persistent and transient flux
dip stars. For that, we have used our spectral types and estimated V −Ks color and Table 6 of Pecaut & Mamajek
(2013) to provide intrinsic Teff, BCJ, and V −Ks color. Those data and the Stefan-Boltzmann law yield direct
stellar radius estimates; for stars identified as binaries in Table1, we have divided the system luminosity by two prior
to calculating the radius. We then derive estimates of the Keplerian co-rotation radius, adopting masses from our estimated luminosities and the BHAC15 8 Myr isochrone. The maximum duration for a point source at the Keplerian
co-rotation radius then follows from the formula above. Table 5 provides our estimated stellar radii and compares
0.6 0.4 0.2 0 0
[image:28.612.181.429.82.410.2]2 4 6 8
Figure 25. Stellar radius, Keplerian co-rotation radius and estimated sublimation radii using extremes of grain properties from Monnier & Millan-Gabet (2002), for an assumed 8 Myr age and using BHAC15 models. The Keplerian co-rotation radius is provided for three rotation periods – 0.5, 1.5 and 5.5 days – which encompasses most of the period range found for the stars discussed in this paper. The black dotted curve provides estimated stellar radii as a function of mass; the blue solid curves are the estimated Keplerian corotation radii for three rotation periods that are representative of our Upper Sco stars; and the red dashed curves illustrate approximate sublimation radii as a function of stellar mass.
properties are likely 15-20% (see, for example, similar calculations for individual planet-hosting stars by Mann et al. 2016 and David et al. 2016c). Because radii two to three times as large as we estimate would be required for the dip durations to be consistent with observations for several of our stars (including 3 of 4 of the transient dip class), we conclude that radius inflation due to magnetic effects (e.g., MacDonald & Mullan 2017) cannot explain these discrepancies and instead that the transiting/occulting body must have size comparable to the star.
Table 5. Comparison of Dip Durations to Predictions for a Point Source at the Keplerian Co-Rotation Radius
EPICa Spectral Type Stellar Rotation Keplerian Pt. Src. Max Observed Class Radius Period Co-Rotation Duration Duration
(R) (days) Radius (R) (hours) (hours)
204364515* M4.0 1.07 1.46 4.13 2.90 4.2 Pers
203849738 M5.5 0.92 0.62 1.78 2.45 2.8 Pers
203692610 M4.0 0.62 1.82 4.79 1.80 6.1 Pers
205374937* M4.0 1.34 0.63 2.36 2.72 2.6 Pers