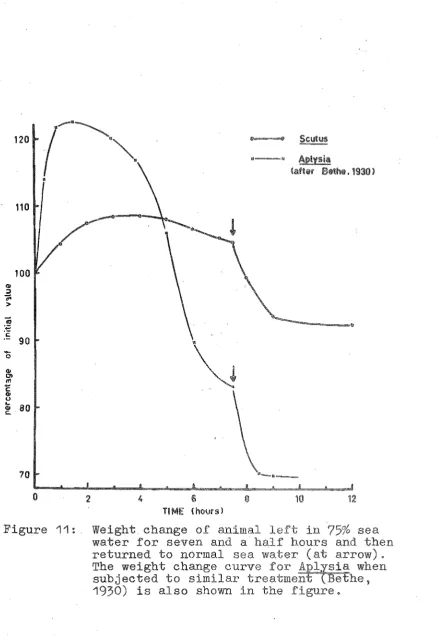
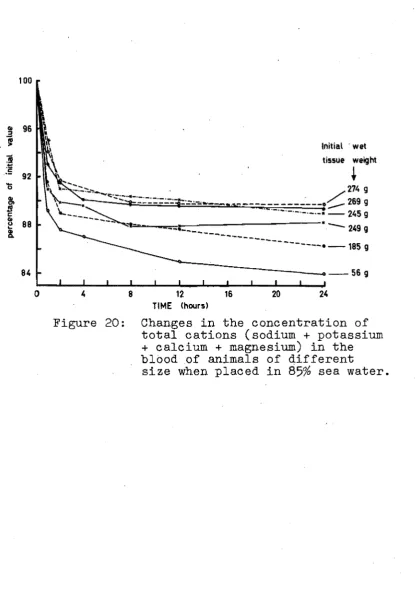
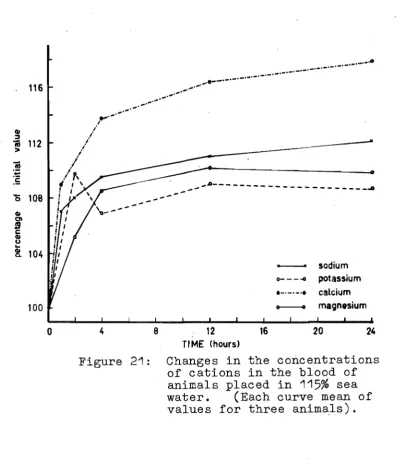
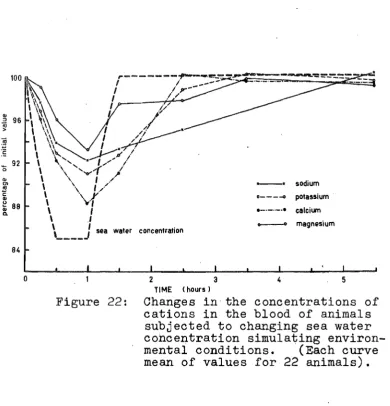
(Gastropoda:
Prosobranchia) in marine and
estuarine environments, with special reference
to blood composition and nerve conduction.
A
thesis presented for the
degree of Doctor of Philosophy in Zoology
in the University of Canterbury,
Christchurch, New Zealand.
by
Lois
EoTucker
<.;P
INTRODUCTION
SECTION
1 =SCUTUS AND ITS HABITAT
1.1
Previous work on Scutus
1.2 Distribution of Scutus
1.3 Habitat of Scutus
1.4
1
5
Estuaries in general
1.4.1
The estuarine environment
'10402
Fauna of
e sThe Heathcote-Avon Estuary
105.1
General desc
ion
10502 Salinity
s
Methods
Results
Results from other workers
Discussion
105.3 Temperature
Page
1 4 45
6 8 8 1012
12
'1313
14
15
SECTION 2 - WEIGHT CHANGES AND BLOOD COMPOSITION
19
Introduction
Methods
20201
Treatment of animals before
experiments
20203
We
20204 Sampl
concentration of sea
a specified concentration
gradient
procedure
blood
2.2.5
of osmotic pressure by
measurement of the freezing point
of the blood
of protein
27
2.2.7 Estimation of cations
29
Sodium
30
Potas
30
Calcium
30
(a) Flame photometric method of
Fawcett
&
Wynn 32 (b) The atomic absorptionspectro-photometric method
33
Magnesium
20208 Estimation of anions Sulphate 34
35
36
37
37
Phosphate203 Results
2.3.1 Weight changes of diff
~~~~~~s in media of
concentrations
38
38
38
39
40 ( a) Hypotonic media75%
sea water85%
sea water90%
sea water(b) Hypertonic medium
(115%
sea water) 40 (c) Three parts sea water/one partisotonic sucrose solution 41 (d) Simulation of environment
conditions at the Heathcote~
Avon Estuary Composition of sea water
Ratios of blood constituents to the medium in normal
(100%)
seaFreezing point depression, and c concentration changes of the (a) Hypotonic media
75%
sea water85%
sea waterCc)
Three parts sea water/one part
isotonic sucrose solution
46
Cd)
Simulation of environmental
conditions at the
Heathcote~Avon Estuary
46
2.3.5 Effect of temperature of medium
47
Ca)
Animals in 85% sea water
47
Cb)
Animals in sea water of varying
concentration as found at the
Heathcote-Avon Estuary
47
204 Discussion
47
204.1
Composition of the blood of Scutus
in normal sea water
47
204,2 Effects of variation
concentration of the
the
ernal medium
20403
Relative permeability of the body
49
wall to
ous ions
53
20404 Effect of temperature on changes in
the concentrations of ions in the
blood
58
205
Summary
SECTION 3
=GROSS AND MICROANATOMY OF
301
Introduction
302 Methods
3
2 1
Study of gross anatomy
Ca)
Dissection
Cb)
Serial sections
30202 Microanatomy and histology
303
Gross anatomy
De'scription of the gross anatomy
nervous system of
304 Microanatomy
3.4.1 Ganglia
Ca)
The outer sheath
(b) The ce rind
75
(i) stribution of ganglion
cells
75
(ii) Cytoplasmic inclusions of
ganglion cells
76
(c) The 3,,4.2 Nerves
core
SECTION 4 - NEUROPHYSIOLOGY 4.1 Introduction
4.2 Methods
402.1 Apparatus 4.202 Experiments
(a) Examination of the e
physiological properties of the connect s (b) Effect on the conduction
velocities and on the heights of the various components of the action potential of time
84
85
86
86
91
92
96
98
elapsing from initial recording
99
(c) Effect of nerve stretch on
conduction velocity
99
(d) Effect of temperature onconduction velocity
99
(e) Effect of dilution of the mediumon conduction velocity 100
403 Results 100
(a) Electrophysiological properties of the
connectives 100
Cb)
Effect on the conduction velocities and on the heights of the various components of the action potentialof time elapsing from initial recording 103 (c) Effect of nerve stretch on
conduction velocity 104
(d) Effect of temperature on
(e)
Effect of dilution of the medium
on conduction velocity
106
(i) Dilution to Solution 2 (",75%")
108
(ii) Dilution to Solution
3
(l1environmental dilution")
4,,4
Discussion
(a)
Effect of stretch
(b)Effect of temperature
(c)
Effect of dilution of the medium
4.5
Conclusions
SUMMARY
ACKNOWLEDGEMENTS
LITERATURE CITED
APPENDIX I
APPENDIX
11APPENDIX III
APPENDIX IV
Class
ation
Changing the concentration of sea
water along a specified
concentr~tion
gradient
Suction-electrode apparatus
Physi
al solutions for
electro-physiological experiments using
nerves of Scutus
108
109
110
112
113
114
116
120
1i
Figure number
1. Scutus dissected from the dorsal side. 2. Map showing areas from which Scutus was
collected.
3.
Map of the Estuary of the Heathcote and Avon Rivers, and Sumner Bay.4. Map showing sampling ons at
5.
6.
8.
9.
10. 11. 16.McCormacks Bay.
Salinity changes at McCormacks Bay Effect of prevailing wind on salinity changes.
Dilution of sea water and that produced in the To S. Scutus.
the environment oratory.
Wet tissue wei~ht and blood cation changes of animals in (a)
75%,
Cb)85%
and Cc)115%
sea water.Wet tissue weights and total blood cations of animals in
75%
sea water.Weight changes of Scutus in
75%
sea water.Weight changes of animals in
85%
sea water. Weight change of animal in90%
sea water. Wet ssue weights and total blood cations of animals in115%
sea water.Weight change of animal in three parts sea water/one part isotonic sucrose solution. Wet tissue weight and freezing po of blood of animals subjected to changing sea water concentration.
Sodium concentration and freezing point of blood of animals subjected to changing sea water concentrationo
19. Cations in the blood of animals in 85%
sea water. 45
20 Cations in the blood of animals of
different size in 85% sea water. 45 21. Cations in the blood of animals in 115%
sea watero 46
Cations in the blood of animals subjected
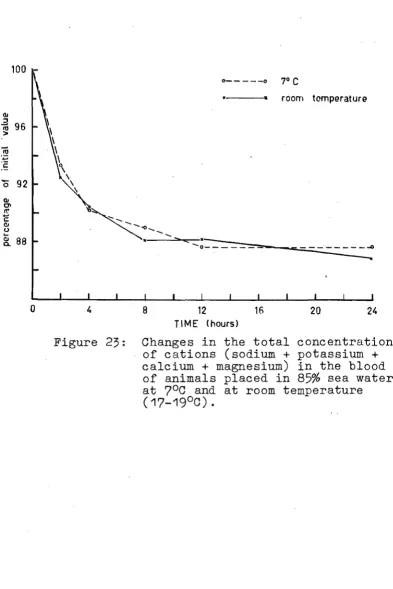
to changing sea water concentration. 46 23. Cations in the blood of animals in 85%
sea water at 7°C and at room temperature. 47 24. ium and magnesium in the coelomic
of M;x:a. 57
25. Diagrammatic representation of the central
nervous system. 69
26. view of the pleuro-pedal ganglion 27( 28. 29. 30(a) 30(b) mass.
). Sections through the pleuro-pedal ganglion mass and the pe cords. Section of cerebral ganglion (
fuchsin stain) 0
dehyde-Sec on of cerebral ganglion (rlAzanll stain) .
Section of pedal ganglia of which had been in 75% sea water for two hours prior to dissection.
Section of pedal ganglia of animal which had been in normal sea water prior to
dissection.
310 Section showing large cell with positive granules.
32(a) Arrangement of nerve chamber and electrodes. 70 71 74 75 76 76 82 94 32(b) Detail of arrangement of nerve. 94 33. Circuit used for stimulating and recording. 96 34. Compound action potential of cerebropleural
36.
Strength-duration curve of c spike.
103
37.
Effect on conduction velocities of time
elapsing from fixing nerve in position.
103
38.
Effect on the height of spikes of time
elapsing from fixing nerve
position.
103
39.
Effect of nerve stretch on conduction
velocity.
104
40.
Effect of nerve stretch on conduction
velocity of spikes
Q
and d.
104
410
Effect of temperature on conduction veloci tyo
105
42.
Effect of dilution of medium ("75%11) on
conduc
on velocity.
108
43.
Effect of dilution of medium ("environmental
di
onn) on conduction velocity.
109
44.
Experimental set-up used to obtain
predictable gradual dilution or
concentration of a solution.
iii
I N T ROD U C T ION
In 1958 Kinne wrote "What happens in an organism that is adapting-to di.fferent salini ties? Which structural or .functional alterations can be observed? Are these alterations primarily expressed on an enzyme~ protoplasmic~ cellular~ organ or nervous level? What is the physiological meaning of these alterations? We know almost nothing about these questionsofl During the ten years since Kinne wrote this, there have been many papers published on salinity adaptation, but the same questions that he asked can still be asked todayo
It is known that most marine animals which invade estuaries are able to survive in a variable brackish-water environment~ not because they can regulate the concentration of their blood independently of the
environment, but because they can tolerate large changes in the concentrations of their body fluids. Estuarine animals usually remain almost isosmotic with their
environment, and only become hyperosmotic in very dilute brackish water (e.g. see Neumann~ 1960; Todd 1964a~
1964b). The tissues of estuarine animals are able to function in a wide range of blood concentration~ but most marine forms are unable to maintain their normal vigour in salinities below about 300/ 00 (Potts and Parry, 1964).
giant nerve fibres ef the squido Hewever, nerve
functi.o~ . ingastr.op.odshasbeen inve.stlgated by many workers (e.g .. Ramsay, 1940; Hughe.sandKerkut, 1956; Kerkutand Taylor, 1956; Tauc, 1958; Tauc .and
Gerschenfeld, 1960; Hagiwara, Kusane and Saite, 1961; Nisbet, 1961). These experiments have been made with
animals frem marine and terrestrial habitats. Several neurephysielegical studies have been carried eut en fresh water lamellibranch species (e.go Salanki, Labes
and N&n~ 1964). It was theught that i t weuld be ef
interest to. study an animal which was subjected to.
variable salinity in its natural envirenment~ to. see hew this variatien in the cencentratien ef iens in the
external medium might affect the cencentratien ef the bleed and, if the concentratien ef the bleed was feund to. vary, to. see if this affected the functiening ef the nerveus tissue. Kinne (1964) stressed that a detailed evaluatien ef the effects ef salinity as an ecolegical facter required infermatien ebtained beth in nature and under specific conditiens in the laberatery~ and that the infermatien ebtained in nature should include the fluctuation patterns ef salinity. In 1967 he wrete, uIn estuarine erganisms acclimatien to. envirenmental variatiens appears to. be ef greater impertance than acc~
limatiens to. extremely lew er high intensities. Mest ef the experimental werk en physielegical aspects ef
estf o o t
-mantle _ _ --.~?
A
heart
digestive gland
- - - e y e
""\--- ctenidium
B
kidney
Figure 1:
View of Scutus specimen dissected
from the dorsal side.
(adult, approx.
natural size.)
A-B is the plane of
the section shown in Figure 8.
[image:13.544.56.453.49.520.2]uarine organisms, performed under conditions simulating
nature."
The Fissurel
gastropod, Scutus breviculus*
(Fig. 1) was chosen as the species which would be used
in this study, planned to invest
e some of the
effects of variable salinity on the physiology of the
animal.
~.breviculus is normally a marine species,
but it is also common
an estuarine environment near
Christchurch.
It was decided to subject animals to
various dilutions of sea water (such as might be
encountered in the natural environment, as well as
conditions more severe than those) and to measure the
osmotic pressure (estimated by the depression of the
freezing point), and the sodium, potassium, calcium and
magnesium concentrations of the blood of the animals
when they were placed in the experimental mediao
These
cations were chosen for analysis as, in addition to
being the common cations in blood and sea water, they
are all known to be important in conduction and/or
transmission of nervous impulses.
After analysis of
the blood had been completed, artificial physiological
solutions
lwith ionic composition close to that which
had been found for the blood of animals in different
experimental media, were prepare.do
These solutions
were used to bathe the'nerves during experiments
exam-ining the effects of the composition of the medium on
conduction in the nerves.
SEC T I 0 N 1
S CUT U S AND I T S HABITAT
1.1 PREVIOUS WORK ON SCUTUS
There has been very little published about the genus Scutus, since de Montfort classified i t in 1810. Near the end of the nineteenth century Boutan (1884, 1890a, 1890b1 1891a, 1891b) and Bouvier (1887) carried
out some anatomical studies on specimens of Parmophorus australis (=Scutus australis), which had been collected from Port Jackson, Australia. (This was the species which is now called
§.
antipodes and which is distrib-uted throughout southern Australia.) Most of the work published was on the nervous system (see Section 3), but that of Boutan also included a short paper (1891a)on the mantle and shell~ and one (1891b) on the larval form. Pelseneer (1890) wrote a short article on the mantle of Scutus and compared its form and position with that of other molluscso
A fairly comprehensive anatomical study of
Parmophorus intermedius (=Scutus breviculus) was made in Germany by Tobler in 1902~ but not much of this is
described its gross and microanatomy. Much of
MilliganUs work on the anatomy was a repetition of that which Tobler had done earlier. Milligan did state that
some of the details of the anatomy described by Tobler for uParmophorus' were very similar to those which he found in Scutus.
Morton
(1952)
has studied the role of the crystal-line style in§.
breviculus and Owen(1958)
has made observations on the stomach and the digestive gland.1.2
DISTRIBUTION OF SCUTUSSimroth (1896~1907) reported that fourteen species of Scutus were recorded from Tertiary deposits of the Paris Basin~ and that the genus was now restricted to
the Madeira Islands and the Indo~Pacific region.
Several species have been described for the Indo-Pacific
region~ but the nomenclature of these species has not remained stable; the distribution of species today appears to be
So anatinus - Australia (Cotton and Godfrey~
1938)
Philippines (Faustino~1928)
So antipoQes - Australia (Allan~
1950)
So astrolabensis - Australia (Allan)
So breviculus ~ New Zealand (Powell~
1957)
So intermedius - Philippines (Faustino)
S0 unguis (=§o granulatus) - Australia (Allan)
New Caledonia (Risbec,
1937)
Philippines (Faustino) So virgo - Japan (Habe~
1951)
Scutus breviculus is distributed throughout the
Scale 1S ,
i
o
10 20 miles1
NEW ZEALAND
Zealand. It has .not been recorded on the Chatham, Antipodes, Bounty,Auckland1 Campbell~ Macquarie or
Kerguelen Islands~ or any other islands of' the Southern Ocean outside the New Zealand faunal region (Powell). 1.3 HABITAT OF SCUTUS*
Scutus is usually found in a marine habitat~
under rocks or in crevices~ at or below low water. A specimen has been reported at Kaikoura (Fig. 2) at a depth of about 60 feet (Go Poore~ pers. comm.).
However, near Christchurch i t is abundant in some areas of the Heathcote-Avon Estuary.
The densest populations are found in regions where Ulva lactuca is plentiful. Milligan (1955) found that Ulva formed the bulk of the material ingested by Scutus in its natural habitat. Dense growth of Ulva is found in areas where sewage effluents are discharged into the water. In a Royal Commission Report (1911)~ presenting the results of investigations into the excessive growths of green sea-weeds in sewage-polluted waters~ i t was reported that Ulva could rapidly absorb nitrogen in the form of liS aline ammonia". It was also noted that~ while
Ulva could grow freely without sewage pollution~ the addition of nitrogen in a form which might be supplied
*
Throughout the rest of this thesis~ wherever the generic name Scutus is used without a specific name i t refers to the species Scutus breviculus. This was the only species on which experiments were carried out in this work. However, in places where a comparison of different species of Scutus is being made (fo,'.[' example ~in the section on the anatomy of the nervous system)~to
by sewage. was"apt to, pr.oduce,.,a, rapid ,inc,reasein the
weed.
,Hog.an, ",and ,
(1959)
,c,onsidered the
He,athc.ote,-,Avon Estuary.t.o be virtually an.oxidati.on
p.ond fer the treatment .of p.olluted waters fr.om the
,Heathc.ote River and vari.ous sewage effluentse
They
stated that such c.onditi.ons w.ould naturally enc.ourage
the gr.owth .of Ulva.
Bruce
(1952)
als.o discussed the
relationship between gr.owth .of Ulva and sewage p.olluti.on.
Milligan .observed that
- - -
was f.ound sparsely
dis-tributed except in situati.ons where Ulva was plentiful.
He f.ound p.opulati.ons .of greatest density at the culverts
unde,r the McC.ormacks Bay causeway (in the Heathc.ote-Av.on
Estuary? see Fig.
3)and at Scarb.orough, at the eastern
end .of Sumner Bay (Fig.
3)in the vicinity .of an .outfl.ow
.of sewage.
Scutus is still present in large numbers at
these l.ocati.onso
He listed Lyttelt.on Harb.our (Fig. 2)
in the vicinity .of Battery P.oint Mil
ary Camp, as
an.other area where Scutus was c.omm.on
This part .of the
sh.ore-line .of Lyttelt.on Harb.our has since been changed
by the c.onstructi.on .of Cashin Quay.
The .only .other area which was f.ound, during this
study, t.o have a dense p.opulati.on .of
was a r.ocky
platf.orm at Oar.o, just s.outh .of the Kaikoura
a
(Fig. 2).
This shelf als.o has abundant
gr.owth
and~ additi.on~
the green alga Enterom.orpha
.§l?.is
plentiful
At Oar.o Hali.otis is als.o f.ound in large
numbers;
this was the .only area in which b.oth
and
were f.ound t.o be c.omm.ono
was n.oticeable that the animals f.ound
the
estuary tended t.o be smaller than these .of the
p.op-ulati.ons at Scarb.or.ough and Oar.oo
When Milligan
cel-l
ed a sample .of
1110
animals fr.om the estuary in
.and only 6.67% of.the .sample. w.eighed .. more .than 100 g 0 Only a ... small number o£ . animals. from the estuarine .. habi.tat werewei.ghed. during the present study , and
they were all found tobe within the size .range found by Milligan in his sample. At Scarboroughand Oaro . animals with weights. gre.aterthan 200g are common; in
the present study the largest. animal recorded at
Scarborough weighed 316 g and at Oaro, 285 g. Marine organisms have been shown to exhibit a reduction in final size in areas of their distribution where the salinity is significantly reduced (Kinne, 1964) and numerous examples have been reported, especially from . '.' the N.orth Sea and the Baltic ID However, the generally
smaller size of Scutus specimens in the estuary may not be directly related to the reduced salinity to which
animals in that environment are subjected, but may rather be a reflection of the availability of food. There is also the fact that the estuarine habitat is
more easily accessible to collectors than are Scarborough or Oaro; therefore~ animals are more frequently removed from that area than from the two marine habitats~ the larger animals being collected in preference to smaller ones.
104 ESTUARIES IN GENERAL
1.4.1 The estuarine environment
An estuary is defined (Carneron and Pritchard~ 1963) as a semi-enclosed coastal body of water having a free connection with the open sea~ and within which the sea water is measurably diluted with fresh water deriving from land drainage $ ioe. the water is brackish. (Accord~
(Potts and Parry ,
1964) ).
estuary is usually .small and shallow .and is subjected tof.luctuations ofsalinity caused by flooding .and evaporation. There-fore, as differential precipit.ation of salts occurs .during evaporation, the proportion of salts tends to
.be different from that found normal sea water (Beadle,
1943).
Howes(1939)
found a significant .increase:in sulphate at the expense of chloride·1 andEmery., Stevenson & Hedg.peth
(1957)
stated that water estuaries .usually had .a higher ratio of carbonate and sulphate to chloride, and of calcium to sodium, than did sea water.In those estuaries which Day
(1951)
categorized as exhibiting a vertical salinity gradient, the incoming salt water does not mix completely with the river water, which is lighter and oats on the surface, so thatsalinity increases with deptho Day considered that, the absence of turbulent currents, the sea water started to flow in along the bottom as soon as the tide beg~n to
rise~ while the lighter river water was still flowing out at the surface. Panikkar
(1950)
noted that high salinities often prevailed in the silt-laden region of the bottom~ while Milne(1940)
and Topping&
Fuller(1942)
observed that salinity was higher in thesub-stratum than in overlying water.
Variable inity is not the only factor which might limit the invasion of estuaries by some marine forms 0 In fact~ Allee~ Park~ Emerson~ Park
&
Schmidt(1949)
concluded that salinity did not ordinarilypH and t.empe.rature might be the limiting .. f.actorsin preventing extensions of organisms into .salinity ranges .which the org.anisms.might otherwise toler.ate. Pilgrim
(1953) obtained evidence that adul t.animals of three mollusc.an spec.ies .... coul.d.survi ve quite. wide fluctuations
of salinity of .their environmental .me.dia, and stated that restriction .of .their ecological distribution in respect to salinity seemed to be related to some other factor(s), for example~ less tolerant stages in the
-:
life histories. In estuaries in temperate regions the range of temperature~ both diurnally and seasonally, is much wider than in the sea. Sumner, Louderback,
Schmitt
&
Johnston (1914) noted that at the entrance of an estuary the temperature is nearly the same as the open sea; upstream, however, the difference usually increases rapidlyo In addition to horizontal temp-erature variation~ considerable vertical variation may be produced~ for example by warmer or colder river water flowing out over the more dense brackish water. Estuarine animals are also subjected to more variable oxygen tensions and water currents than are marineanimals~ and to much suspended matter in the water and 1
in many cases~ to sustained precipitation of silt
(Hunter~ 1964)0
104.2 Fauna of estuaries
Kinne (1967) listed four physiological mechanisms which may be possessed by estuarine organisms to assist them in compensating for the i l l effects of the salin-ities experienced in their environment.
1) Escape~ which is restricted to vagile organisms.
2) Reduction of contact by
substance to cover the body surface,
(b) retreating into holes or burrows,
(c) contracting muscles to reduce the surface
to volume ratio of sensitive organs or of
the whole body,
(d) withdrawing sensitive body parts,
and(e) closing shells or comparable structures.
This mechanism is used by many marine
molluscs which have invaded estuaries, e.g.
Mytilus, Patella (Milne, 1940).
They
exclude the brackish water during that part
of the tidal cycle when it is most dilute;
however, the shell of Scutus is much reduced,
so that the ctenidia and most other parts of
the permeable body surface are exposed to the
external medium at all times.
3)
Regulation - ion regulation, volume regulation
and osmoregulation.
4)
Acclimation, a phenomenon by which organisms adjust
to alterations in the intensity patterns of
var-iation in their environment.
As has been already noted, the maj
ty of marine
molluscs are poikilosmotic
lalthough van Weel (1957)
r
scale
o 25
Figure
.3
soutH PACIFiC
OCEAN
ROCK
50 chain
Map of the Estuary of
athcotf; and Avon
limiting factor in the distribution of animals~
but that the rate of change of salinity was also sig-nificant. Many animals could adapt themselves to large changes if they occurred slowly enough.
The number of marine species in an estuary de-clines rapidly with salinity (see Dahl, 1956).
Hedgpeth (1951) noted that~ in the lower part of an
estuary~ the fauna was predominantly marine and that i t consisted, for the most part, of specieq occurring in the neighbouring seas. Of these~ the littoral species, already accustomed to daily changes in their environment, were the most obvious. Perc~val (1929), after dealing with the components of the population of the Tamar Estuary and describing the penetr~ti6n of different systematic groups~ gave a diagram of distrib-ution in relation to salinity. From this i t would seem that most of the marine species disappeared when the salinity fell below about 30-250/00. From obser-vations made by Nicol (1935)$ i t is evident that there is a big drop in the number of marine species between salinities of 35 and 25 0/00. In estuaries with a vertical salinity gradient9 typically marine species may be found in the bottom parts in some locations of the estuary, while being excluded from the surface
layers where the water is more dilute (Panikkar$ 1950). 1.5 THE HEATHCOTE-AVON ESTUARY
1.5.1 General description
'...
-
..._-_
...
"""
--'
...
...'...
---
'-
... , ... "t'''"
- - - -
-~"1-""',
,
....
...
...
---
--
---
--
""
...I' ...
,
"" '''"/
--,'
'1/"" " , ' ...
/ /
'
---, _____ '.1fI'1 >.,.. __ ---_',
1--~~==~~~~==::~~/~-~;-~-~-~-4/~/~
~~,,---~~
Scale
o
10
20
chain
Figure 4:
Map to show sampling stations A-C
at McCormacks Bay, where salinity
measurements were made.
(Location D
was not used as a sampling station in
the present study, but Fearon (1962)
made salinity determinations on water
collected at this station.
His
flats~ taking the form of a roughly equilateral tri-angle, with sides about two miles long (Fig.
3).
The Heathcote River enters the estuary in the south-western corner, the Avon River in the north and the outlet to the sea is in the south~easto On its eastern side, a bar (the Brighton sand-spit) separates the estuary from the seao At McCormacks Bay a causeway cuts off115
acres from the main body of water.Pritchard
(1967)
notes that, in bar~built estuaries, tidal action is considerably reducedo In the Heathcote-Avon Estuary~ Thompson (1929~30) found tides varied from four to six feet in height. (At Lyttelton tides of up to eight feet occur (New Zealand Tide Tables, 1966~1968))0He observed that the wind had a pronounced effect on the height of tides, an easterly wind~ (either a north~
easterly or a south-easterlY) tending to bring the tide in a little earlier~ ralliing i t to a greater height~ and keeping i t in a little later than did a westerly windo As the tide ebbs~ the large volume of water in McCormacks Bay is channelled out through three narrow culverts under the causeway~ but the bay never becomes completely empty. It is under rocks on the seaward side of one of these culverts (Sampling station B~ Figo 4) that Scutus is most abundant in the estuaryo Scutus in this location has a continuous supply of well~aerated water.
1.502 Salinity chan~
Methods
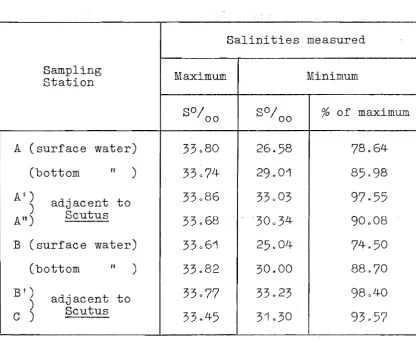
A
Maximum and mlnlmum salinities measured at
estuarine sampling stations.
(For stations A
and B the salinities of both the surface and
bottom water are shown.)
Salinities measured
Sampling
Maximum
Minimum
Station
SO/oo
SO/oo
%
of maximum
(surface water)
33,,80
26.58
78.64
(bottom
n )33074
29.01
85 98
Ai)
adjacent to
33086
03
97.55
)
An)
Scutus
33.68
30034
90008
B
(surface water)
33061
.04
74.50
(bottom
11 )33082
30.00
88.70
B')
adjacent to
33077
33.
98040
)
[image:28.544.56.473.216.559.2]% 34
100
33 "1
\
\ \
32 95 \
\ \
:; \
c:
31 \
:l! \
" \
0 \
.s 90 ~ ,
i 30
..
t: Cl 29
2-85 >- 28
...
~ ...J <t (j)27 eo
26
25 75
5:
.. _ _ depth 01 walllT
, /
"
//' r I I I I I I I I 'J
TIME (hou/s I
Changes in
surface and bottom and depth of er, a tidal cycle at station B~ McG
3
OCTOBER 11. 1\166.
seaward side of two of the culverts under the cause~
way) both surface and bottom water samples were col~
lected at intervals throughout a complete tidal cycleo Surface water samples were collected in polystyrene containers which were capped tightly immediately after collection of the samples. Bottom water samples~ in the immediate environment of Scutus, were collected with a van Dorn-type water sampling bottle and then transferred to capped polystyrene containers. All samples collected at other sampling stations (A I ~ An, Bn, C) were taken immediately adjacent to Scutus
specimenso Samples were collected at various times throughout the yearo
The majority of salinity measurements were made using an inductively coupled salinometer~ manufactured by Auto~Labo Industries. According to the specific~
ations of the manufacturers 9 this instrument has an accuracy of approximately 00003 parts per thousand for salinity measurementso
When the salinometer was not available, salinities were determined by the Mohr titration (Strickland and
Parsons~ 1960)0 This method is correct to about 0.1
parts per thousand. Results
Table 1 shows the maximum and minimum salinities recorded at the six estuarine sampling stations during this studyo The highest salinities were recorded during the summer months.
"2
m
:::J0
-5
..
CI.oD. ~
...
It!
..9-
>-!::
z ~
«
Cl)\
,.,
\
32 \ \
'.
,
\
'.
\
,
\
'.
\
\ \
\
31 \ \
\ \
\ \ \
"-
--3029 ~ ______ - L ______ ~ ____ ~ ______ - L ______ L -_ _ _ _ ~
o
2TIME AFTER LOW WATER (hours)
Figure 6: Effect of prevailing wind on the degree of dilution of the bottom water on the seaward
side of the culverts at McCormacks Bay.
3
I Sampling station B: October, southwesterly wind 11 " " B : March, light easterly breeze III " " B : October, strong easterly
Culvert
(see Month
Fig.4)
A Jan.
---
---A June
---
1---D April
1---
1---A May
B March
=---
1---A October
---
---B October
---
---B October
•
Minimum and maximum salinities~ and range of
salinity~ within a tidal cycle at culverts
under the causeway at McCormacks Bay~
Maximum Minimum Range
SO/0O SO/0O % of max-m SO/0O
33.6 21.4 63.7 12.2
r--- ---
---33.8 28.5 84Q3 5.3
r--- ---
30.5 25 .. 9--- ---
84.9 4.6---
---
---
---33 .. 90 25,AO 74.9 8050
33.50 31.30 93 .. 4 2.20
--- --- ---
---33.59 26.58 79.2 7 .. 01
33.61 29.01 86.3 4",60
---
---
---
--
---QIO---33 .. 60 25.04 74.5 8 .. 56
33.61 30.00 89.2 3. 1
~---=---
--...---
---
--33.45 28.05 83 .. 8 5.40
33 .. 50 31082 95.0 1.72
Surface (s)
or Reference
bottom (b) water
•
Mi lligan ( 1955)--- ---
•
"
---
•
---Fearon (1962)---
---s Dix (unpublished)
b
1--- ,
s b1---
Present sb study
---s b
prevailing wind and the degree of dilution of water at the culverts~ at that time of the tidal cycle when the salinity is noticeably reducedo
The sea water at Scarborough is noticeably diluted by the outflowing estuarine water. A sample taken from Scarborough soon after low tide had a salinity of
32090 / 00 , compared with the lowest measured salinity
of water collected at Lyttelton of 33.50 / 00 •
Results from other workers
Several other workers have studied the salinity changes occurring at various sampling stations, ranging from near Shag Rock at the outlet of the estuary, to the regions where the rivers enter the tidal flatso A few have taken samples from near McCormacks Bay cause~ way~ and other rocky parts of the shoreline where Scutus is found between Moncks Bay and McCormacks Bayo Salin-ity values recorded by Milligan (1955)~ Fearon (1962)~
and Dlx (unpublished) at culverts under the McCormacks Bay causeway are given, along with some data obtained in the present study~ in Table 2. Linzey (1944) observed that the salinity of the permanently filled portion of McCormacks Bay showed
rul
appreciable rise owing to evap-oration during the summer months, but he gave no salin~ity values to supstantiate his statement. Discussion
Salinities observed at sampling stations A and B on the seaward side of the culverts under the causeway show a sharp decrease about half an hour after low
about by .estuar.ine w.ater re.turning .withthe .. inc.oming tide. The water leaving the estuary soon after high water contains less river water than that leaving just before low water. It is this latter water (with the high proportion of river water) that returns with the incoming tide. Bruce (1952) calculated that 41% on one occasion, and 32% on another, of the river water that left the estuary returned on the following tide. The returning estuarine water of low salinity is forced back over the tidal flats as the tide begins to flow. As water of higher salinity, from the open sea~ mixes with the estuarine water later in the tidal cycle~
the salinity of the estuarine water rises. Estcourt (1962) noted that more salt w;ter entered the estuary at spring tide than at neaps. Although there is a similar pattern of salinity change, with a drop in sal-inity for a short time after the tide begins to flow, during both spring and neap tides at different times of the year the range of salinities within different tidal cycles shows considerable variation. This variation appears to at least some degree to be dependent on the prevailing wind (Fig. 6). Lowest salinities were recorded when there was a strong easterly windo This indicates that a strong easterly wind forces the return~
ing estuarine water~ with a high proportion of river
water~ further back up the channels of the estuary with the incoming tide. This is not inconsistent with the observations which Thompson (1929~30) made concerning the relationship between the direction of the prevailing wind and the tides in the Heathcote-Avon Estuary.
was a noticeable vert salinity gradient. (There fore, judging from the low inities which they record-ed, Milligan and Fearon would appear to have taken the samples from the surface water, which would have no direct effect on the animals living under rocks at the bottom in these arease) Linzey (1944) studied
salin-ities in the Heathcote-Avon Estuary and in discussing the phenomenon of layering (vertical salinity gradient) wrote tlEvidence pointed to a fairly extensive occur-rence of this interesting phenomenon~ but no quantit~
ative estimation was made."
As temperature changes have been reported to have an effect on the ability of an animal to osmoregulate (see, eogo~ Gunter~ 1957; Verwey, 1957; Kinne, 1964)~ i t was decided to take temperature measurements in the McCormacks Bay area, in order to obtain an indication
of the extremes to which Scutus was likely to be sub-jected its natural environment 0
The lowest temperature recorded was 6.50C and the
highest 24050C. The extreme temperatures were measured at about the time of low water~ the minimum was taken at 7030 aomo and the maximum at 3 p.m. Johns (1960) has reported a minimum temperature of 50C and Milligan a
maximum of 250C at the end of the outflow
McCormacks Bay during the summer. Mil found that below about 3.5°C Bcutus could not maintain s hold on a vertic glass surface 0
W E I G H T
C H A N G E S
AND
B LOO D
C 0 M P 0 SIT ION
2.1
INTRODUCTION
Fredericq (1885~ 1901)~ Bottazzi
(1897)?
Quinton(1900),
Macallum(1903)
and(1908)
were among thefirst workers to study the relationship between the composition of the blood of marine animals and that of the external mediumo As early as 1 ,Fredericq
observed "Le sang des Mollusques dOeau douce est pauvre en sels~ tandis que celui des Mollusques marins a
A ; "
exactement le meme gout que lleau de mer dans laquelle ils vivent". Quinton and Bottaz both noted that the salt concentration of the blood of invertebrates was equal to, or very close, to, that of sea water which surrounded them. Dakin observed that the. ood and coelomic fluids of both aquatic vertebrates and invertebrates were in equilibrium with the
media, though perhaps differing very much in concentrations of individual ions; any s the const ion of the external medium brought about a grad-ual change in the blood, to a greater or lesser degree different groups1 until a new equilibrium was set up, Many of the early workers were of the opinion that the
es of aquatic animals were permeable to water~ but not to salts and other substances present in the blood
the osmotic pressure of the blood and, at the same time an increase in the body weight of the animal. The con-clusion drawn was that the equalization of the internal with the external osmot pressure was brought about by the diffusion of water alone
However, Quinton (1900) obtained evidence that the body walls of Aplysia, and Carcinus were per-meable to chloride and phosphate ions, as well as to water. Macallum (1903), after conducting experiments on Aurelia flavidula, came to the conclusion that, for this speciesj the ce s the gastro-vascular
channels, and perhaps to some extent those covering the organisms, exerted a selective influence in absorbing the salts of sea water. Using Apllsia as an experimen~
tal animal, Bethe (1930) obtained evidence of permeabil~ ity of the body wall to several cations~ He made
calcium-free artificial sea water and found that when animals were placed in this medium there was a decrease in the amount of calcium in the blood, in these con-ditions the blood calcium concentration of
considered that the forces which tended to bring the sal t c.ontent of the blood into equilibri um with the surrounding sea water were just as great as the forces which strove to prevent the osmotic differences. The skin of those animals~ except in cases where special modifications had arisen, served only as a protective barrier preventing the loss of body colloids.
Several workers have investigated osmoregulation of prosobranch gastropods in dilute and concentrated
media~ Garrey (1905) reported on several species,
all of which were isosmotic in 100% sea watero The prosobranch Busycon canaliculatum tested in 50% sea water (h. e := 1002) showed a decrease in the osmotic
concentration of the blood (to ~i
=
1.07, within 30 hours) 0 Todd (196Lj.a) ~ Avens (1965) and Avens & Sleigh(1965) have studied osmotic pressure changes in the blood of the brackish water prosobranch Hydrobia ulvae~
in which body fluids were found to be isosmotic with the medium over a wide rang.e;of, sea water concentrationso
,~\
Effects of changes of the salt content of the medium on the osmotic pressure of the body fluids of the fresh water species Viviparus fasciatus and Theodoxus
fluviatilis were studied by Obuchowicz (1958) and Neumann (1960)~ respectivelyo Little (1965)~ in
addition to studying the osmotic pressure changes in the blood of Viviparus viviparus, made determinations of various cations in blood sampleso Segal and Dehnel (1962) found that the intertidal prosobranch Acmaea limatula did not osmoregulate over
salinities 25% to 150% sea water; mulated by Gross (1954)~ they were
the range of
lower external sa1.initieso Todd (1964b) found that Littorina was .essentially .isosmotic .in sea water of 150-50%, and was increasingly hyperosmotic in salin-ities of from 50-25% sea watero In the salinity range in which the animals were active (150-50%)~ the Littorinidae reached a new steady state of osmotic
concentration within 24 hours after transfer to a lower salinity, without any marked change in volume~ suggest~
ing that the lower osmotic concentration involved a salt loss.
Robertson (1941) stated "The body walls of all marine invertebrates are permeable to sea water ions~
and i t is not surprising that ~lteration of the external .medium causes corresponding changes in the internal
med-ium and various physiological effects on these organisms and their tissuesoi1
Robertson (1949, 1953~ 1964) has investigated ionic regulation of many invertebrates, including two
proso-branchs~ Neptunea antigua and Buccinum undatumo He determined concentrations of ions in the plasma, and in plasma which had been dialyzed against sea water and concluded that~ even in 100% sea water, the differences between the concentrations of various ions in the body fluids and the concentrations of these ions in sea water were due to an active regulation~ and not simply to a passive equilibrium between the body fluids and the sur~
rounding mediumo In gastropods~ regulation was found to result chiefly in raised values of potassium and
calcium~ and lowered values of sulphate; sodium and chloride were virtually in equilibrium across the bound~
ary membranes of the animals 0 Magnesium was found to
of the opisthobranch Archidoris. The differences which remained after dialysis were so small compared with the differences between normal blood and sea water, that i t was concluded that protein binding was insignificant as
a regulating mechanism in maintaining ionic differences between blood and sea watero A study of ionic regu-latlon in the shallow-water marine queen conch, Strombus
gigas~ was made by Little (1967)0
This work by Robertson and Little on ionic regu-lation did not include analyses on animals which had been placed in dilute or concentrated media o When the experiments on ionic regulation in Scutus were carried
out~ there appeared to be no information available about rates of ionic concentration changes in the blood of marine prosobranch gastropods placed in dilute or con-centrated mediao However~ recently, Webber and Dehnel
(1968) have published a paper on ion balance in the prosobranch gastropod Acmaea scutum and, in the study reported in this paper~ analyses of cations in the blood~
urine and cellular spaces of animals placed in hyper= and hypotonic media were made at intervals between 105 hr and one week after the animals had been placed in the experi-mental salinityo Animals used for these experiments were collected both from marine and from estuarine habit~
atso The salinity range (6.4~25050/00)~ to which the estuarine limpets were exposed in their natural environ~
ment~ was. much wider and lower than that (2900-3306 0/ 00 )
to which Scutus is subjected in the Heathcote-Avon Estuary. Webber and Dehnel found that~ after a period of time in experimental salinities ranging from 50-125% sea water, the blood Na+, CI- and Mg2+ concentrations in Acmaea were not significantly different from the concentrations of the respective ions in the experimental salinitieso
wat.er), in
75%
and50%
se.a wat.er t.he concent.rat.ion 01'Ca2+ in t.heblood was slight.ly higher t.han that in the medium 0 For marine limpets at all salinities and est~ uarine limpet s in
/125%
sea water, there was no differ-ence between blood and sea water Ca2+ values. The concentration of K+ in the blood of both estuarine and marine animals was always greater than that in the sur-rounding sea water; the equilibration time for the new K+ values to be reached varied considerably, being3-48
hours for animals placed in75%
and125%
sea water, and12-48
hours for those in50%
sea water~ Curves of the total blood ion concentration also showed variability in the equilibration time of both estuarine and marine animals in the experimental media.In this study experiments were planned to inves-tigate osmotic pressure, and sodium, potassium, calcium and magnesium concentrations in the blood of Scutus, when subjected to
(a) salinity changes similar to those normally experienced by the animal during a tidal cycle at the culvert in the Heathcote-Avon Estuary~
where Scutus is plentiful~ and
(b) salinity changes which would be more severe than those experienced by animals in the
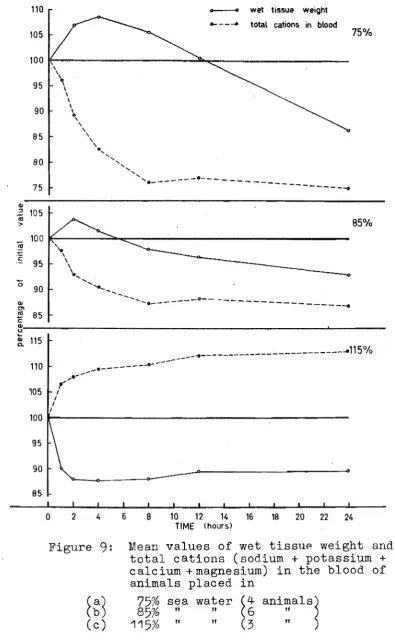
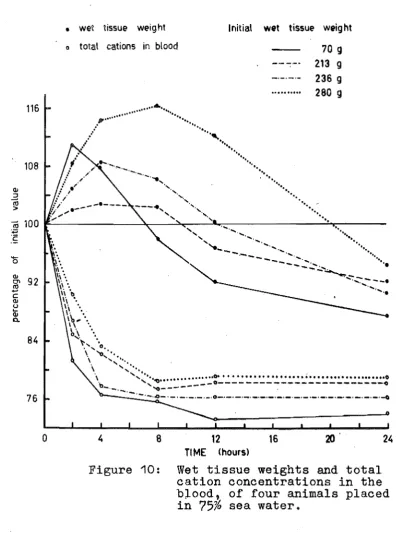
natural environment 0 The three concentrations chosen for these experiments were 75%~
85%
and115%
sea water.(75%
sea water was approxim~ately the minimum concentration measured in
subjected to a salinity change of the same order
as the
85%
sea water hypotonic medium.)
During these experiments changes in wet tissue
weight were also recorded.
2.2 METHODS
2.2.1
Treatment of animals before experiments
Male and female animals were collected from
Scarborough~
the Heathcote-Avon Estuary or Oaro, near
Kaikoura o
After being brought into the
laboratory~they were placed in aquaria of sea water collected from
Lyttelton, without food, for at least 48 hours before
the commencement of any experimentso
In the following
experiments this sea water is referred to as 100% sea
water;
its concentration varied
ightly from experiment
to experiment (Table
3), as different containers of sea
water were usedo
202.2 Changing the concentration of sea water along a
specified concentration gradient
All dilution and concentration experiments were
c
ed out in an eleven litre aquarium the water being
continually aerated and mixed by
bubbled through a
di
on blocko
Never more than
eanimals were
ed
the aquarium for any experimento
one group of
experiments~c
s in the medium
concentration were regulated to imitate those found
during a tidal cycle at the estuary where
is
found.
the laboratory, experimental media were
96
15 92
f
1 8884
o
2TIME (hol,jfs)
---1
salinities measured . . . - - during two tidalcycles at the estuary
_ _ experimental charge in concentration of
sea water
[image:44.544.51.449.23.666.2]3 4
concentrated sea water) was run into the aquarium from a constant pressure bottle, the rate of flow being con~
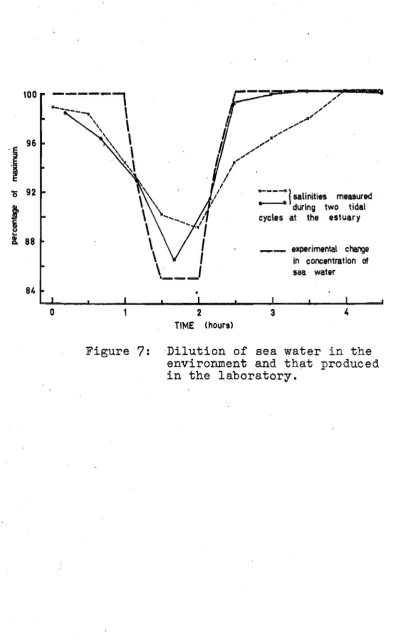
trolled by a needle valve. The solution overflowed from the aquarium at the same rate as the water (or concentrated sea water)was run ino (See Appendix 11 for detail of method). The curve of these salinity changes, which were carried out in the laboratory, is shown in Figure
70
Also plotted on this graph are two curves showing environmental salinity changes measured during two tidal cycles at the estuary. 202.3 Weighing procedureBefore animals were weighed~ excess water was shaken from the pallial cavity, and surface water was removed with a clotho Animals with weights less than about 100 g were weighed on Mettler type H6T dig. bal-ance, while larger animals were weighed on a Mettler top-loading precision balance, model P~12000 After
com-pletion of a series of weight measurements for an experi~
ment, the shell of each animal was weighed~ and the shell weight then subtracted from the total body weight to
obtain the wet weight of the soft tissueo
To determine the error due to drying and weighing
technique~ several animals were kept in 100% sea water
and weighed at various time intervals 0 With large
oesophagus
radula
Fi gt.:re 8; To S. Scutus showing the position
of th~ ~pipOdial artery from which
blood samples were taken. The
plane of this section is indicated
by line
A-B
in Figure 1. (Theshell has been removed from the
dorsal surface.)
foot
pallial sinus
experiments where the concentration change in the medium was not so great, errors in we are probably the cause of some unevenness in the weight change curveso 202.4 I Sampling of blood
The epipodial artery (see Fig. 8) was found to be the most convenient vessel from which serial blood samples could be taken. A sample,
0.1-0.2
ml.~ was collected from this vessel a disposable hypodermic syringe, fitted with a gauge needle. Determinations of freezing point, and sodium, potassium, calcium and magnesium concentrations of blood samples taken from the epipodial artery were found to be in agreement with " analyses made on blood collected from other parts of the body, for example the pedal and cephalic sinuses 0Samples not analysed immediately were stored in small, capped glass tubes at
0-4
00.
Under these con-ditions no significant change in concentrations of cations could be det after storage for one or two days 020205 Estimation of osmotic pressure by measurement of the freezing point of the blood
The freezing point depression of a solution is~ at fairly low concentrations ~ direc.tly proportional to the molar concentration of the solution, a Ol1e molar solution freezing at
086
00 Once the freezing point depressionof a on is known, its osmotic pressure can e imated by the following equation:
osmotic pressure is temperature dependent.* Results in this work are just expressed as the depression of the freezing point of the sample 0
The freezing point (or, more correctly, the melting point) of samples was measured by the microcryoscopic method of Ramsay and Brown (1955). For holding the
samples, finely drawn out pyrex tubing was found to be satisfactory; samples were drawn into these tubes immed-iately before analysiso Identical readings were obtain-ed for samples in pyrex and vitreosol tubing and, as pyrex tubing was much more convenient to draw out, i t was used· in preference to the vitreosol tubing recornmen~
dad by Ramsay and Browno Temperatures were read with a Beckman differential thermometer marked ~n 0.00200
div-isions and calibrated against the melting points of several standard sodium chloride solutions. For six standard samples the experimental error was found to be 0.00030
0.
2.206 Estimation of protein
Protein estimations were made using the Kjeldahl method for total nitrogen~ and multiplying by the con~
ventional factor of 60250 Each 1 ml. sample of blood was digested for 30 minutes with 2 ml. of a digestion
mixture~ which had been prepared by dissolving 1 g of copper sulphate and 1 g of selenium dioxide in 100 ml. of nitrogen-free~ concentrated sulphuric acid.
p
=
g x (273+t) x 760 x 22400 273 mv
wheNi v volume of solvent (ml.)
g
=
weight of substance dissolved (g) m=
molecular weightt
=
temperature (00)digestion, 10 ml. of iON NaOR were added to the mix~ ture~ which was then steam~distilled~ the steam being allowed to condenqe into 15 mlo of distilled water~
which contained three drops of methyl red indicator
(0 003% in 60% propanol) and seven drops of 0004% aqueous bromocresol greeno The solution was titrated with Oo1N RCI, the end-point colour change being from blue to grey
to red. Each millilitre of 0.1N RCI, used in the titra-tion was equivalent to 104 mg of nitrogen.
Electrophoretic separation of the protein in the blood was carried out in a 205~30% polyacrylamide gel. The buffer was a trUrglycine mixture, prepared by mlxlng 0,5% tris with 003% glycine~ so that the pR of the solu~ tion was 901; the voltage gradient was 30 volts per centimetre 0 After electrophoretic separation some
samples were stained with naphthol black to identify the protein bands, and others were subjected to the Mallory haematoxylin staining technique for copper (Lillie, 1965 po 441) to try to identify the bands which contained
copper~ which would distinguish haemocyanin from other proteinso
2.2.7 Estimation of cations
All standard solutions were made with AR grade chem-icals and dilutions with Elgastat de~ionised water.
(Elga specify that the effluent from Elgastat has total dissolved solids not exceeding 2 p.pomo) Standard stock solutions were kept in polythene bottleso All glassware was thoroughly washed~ and then rinsed with de~ionised
Most of the procedures . which have been ... p.ublished for the estimation ,Of ~ations in blood Bre for the est-imation of cations in.the .blood .oLhumans .or .. o.ther vert-ebrates" which .has a . .much .. higher pro.portion of p.rotein t.o .cations than .does the .blood of marine .invertebrates such as Scutus. .There.fore, the. l.imi ts set for these methods, due to the presence of protein in the blood, would be expected to be well beyond the conditions in the following analyses of the low-protein blood of Scutus.
Sodium
Determinations were made using an
EEL
flame photo-meter. A calibration curve was made using a standard sodium chloride solution with a full-scale reading of 0.5 mM/l. of sodium. Blood and sea water samples were diluted 4000x with de-ionised water. Analyses of 60 artificial sea water samples gave a mean recovery value of 10105 + 109%~ and standards added to blood gavesimilar recovery values. Potassium
The
EEL
flame photometer was also used for pot as-sium determinationso A potassium chloride standard solution was used, full~scale reading Oo25mM~ and blood and sea water samples were diluted 200x. The recovery for 60 artificial sea water samples was 99±
1.16%Calcium
In 1960 Willis (1960a) stated~ I1Although many methods have been described for the determination of
calcium in blood serum, they give results which vary over a range of nearly 20 per cent and there is still no agree~
oxalate-permanganate titration~ which higher than those given by compl metric methods •..• " In recent
turn are about 10% and colori= ars methods for calcium analysis using an atomic abosrption spectro~
photometer have been developed (Willis, 1960b; David~
1959). Willis reported a recovery of 100% of calcium ss than
±
2%. This from blood serum and an errorappeared to be one of the st and most accurate methods for the determination of calcium, but at the beginning of this study was no atomic absorption
spectrophotometer available for use. Therefore~ in early experiments methods were investigated, to try to obtain a sati tory one where reasonably rapid, ac-curate determinations could be made on small volumes of fluid. These luded colorimetric methods, such as that of Spare (1964)~ in which murexide (ammonium pur-purate) dis propylene glycol is the colour
reagent. s was found to be a rapid method with high
sensitivity~ 00005 ml. of blood or sea water being suf-ficient for an so However~ the presence of cop~
per the blood was found to interfere with the re tso Fruton and Simmonds (1958) stated that, although the
manner which copper was bound to haemocyanin was not clear, appe to be less stable than that of iron
the haem proteinso Therefore~ it is ssible that the experimental conditions of Spare's method, c split from the haemocyanin molecule. When c was precipitated as oxalate from the 0 I the
supernatant gave a measurable colour with
murexide, using the method of Spare. Raaflaub (19 ) found that copper ions in a concentration as low as
1 pop.m. led to a measurable colour change with murexide. Titration with EDTA has been frequently for
without the aid of photoelee The use of murexide as an indicator (Schwarzenbach, Biedermann
&
Bangerter ~ '1946) was found to be improved by the addition of Naphthol Green B as a sere agent (Knight ~
1951)"
A
sharper end-point colour was obtained with the indicator mixture of c ein and thymolphthalein (Tucker,1957)
as used by Baron and Bell(1957)
for the specifictitration of serum calcium. However, the end-point was still slightly drawn out, possibly because of the presence of phosphate (Schwarzenbach,
1957)
and, also, the EDTA-complexing reaction is ow (Lewis and Melnick~1960)0
The method Baron and Bell was used forest-imations of calc iminary experiments, but i t was not used any of the. results which are quoted in this worko
Results which are given in this section were obtain-ed either by ame photometric method of Fawcett and Wynn
(1961)$
or with an atomic absorption spectrophoto-metero(a) The_fl~e_pgo1ome1ric_m~tgoQ Qf_F~w£e1t_agd_W~nn
In the ame photometer, emission readings of c ium are affected by other substances~particularly sodium and phosphate, pres in the bloodo Sodium enhances, while phosphate sses, the emission, the inhibitory action of phosphate being prevented in part by the presence of prote (Chen and Toribara,
1953)0
Many methods forovercoming interference during calcium ions in blood with a flame photometer have been publishedo Most of these require the separation of calc from the
blood (eogo precipitation as oxalate), but with samples
.~ or less, this separation is tical and creates 1 errorso