Improving the packaging
line at SES creative
A simulation study
Bachelor thesis Industrial Engineering & Management
2
Improving the packaging line
at SES creative
A simulation study
Bachelor thesis Industrial Engineering & Management
Author
Tijmen Zandbergen S1116665 Bsc. Industrial Engineering & management
University of Twente
Drienerlolaan 5 7522 NB, Enschede The Netherlands
Supervisors
3
Preface
Before you lies my bachelor thesis, called: “Improving the packaging line at SES Creative: A simulation study”. It was written in order to complete the bachelor of the study Industrial Engineering and Management at the University of Twente. I was able to perform my research at SES Creative in Enschede and for that I would like to thank them.
I would like to thank my supervisor from the University of Twente, Ipek Seryan-Topan, for her support. With her knowledge and advice, she was able to steer me in the right direction from the start. At the feedback sessions she always took time to help me, which I much appreciate.
I would also like to thank my company supervisor, Pascal Elslo, for his support and guidance. He made me feel welcome in the company and provided me with valuable insights during our feedback meetings and gave me the freedom to execute the project my own way. Furthermore, he was always available to answer questions when needed.
Of course, I would like to thank the colleagues from SES Creative. They provided me with help, information and coffee whenever it was necessary. Everyone in the company that I needed for something was always prepared to help me and everyone was always very interested in my project. Lastly, I would like to thank my family and friends for their support.
I hope you will find this thesis an interesting read.
4
Management summary
SES Creative is a toy company that manufactures a wide array of educational toys. The packaging for all their products is done by themselves. Most of the products are packaged on the packaging line. Packaging the products costs a lot of time and it is the last step in the manufacturing process before a product can be shipped. By reducing the time that it takes to do the packaging, SES will be able to handle orders more flexibly. In this assignment, I will create a simulation model of the packaging line and this will help me to improve the throughput of the packaging line.
In the first part of the project, a lot of information is gathered about the packaging line itself and about optimization techniques and methods. With all the information that is gathered, the station speeds were determined. Then it was found that there are two bottlenecks in the packaging line. The first bottleneck is the product packing station. This is the bottleneck on slow orders. The second bottleneck is the shipping box packing station. On faster orders, this becomes the bottleneck.
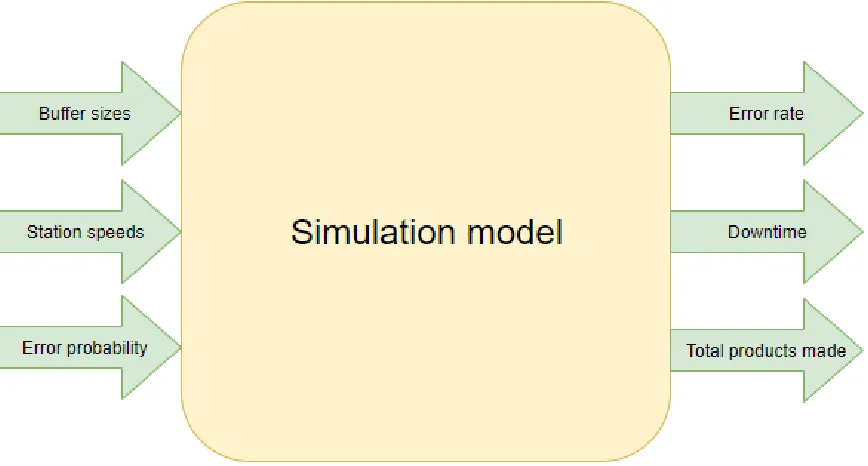
The data that was gathered was used to construct a conceptual model, that describes what the input values are in the model, how the data is handled by the different stations and what the output data should be. In the conceptual model it was decided that the output values that will be gathered are the number of errors that occur per 100 products, the total amount of downtime and the total number of products manufactured over a three-hour period. Once the conceptual model was done, the model was implemented in Tecnomatix Plant Simulation. After it was implemented the model was validated by using observational methods and the resource statistics of the software. Then, the model was verified by using software testing methods and by calculating the necessary number of replications the model needs for the output data to be reliable.
Experimentation and conclusions
With the model implemented, validated and verified, the experimentation phase could start. In the experimentation phase it was decided to conduct six different experiments in which buffer sizes, the number of products per shipping box and the number of workers were varied. Furthermore, the performance of the packaging line when the shipping box packing was automated and the influence of having an extra worker to make sure supplies never ran out was explored.
The experiments showed two possible improvements, one with automation and one without automation. By automating the shipping box packing, the throughput would be increased by 0,60% on slow orders and by 5,89% on fast orders. Next to that, automation would mean that on slow orders one worker less is needed and on fast orders, two workers less are needed. The downside of automation is that it requires a big investment. The improvement without automation shows that increasing the packaging unit to 12 could increase throughput by 4,53% for fast orders, but it would decrease throughput by 0,69% for slow orders. Furthermore, by increasing the buffer size after the gluing machine to 22 the throughput on fast orders could be increased by 2,89%. This was not tested for slow orders. An improvement that can be done in both the automation and non-automation situations is having a worker that refills supplies before they are done. This reduces downtime and can increase throughput by 9,75% for slow orders and by 14,13% for fast orders.
5 packaging instructions can be used as a feedback system for how products should be packed and what starting speed should be used per product. Furthermore, by assigning a difficulty level to each product that must be packed, the number of product packagers could be planned more efficiently.
Recommendation
Finally, recommendations are given. The recommendations are given for both the discussed situations The first one with automation, the second one without. In the case that there is enough budget available for automation, the recommendations are:
1. There should always be a worker that has enough time to refill supplies
2. An investment of maximum €125.000 should be done to automate the shipping box packing. 3. The packaging instructions should include the difficulty of the part and the box folder speed. 4. The packaging instructions should be used as a feedback tool to evaluate orders.
In the case that there is not enough budget available for automation, the recommendations are: 1. There should always be a worker that has enough time to refill supplies
2. The buffer after the gluing machine should be increased to 22. 3. The packaging unit should be increased to at least 8.
6
List of figures
Chapter 1A SES Creative product 10
Problem cluster 11
Chapter 2
2.1) The packaging line layout 17
2.2) The packaging process 19
Chapter 3
3.1) HAL/TLV 28
Chapter 4
4.1) The bottleneck walk 30
4.2) HAL/TLV for worker speeds 33
Chapter 5
5.1) Black-box model 37
5.2) The conceptual model 40
Chapter 6
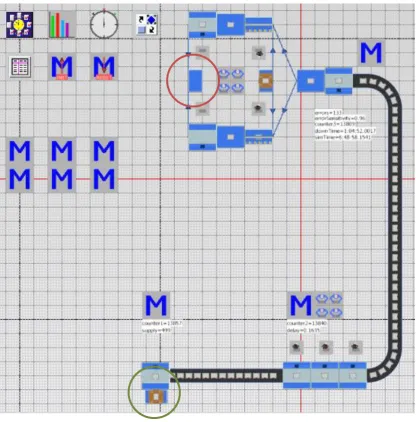
6.1) The simulation model 42
6.2) Statistics at 40% 44
6.3) Statistics at 60% 44
Chapter 7
7.1,7.2,7.3) Experiment 1 47
7.4,7.5,7.6) Experiment 2 48
7.7) Experiment 3 - downtime 49
7.8,7.9) Experiment 3 – error rate/total products made 50
7.10,7.11) Experiment 4 – Downtime/error rate 51
7.12) Experiment 4 – total products made 52
7.13,7.14) Experiment 5 – Downtime/error rate 53
7.15) Experiment 5 – total products made 54
7.16,7.17) Experiment 6 – Downtime/error rate 55
7.18) Experiment 6 – Total products made 56
Appendix A
7
List of tables
Chapter 44.1) Product groups 32
Chapter 5
5.1) Product groups that will be used 37
Chapter 7
7.1) Results 57
Appendix A
A.1) Box folder error observations 64
A.2) Product packing error observations 64
Appendix B
8
Abbreviations
PU: Packaging Unit
TOC: Theory of Constraints
OPT: Optimized Production Technique
DBR: Drum Buffer Rope
HAL: Hand Activity Level
TLV: Threshold Limit Value
9
Table of contents
Preface ... 3
Management summary ... 4
List of figures ... 6
List of tables ... 7
Abbreviations ... 8
1 Problem identification ... 11
1.1 Introduction to SES Creative ... 11
1.2 Motivation for the research ... 11
1.3 Problem context ... 11
1.4 Core problem ... 13
1.5 Goal ... 13
1.6 Methodology ... 13
1.7 Validity ... 16
1.8 Reliability ... 17
1.9 Limitations ... 17
1.10 Deliverables ... 17
2. Current situation analysis ... 18
2.1 The packaging process ... 18
2.2 Products ... 19
2.3 Packing instructions ... 19
2.4 Station descriptions ... 20
2.5 Extra worker ... 21
2.6 The operator ... 22
2.7 Data reliability ... 22
2.8 Sensor locations ... 23
2.9 Conclusion ... 23
3. Literature review ... 24
3.1 Simulation ... 24
3.2 Bottleneck detection ... 25
3.3 Line optimization ... 27
3.4 Worker speed ... 28
3.5 Conclusion ... 29
10
4.1 Bottleneck detection ... 31
4.2 Product groups ... 32
4.3 Product packing speed ... 33
4.4 Shipping box packing and palletizing speed ... 34
4.5 Failure duration ... 34
4.6 Conclusion ... 35
5. Conceptual model ... 36
5.1 Assumptions and simplifications ... 36
5.2 Input data ... 37
5.3 Output data ... 40
5.4 The conceptual model ... 41
6. Implementation, validation and verification ... 43
6.1 Implementation ... 43
6.2 Validation ... 44
6.3 Verification ... 46
6.4 Conclusion ... 47
7. Experimentation ... 47
7.1 What experiments? ... 47
7.2 Experiments ... 48
7.3 Conclusion ... 57
8. Conclusions and discussion ... 59
8.1 Conclusions ... 59
8.2 Recommendations ... 60
8.3 Discussion ... 62
8.4 Future research ... 63
8.5 Contribution to practice ... 63
References ... 65
Appendix A: Observations ... 66
11
1 Problem identification
In this chapter, an idea is given about what the project will look like. An introduction to the company itself and motivation for the research is given. The problem that has to be solved and the problem-solving method are stated. Finally, the reliability of the research and the deliverables are discussed.
1.1 Introduction to SES Creative
SES Creative develops and manufactures more than 400 different educational toys that are fun, safe and helps the development of kids between the ages of 1 to 10. In a world where digital technology is rapidly developing, SES makes sure that there’s a world outside of computers for kids to play with. They were founded in 1972 and moved to Enschede soon after. Ever since the factory in Enschede has been the only one they have. All of the processes throughout the development of the toys take place here. Some of the most popular toys that SES has
developed are Beedz and Hammer tap tap. Figure 1.1) A SES-Creative product
1.2 Motivation for the research
Ever since the rapid increase in e-commerce, the market has been changing. Less orders will be shipped to physical stores and more to web shops. Web shops don’t want to have the same high stocks as the physical stores used to have, so the shipment size has decreased drastically. This, in combination with the high seasonal demand of the toy industry makes it that SES has to become more flexible to meet the customers preferences. One of the things SES is doing to become more flexible is developing more semi-finished products that can be stocked more easily due to more manageable shape and size. By doing this they don’t have to manufacture the complete product anymore when an order comes in. Right now, SES is focusing on how to decrease the time from semi-finished product to shipment. One of the things that has been done is that they have improved the packaging line. Last year they went from 5 packaging lines to 1 packaging line with the same output. At the moment this packaging line is still not always running at capacity, so SES is looking to further develop this part of the process. In this project we’ll be focusing on improving the new packaging line, so that SES can become better at meeting more flexible demand.
1.3 Problem context
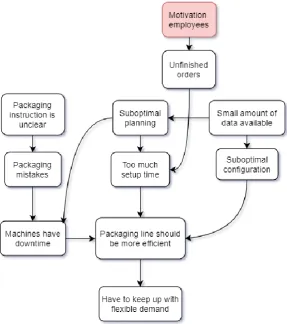
[image:12.595.322.533.160.321.2]12 Secondly sometimes orders are left unfinished and have to be finished the next day, which causes extra setup time. Sometimes, when the shift is over people will go home, even when the order has almost been finished. The next day, this order has to be finished first and has an extra setup time. It also causes a delay in the planning. This could be an indication of low motivation.
Thirdly there is only a small amount of data that is being used to make the planning and configuration for the packaging line. Data about the packaging line is available, but it either is not being collected, or it isn’t being analyzed.
All the problems that have been found have been modeled in the problem cluster (Heerkens & van Winden, 2012) that can be found in figure 1.2. The end goal that we want to achieve is to be able to keep up with more flexible demand. Currently, the packaging line still has room for improvement in terms of efficiency. The inefficiency is being caused by downtime, suboptimal configurations and long setup times. The downtime is mainly caused by packaging mistakes and incorrect machine configurations. The long setup times are caused by orders that are left unfinished and by suboptimal planning. Finally, we end up with the three possible main problems. Firstly, there might be problems with the packaging instructions. Secondly, the small amount of data that is available is not being used efficiently. Lastly, there is a possible motivation issue causing the employees to not always finish the order on the same day. The last problem however is not measurable enough to consider, therefore it has been marked red.
[image:13.595.154.442.395.720.2]13
1.4 Core problem
Out of the three problems mentioned above, we’ll choose one core problem to solve. This will help us to narrow down the scope of the project. The problem with the packaging instructions is highly specific, because every different toy has its own packaging instruction. Furthermore, it’s a difficult problem to make measurable. As stated before, the problem that employees are not motivated enough is difficult to measure as well, but it’s also difficult to say if this problem even exists without doing any extra research. The data problem definitely exists and it is a measurable problem. The only data that is being stored at the moment is the throughput of the packaging line. This means that the source of the problem is that there is not enough insight in the packaging line, because there is not enough data available. If we could collect more data about the packaging line, we can get more insight in to what happens and we will be able to improve it.
1.5 Goal
The goal of this research is to find a configuration that will improve the throughput of the packaging line. For different groups of products, there might be different bottlenecks. So, it’s important to find out what type of product groups are being processed in the packaging line. The eventual goal of increasing the packaging speed will be that SES will be able to meet more flexible demand.
1.6 Methodology
Before we start with the methodology, we’ll have to define the main research question. The research question that we will try to answer at the end of the project will be:
“How to improve the packaging line of SES in order to keep up with the flexible demand?”
To be able to answer the main research question, several sub questions will be defined. A problem solving methodology that is based on the Managerial Problem Solving Approach (Heerkens & van Winden, 2012) will be used to strucure this project.
14
Phase 1: Current situation analysis
The first step in the problem-solving approach will be to collect information about the current situation. We need to know about the lay-out of the packaging line and the variables that are involved. We also need to know what different products there are in the packaging line and how the current performance of the line is with these products. The main question and sub questions that have to be answered here are:
What does the packaging line look like now?
a. What is the lay-out of the packaging line?
b. What are the variables of the packaging line?
c. What is the current performance of the packaging line?
d. What different types of products are there?
These questions will be answered by conducting interviews with people that are involved in the packaging line. Also, information will be gathered by observing the packaging line.
Phase 2: Literature study
In the literature study we’ll be looking at what can be found in the literature about improving packaging lines. First it is necessary to learn about what simulation is and how it works. An important part of this is how to detect where the possible bottlenecks are. We’ll also need to know more about manufacturing line optimization methods. Since workers do not have a fixed working capacity, it is useful to look at methods of how to estimate worker speed. Then we’ll need to know about the restrictions and assumptions that apply to the found methods so that we can decide if they are a good fit for SES. The research question and the sub questions for this part will be:
What methods are suggested in the literature to improve manufacturing lines?
a. What is simulation and how is reliable data obtained?
b. Which methods for detection of bottlenecks are suggested by literature?
c. Which methods for assembly line optimization are suggested by literature?
d. Which methods for estimating the speed of workers are suggested by literature?
e. What are the preconditions, assumptions and restrictions of the found methods?
f. Which methods are a good fit to be used to improve the packaging line of SES?
These questions will be answered by conducting a literature study to find sources. Then the found sources will be scored for relevance and goodness of fit.
Phase 3: Data gathering
To be able to define the input values for the conceptual model, more data than just the general data that was gathered in phase 1 is necessary. In the literature research, new methods to collect data will be found and these will be applied in this phase. Furthermore, estimations of failure durations and worker capacities have to be done. It has to be decided what data needs to be acquired and what methods will be used to obtain it.
15
a. What methods found in literature are helpful to obtain more data?
b. What observations needed to estimate model inputs?
These questions will be answered by doing more in depth observations at specific stations of the packaging line.
Phase 4: Conceptual model
Before the conceptual model can be made, we’ll need to gather some information about what data will be used and what we’ll do with this data. We’ll need to know what the input and output data for the model will be. To make sure that the model will do what we want it to do, we’ll have to set requirements as to what the model’s functionality should be. We also need to decide on what assumptions and simplifications to make in the model. The research question and sub questions to answer here are:
What will the conceptual model of the packaging line look like?
a. What will be used as the input data of the model?
b. What KPI’s should be the output data of the model?
c. What should the requirements of the model be?
d. What assumptions and simplifications will be made in the model?
These questions will be answered by conducting interviews. Together with SES we will have to decide what simplifications and assumptions are reasonable to make so that we end up with a model that is a simplified version of reality but is still an accurate representation of the packaging line.
Phase 5: Implementation, validity and verification
In this step we’ll have to find out how the model can be implemented in such a way that it gives the information that we want and, in a way, that the information is correct. The requirements that are set in the conceptual model must be checked so that we know for sure that all the functionality is implemented in the model. The data that is found has to be compared to data gathered from the existing packaging line so we can check if the simulated data is accurate. The research question and sub questions that we’ll answer are:
How can a valid and verified model be implemented?
a. How can the model be implemented?
b. How can this model be verified?
c. How can this model be validated?
16
Phase 6: Experiments
When the experiments will be conducted it’s important to think about what experiments are relevant to conduct. When the experiments are done the results should be stored in correct way and they should be used to calculate the KPI’s that we want to evaluate. The research question and sub questions that will be asked are:
Which experiments will be conducted?
a. What experiments are relevant to conduct?
b. What are the desired results of the conducted experiments?
c. What are the results of the conducted experiments?
Before these questions can be answered, the previous questions have to be answered. When the system is completely implemented and optimization methods have been found, we’ll know what experiments will be valuable to conduct and what we would like the results to be.
Phase 7: Advice
In giving the advice we’ll have to interpret the results from the experiments. When we know what the results mean, we can decide on a configuration that works best. However, there will be limitations to the model. It will be important to define these limitations and be aware that they exist. The research question and sub questions that will be asked are:
What advice will be given to SES?
a. What conclusions follow from the results of the experiments?
b. What is the answer to our main research question?
c. What configuration will I recommend to SES?
d. What are the limitations to the model?
e. What are the possibilities for future research?
The answer to these questions will be based on the outcome of the experiment. The experiments will be analyzed and the outcome will be evaluated to create an advice.
1.7 Validity
Validity can be defined as to whether a measure accomplishes its claims (Cooper & Schindler, 2014). Two varieties of validity are considered, internal and external validity. Internal validity asks if the conclusions that we draw truly imply cause. External validity asks if an observed causality is generalizable. Both these forms of validity are highly important to this research.
17 The external validity in this project will check if the results that we get are generalizable for other products or product groups. One of the simplifications that we’ll work with is that the products will be categorized. This generalization will mean that we’ll lose some of the more product-specific data. To ensure that the results will still be externally valid, we’ll have to beware of overgeneralization. In this project we’ll have to be careful not to group products together that aren’t comparable. Just like with the internal validity, we’ll have to be aware of this in the problem analysis phase.
1.8 Reliability
Reliability is the matter of whether a technique, applied repeatedly to the same object, yields the same result each time (Babbie, 2010). According to that definition, simulation is a reliable way of gathering data, because the program won’t decide by itself that it’ll generate data differently. However, it is important that I keep running the simulations with the same settings. In the experimentation phase I will probably run different experiments with different settings. These settings shouldn’t change too much in between experiments so that they will still be comparable. To ensure reliability of this research we must beware of changing too many variables at the same time in the experimentation phase.
1.9 Limitations
The research will focus on the packaging line. The production process and the warehousing before the packaging won’t be analyzed. The warehousing and shipment after the packaging process will also not be analyzed. The duration of the simulation will be limited to one order at a time. Not all the individual products will be tested, instead, a categorization will be made to specify different types of products, depending on variables such as box size and the packaging complexity.
1.10 Deliverables
At the end of this project, the following products will be delivered:
1. An analysis of the performance of the current packaging line will be given. This analysis will show how the different stations perform and could give an idea of where improvement is possible.
2. A simulation model that shows how the packaging line would perform with the proposed optimization methods. The data that will be generated from the simulation will show how much improvement of the packaging line is possible.
18
2. Current situation analysis
To get a good idea of what is going on at the packaging line, more general information about the packaging line will be given. This chapter will review what the packaging process looks like and what type of products are being made. It will discuss the different stations of the packaging line and explain how they work. Furthermore, it will give an idea about how data is collected and the reliability of this data.
2.1 The packaging process
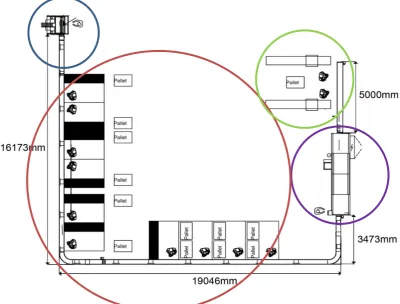
Packaging is done in a flow-shop system. In a flow-shop system, the products move in a sequential order that is fixed. So there is no way for a product to skip a station or move backwards. The floor plan of the packaging line can be found in figure 2.1. The first station in the top left corner of the picture, marked blue, is the box folding machine. This machine folds the box that the separate parts of the toy will go into. Next, it puts the box on the assembly line. On the assembly line there are workers, marked red, that each have one or several parts to put in the box while it keeps moving forward. The box continues on the assembly line and goes to the gluing machine, marked purple. The gluing machine glues the borders of the box and folds to close it. After the box is glued, the assembly line puts it in a buffer. From this buffer there are usually two workers, marked green, that put the boxes in a shipping box. Once the shipping box is full, they close it and put it through a taping machine. Here it will go into another buffer. The same workers that pack the shipment boxes are responsible of getting the boxes from this buffer and putting them onto a pallet. Once the pallet is full, one of these workers takes it to the storing location and gets a new pallet.
[image:19.595.77.478.437.741.2]19
2.2 Products
A finished product consists of a folded box, the parts of the toy with the instructions and the glue to close the box. Per product, the box size, amount of glue that is used, the amount of parts and the parts itself can be different. The amount of glue that is used is small enough to make it a negligible part of the process, so only information about the other three components will be gathered. Seven different box sizes are being used and there are three different base sizes and three different height sizes. These seven sizes are made with the use of three molds. Two of these are adjustable in height, the final mold has a fixed size.
The amount of parts that will go into the box can vary strongly. It is decided completely by the product development department. Simple products have almost no parts and it is not uncommon to have more than ten parts in one box with some of the more complex products.
There are a lot of different parts that can go into the product. Some products belong to a series of products and, therefore, are very similar. Other products are highly specific. Since the parts are being put in the box manually, the size, shape, weight and the amount of experience the worker has with the part strongly influence the speed of this process.
2.3 Packing instructions
When a product is developed, a packaging instruction is made. The packaging instruction contains information about out of which parts the product consists. It gives a list of the parts and the quantity of that part that should go into the box. In addition, the instruction tells in what order the parts should be packed and if special placement in the box is necessary. Sometimes parts can shift around or easily fall out of the box. In that case, the packaging instruction can say that this part should be packed first, so that other parts will keep it in place.
20
2.4 Station descriptions
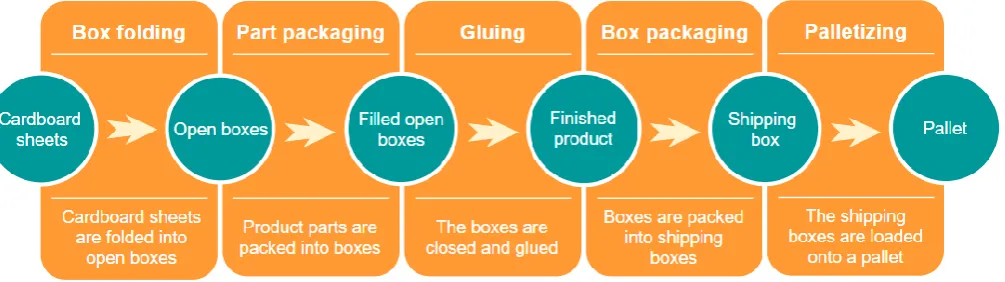
In the next section, the characteristics of the stations will be discussed one by one. We will talk about what the station exactly does, how fast it does it and how many errors can be expected. An overview of the processes involved can be found in figure 2.2.
Figure 2.2) The packaging process
Station 1: The box folding machine
As input the box folding machine gets sheets of cardboard with pre-creased lines where the box should be folded. These sheets have the final design of the box printed on them already, so the sheets are specifically used for one product. The machine gets one of the sheets and uses a press and a mold to shape the box. Then it puts the box on the assembly line. The maximum throughput of this machine according to the specifications is 60 boxes/minute. However, it has been measured to have a throughput of 66 boxes/minute, so this is the value we will use.
Malfunctions in this machine can occur when the sheet is wrongly aligned to the mold. However, after proper calibration and testing, this never happens. In practice, this machine will only give an error when the sheet supply is depleted. Whenever an error stops the assembly line, this machine will keep working for four seconds to clear the exit.
Station 2: Product packaging
To put the separate components of the toy into the box, a series of workers on an assembly line is used. Each worker puts in one or more parts into the box, depending on how easy it is to grab it and fit it into the box. Packing several products is significantly more difficult than packing one product. Because of the wide range of products, throughput varies a lot in this station. The lowest measured throughput is 21 boxes per minute and the highest observed throughput is 40 boxes per minute. Since the speed at which the parts are packed varies strongly, different levels of difficulty should be identified. In order to get an estimation of the work speed in this station, extra research will be done in the literature study.
[image:21.595.45.548.154.295.2]21 over the edge of the box. This will cause the gluing machine to not be able to close the box and it will malfunction.
Station 3: The gluing machine
When a box enters the gluing machine, first the machine will fold the box to close it and it will glue one side of the box. Then it will turn the box 90 degrees and it will glue the other two sides. The machine uses a vacuum to keep the boxes from moving around on the conveyor belt too much. This is especially necessary for the lighter boxes. Boxes that have heavy products in them can have a lower vacuum setting. Boxes must go through this machine one by one. If two boxes enter the machine while touching pull a space between them and glue them individually
Changing the settings on this machine is very complex. When the speed changes, the gluing time has to be manually adjusted to this very accurately. Therefore, this machine is always operating at 90% of its maximum capacity. This gives it a throughput of about 54 boxes per minute.
The gluing machine can malfunction in several ways. The most common reason for malfunctioning is that the box is not packed correctly, and an object will prevent it from closing. This will cause the box to get stuck in the machine. When a box gets stuck, it has to be removed before the machine can be started again. The machine can also malfunction when the vacuum is set too low. This will cause the box to move around in the machine and can cause it to get stuck as well. The last way that the gluing machine can malfunction is when the glue is depleted. This usually doesn’t happen, because before it is empty an alarm light will give a signal and it will be filled before the supply is completely empty.
Station 4: Shipment box packaging and palletizing
The conveyor belt that carries the boxes out of the gluing machine always runs at 100% of the maximum speed. It puts the boxes in a buffer that has a size of 10 to 15 boxes. The size of the buffer depends on the product size. There are four different sizes of shipping box sizes. These fit either 4, 5, 6 or 8 finished products. Two workers get products from the buffer and put them in shipment boxes. When the box is full, they push the box through a box closing machine and it will be put in another buffer with buffer size 8. From here the boxes are stacked on a pallet by the same worker. Most workers have a routine of how many boxes they pack before they stack them on the pallet. Through observation it is determined that after every four to six boxes, they are stacked on the pallet. When the pallet is full, one of the workers will move it away and will get another pallet. Malfunctions occur when the workers cannot keep up with the output of the gluing machine. When the buffer after the gluing machine is full, the entire packaging line will stop. The buffer is considered to be full when a sensor is blocked for four seconds. In the meantime, the machine will keep gluing boxes and will empty the machine before pausing. When the sensor that measures if the buffer is full for is free for another four seconds, the line will start running again.
2.5 Extra worker
22 capacity of the workers packing the shipment boxes, because they don’t have to move from their spot to put the boxes on pallets anymore.
2.6 The operator
The operator is responsible for changeovers between orders and to adjust during the order to manufacture at maximum speed. The setup time can vary quite a lot, depending of what the next order is. When the box size is the same, no adjustment is needed except for changing the input. There are adjustable parts for the box folding machine that allow for a short setup time, because there are only some adjustments. In other cases, parts must be swapped. After this setup is done, it is tested and some of the successfully folded boxes are used to test the gluing machine. The gluing machine must be adjusted if there’s a new box size. When it is adjusted it needs to be calibrated. If the weight of the boxes is different, the vacuum has to be adjusted. In total, this takes about 15 to 20 minutes.
When both machines are adjusted for the new product, the correct information will be filled in for the measuring system. During all these processes, the workers should have enough time to get supplies for the new order. When the order starts, usually the operator has an idea of how fast the packaging line can run for that product. For products that don’t have a clear starting speed, it will start at 45%. When there are a lot of errors, the operator will decrease the speed. If there aren’t a lot of errors, the operator will increase the speed. Adjustments are usually made in steps of -5% or + 5%. The speed at which an order can be handled depends greatly on the amount of people that are packaging and their experience with the component that they are packaging.
2.7 Data reliability
Data is being gathered in three ways. There is data that is available through observation, through the administration and data that is being measured by sensors in the packaging line. The data that is available through the administration is reliable information, because the administration provides constant values. The observed data will be an estimation, so it is a form of abstraction. The
measured data is the least reliable because of multiple reasons. Firstly, the sensors might not always register what they want to measure correctly. For example, a sensor that counts the boxes that pass by counts two boxes as one when they are touching. Secondly, the data that is being measured is based on highly specific situations. If multiple measurements of the same product had a different number of workers, this will result in big differences. Thirdly, sometimes the operator will make mistakes while filling in the data or forgets to stop the program when the order is done. This will corrupt all the data that is based on the duration of the order. Lastly, since the packaging line is relatively new, there haven’t been a lot of measurements yet and the system is still being developed. This means that there is only a small amount of data available and the data that is there includes a lot of test data or data that is gathered using different methods.
Since there is a lot of unreliable data available, it is important to have a critical look at what data can be used. Since the eventual goal is to optimize the throughput of the packaging line, there should be a way of determining the speed of the packaging line. The amount of downtime plays a big role the throughput of the packaging line. So, a reliable way of counting the malfunctions must be found. Duration of the order is an unreliable factor in the measurements. This means that the found
23 has been running. The box folding machine is the source of the whole process. If the input is 30 boxes per minute, the output will not be higher than 30 boxes per minute. The box folding machine speed therefore gives a good indication of the speed at which the packaging line is running.
To find the error sensitivity it is important to know what happens when the packaging line
malfunctions. In case of a malfunction, the box folding machine will always shut down. This means that the amount of times that the box folding machine is started is equal to the number of
malfunctions. However, since time is not measured accurately, it is not possible to calculate the number of malfunctions per unit of time. However, the planned order size is known. By using order size, the error sensitivity can be expressed in malfunctions per 100 products.
2.8 Sensor locations
There are four sensors placed on the packaging line. The first sensor is place at the supply of the box folding machine. This sensor measures when the supply of unfolded boxes is almost depleted. Once the supply is depleted an orange flashing light will turn on so that someone can go and fill the supply. This sensor doesn’t measure any data that will be saved. The second sensor counts how many boxes pass through and is placed right after the box folder. It is important that there is a space between the two boxes. If two boxes are touching, the sensor will count them as one box. This data is saved as the number of products that is correctly folded and gives the speed of the box folder in real-time. The third sensor also counts the boxes and is placed right before the gluing machine. The fourth sensor is located after the gluing machine and measures if the buffer is full or not. Once the sensor is blocked for four seconds, it will shut down the entire packaging line. No data is stored. This sensor is placed behind the first worker and therefore it also counts how many boxes pass the first worker. This number is an indication if both workers are working at the same speed or not. It doesn’t save the data, it only shows the real-time information.
Other data that is being gathered is: total amount of workers, total amount manufactured today, time past, downtime, break time, number of stop buttons, time it was stopped, box folding start ups and average throughput.
2.9 Conclusion
24
3. Literature review
To get a better understanding of how to improve the packaging line, a theoretical background is necessary. We will take a look at what simulation is and how it works, some methods for detecting bottlenecks and resolving them by using line optimization methods. Finally, we will try to get an idea of how to estimate worker speed for repetitive actions.
3.1 Simulation
In the next section, literature about simulation will be discussed. We will take a look at what simulation is and how reliable data can be collected.
What is simulation?
Simulation is a technique that is used to numerically calculate a model by changing input values to see how they affect the performance of the model, given by output values (Law, 2015). A simulation can be terminating or non-terminating (Robinson, 2014). When a simulation is terminating it has a natural endpoint. When a simulation is non-terminating, there is no endpoint, so the simulation can keep running indefinitely.
Three dimensions determine what the type of a simulation is (Law, 2015). A simulation can be static or dynamic. In static, or steady-state, simulations a system is calculated in an equilibrium, which means that time is of no influence on the simulation. In dynamic systems, the results change over time. A simulation can be deterministic or stochastic. In stochastic systems the model contains some kind of probabilistic component. When this is not the case, a model is deterministic. A simulation can be discrete or continuous. In discrete systems, the state of the system changes at certain points in time. In continuous systems, the state of the system is constantly changing and are not triggered by events.
Acquiring reliable data
There are two issues that should be addressed when trying to get reliable output from a simulation, the initialization bias and obtaining sufficient data (Robinson, 2014). The initialization bias applies to non-terminating simulations and terminating simulations that do not start and return to an empty condition. In this case, the simulation needs some time to adjust for the empty state at the start and the first couple of replications have to be removed. In terminating simulations that start from and return to an empty condition, an initialization bias is not necessary.
Obtaining sufficient data can be done in two ways. It can be obtained by a single long run, or by performing multiple replications. A single long run only applies to non-terminating simulations. For terminating simulations, the only option is to perform multiple replications. The number of
necessary replications can be calculated by using the confidence interval method (Robinson, 2014). With this method, a value d is chosen that will decide how reliable the data will be. This value will be compared to the value of the formula that calculates the width of the confidence interval, relative to the average of all of the replications. Once this value is smaller than d, there are sufficient
25 𝑆
√𝑛 × 𝑡𝑛−1,1−𝛼 2
|x̄| < 𝑑
With:
n = the number of replications x̄ = The mean of the output data
S = The standard deviation from the output data
Tn-1, 1-α/2 = The value from the student’s T distribution with n-1 degrees of freedom and with a
confidence of 1-α/2
In theory, it is necessary to calculate the number of replications for every experiment. In practice, the number is usually determined for the base model and then overestimated so that it can be used for all the experiments (Robinson, 2014).
3.2 Bottleneck detection
In the next section several methods for bottleneck detection that can be found in literature will be reviewed. Six different methods were found and at the end of the section, a comparison of the found methods will be made.
Turning point method
The turning point method was developed by Li, Chang & Ni (2007). This method is based on the time that stations are being blocked or starved. By calculating where the “turning point” is, this method will find the bottleneck. To find this turning point, the method relies on complex calculations, but an easy method for approaching the turning point would be to see where the difference between blocking and starvation time turns from positive to negative. Furthermore, the sum of both blocking and starvation time should be lower than the sum of blocking and starvation time in the neighboring machines.
This method is very well applicable to flow shop systems, but there are several problems, first of all, it relies heavily on data for each machine. There needs to be a way to find out when a machine is blocked or starved and how often this happens. Furthermore, there are systems in which the turning point method is not able to find the bottleneck at all (Roser & Nakano, 2015).
Bottleneck walk
26 identify where the bottleneck will be in complex systems, especially when there’s no fixed sequence of machines such as in job shop systems but will work just as well in simple systems. Because in most systems the bottleneck will change from time to time, it is a good idea to perform the bottleneck walk multiple times.
Arrow method
The arrow method (Kuo, Lim & Meerkov, 1996) uses starving and blocking information to point out in which direction the bottleneck can be found. Instead of using starvation and blocking times such as the turning point method, the starvation and blocking frequencies are used. If the blocking frequency is larger than the starvation frequency of the next machine, the bottleneck will be downstream. If the starvation frequency is larger than the blocking frequency of the next machine, the bottleneck will be upstream. The arrow method is specifically designed to identify bottlenecks in serial production lines. However, just like with the turning point method, specific data is required to be able to apply it. Furthermore, when tested it fails to detect all bottlenecks in different kinds of systems (Roser & Nakano, 2015).
Active period method
The active period method was developed by Roser, Nakano & Tanaka (2002). It focusses on the active period of each machine to find a momentary bottleneck. The active period is the period in which the machine is not waiting for parts or materials. The machine that has the longest uninterrupted active period is considered the momentary bottleneck. The machine that is the momentary bottleneck most of the time is considered the average bottleneck. By starting with a momentary bottleneck, this method works even when the bottleneck can shift over time. It is applicable for complex job shop systems as well as simple flow shop systems. When tested by Roser & Nakano (2015), this method detected all the bottlenecks.
Simulation
Simulation can also be used to identify bottlenecks. First a simulation model must be constructed. Then throughput analysis will be carried out to identify where the bottlenecks are. The quality of a simulation model depends on many factors, such as how closely the simulation can appropriate the real world and the skill level of the programmer (Li, Chang & Ni, 2007). Problems of the simulation method are that it’s not a flexible method, since every production line needs a new simulation and it has high costs to make a simulation. In general, it isn’t efficient to build a simulation model just to do throughput analysis. However, using simulation doesn’t exclude other methods. It can be used as a source of confirming the adequacy of another method (Kikolksi, 2016). Simulation models will also be useful for finding ways to remove bottlenecks, because it allows to run experiments without having to do any actual physical testing.
Utilization/Waiting times/Queue length
27 comes to systems in which the bottleneck shifts over time, Roser & Nakano (2015) have proven these methods to be inaccurate.
Conclusion
When we look at the found methods, two types of methods can be found, those that apply to static bottlenecks and shifting bottlenecks and those that only apply to static bottlenecks. Since it is likely that our bottleneck problem is located in different stations for different product groups, it is a good idea to investigate methods that are able to detect shifting bottlenecks. Roser and Nakano (2015) state that it is imperative to first detect the momentary bottleneck before calculating averages of the overall effect on the system and that methods that use averages before detecting the bottlenecks are likely to fall short. From their analysis, the active period method is considered the best one for data-rich environments. The bottleneck walk is considered the best method for an observation on the shop-floor. Simulation can be considered a separate type of method, since it’s able to use any of the other methods. Therefore, simulation is a powerful tool to use for confirmation of the used methods. In this project, the bottleneck walk will be used to detect the bottleneck, then simulation will be used to validate the bottleneck walk.
3.3 Line optimization
In the next section, literature about line optimization will be discussed. First, we will discuss the theory of constraints, then optimized production technology and finally the drum buffer rope method. At the end we will look at which of the methods are useful for our research.
Theory of constraints
The theory of constraints (TOC) (Goldratt, 1988) was developed to increase throughput of an entire production plant. It introduces the idea that bottlenecks can influence the throughput of the whole production process. By focusing on the exploitation of bottlenecks the efficiency of the plant can be improved. The theory of constraints can be applied by using the five focusing steps. First, the current constraint should be identified. This is will be the process that is limiting the rate at which the goal is achieved. In the second step the bottleneck should be exploited. This means that with existing resources improvements should be made. Thirdly, all other activities should be subordinated to the bottleneck to make sure that they support the needs of the constraint. In the fourth step, if the constraint is still there, actions are considered that can be taken until the constraint is eliminated. In the last step, the process will be repeated.
Optimized production technology
28
Drum buffer rope
The drum buffer rope (DBR) (Slack, 2016) methodology follows from the TOC and the OPT. It uses analogies to find a solution for planning and scheduling problems. DBR says that there is always a process in the plant which is limiting capacity. This limiting process is the bottleneck and therefore, it sets the pace for the other processes as if it is a drum, setting the rhythm. It is important that the drum is not disrupted, so planning behavior has to be focused on exploiting the drum. The buffer is used to protect the drum. By making sure there is a buffer in front of the bottleneck process, the bottleneck station can always be active. The processes in front of the bottleneck should be synchronized to the bottleneck, so that the buffer will remain full, but it won’t overflow. This
synchronization is as if these processes are tied together and therefore move at the same pace. That is why the synchronization is also called, the rope.
Conclusion
The TOC is a strong basis for improving the packaging line. This iterative concept can be used to keep improving the packaging line over time. However, the TOC does not give any specifics on how to optimize anything. It is more a general method for improving plants. OPT Gives a more specific idea of how to look at bottlenecks and how to work with them, but it still is a very general method that states rules about plant design. As long as these rules are followed, a production system should be working efficiently, but it still only gives a general idea of how to look at bottlenecks. The DBR method gives a more specific solution to the problem. It introduces the idea of buffering and communication between stations to improve the workflow.
For this project, the theory of constraints will be used as a mechanism to detect and solve the bottleneck. The drum buffer rope method will be used in the experimentation phase to analyze the existing buffers and possibly add new buffers to the system.
3.4 Worker speed
In the next section we will discuss literature about how to estimate worker speeds for repetitive action. This will help to get an idea of how fast the workers in the product packing station can work without getting injured. Two methods will be discussed, the OCRA method and the HAL/TLV method.
OCRA
An estimate of average worker speed for repeating actions at a high frequency can be found when looking at the occupational repetitive action method (Occhipinti, 2008). The OCRA method is a complex method for determining how many actions per minute a worker can do without it being hazardous for physical health. The method starts with the action frequency constant of 30 actions per minute and adjusts it depending on the specific movements made and the force used. According to the OCRA method, more that 40 actions per minute can only be done for periods shorter than an hour. More than 40 actions per minute for longer than an hour has too high of a risk of injury.
HAL/TLV
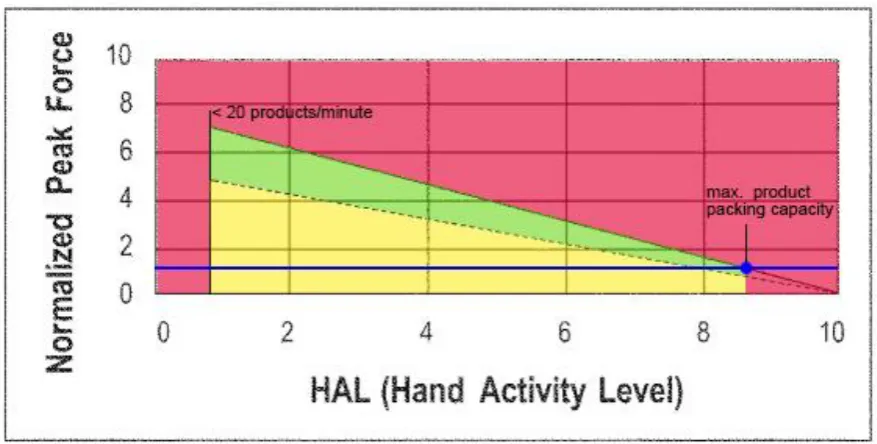
29 suggests an action limit, which gives the recommended work speed. HAL has a value from 0 to 10 that is estimated. When the value is 0, it means there is no activity, when it is 10 it means the worker can only just keep up with the tempo. The NPF is a percentage of how much of the maximum force of a worker is used. This can be measured using specialized tools, but since this differs per worker and is difficult to measure, this can also be estimated. As can be seen in figure 3.1, the general idea of this method is that for actions that require little force, the frequency can be higher than for actions that require more force. Whenever the TLV is exceeded the activity has a high chance of causing injury.
Figure 3.1) HAL/TLV Conclusion
Both the OCRA method and the HAL/TLV method give good estimates of a maximum limit to how high activity frequency should be. To be able to use the OCRA method fully, specialized knowledge is needed. This knowledge is unavailable, but the action frequency constant can be used to give an indication of average work speed. Furthermore, the upper limit of 40 actions per minute for work longer than one hour can be used. The TLV method relies heavily on estimations and therefore, will not be very accurate. However, it does give a good idea of how action frequencies change when products get heavier. The OCRA method will be used in the data gathering phase, to get a good idea of the working speed of the product packing workers. The HAL/TLV method will be used to visualize at what speeds the workers should be working to not be at risk of injury while running an efficient packaging line.
3.5 Conclusion
31
4. Data gathering
In chapter 2, a general idea about what the line looks like has been given, but to get a better understanding of how specific parts of the packaging line work, additional data is needed. The methods that were found in chapter 3 will help with this process. First, data on the bottleneck will be gathered and the bottleneck walk will be used to find the bottleneck. Then the products will be grouped, so that not every product will have to be tested individually. Afterwards, the worker speed for the product packing and the shipping box packing will be estimated. Finally, the duration of failures of the system will be estimated.
4.1 Bottleneck detection
To find what stations could be the bottleneck, the bottleneck walk, as described in section 3.2is used. In the bottleneck walk, inventories are analyzed to see if the bottleneck is upstream or downstream. This is done multiple times so that it can be detected if there is one bottleneck, or multiple bottlenecks. During the bottleneck walk, two different situations could be found. The results of these bottleneck walks can be found in figure 4.1.The top row gives the results for the first situation, the bottom row gives the results for the second situation. In the rows, circles and arrows can be found. The circles indicate how much inventory there was. The more colored circles, the more inventory. The arrows indicate in which direction the bottleneck will most probably be. The bottleneck is found where two arrows are pointing at each other. Usually the bottleneck is positioned at the station that has a big inventory which causes the next station to be starved. Another possibility is that the bottleneck is somewhere in between the two stations, for example in transportation.
Figure 4.1) The bottleneck walk
[image:32.595.80.513.425.574.2]32 machine. Since there is no transportation problem in between these stations, the product packing must be the bottleneck.
The second situation was slightly different than the first situation. It occurred when the line was running at higher speeds than 50% of the maximum speed of the box folder. These speeds could only happen for products that only had simple parts to pack into the box. The box folder was similar to the first situation. It was running at a higher capacity, but still not getting close to the maximum capacity. In this situation it really depended on the type of product if the product packers could easily keep up or not. With some products they were managing, but sometimes having trouble to keep up. For the very easy products, they could easily keep up. The gluing machine was still starved for a big part of the time. At the shipping box packing they were constantly working at these speeds and had no time to spare. Every time a mistake was made, and something took a little bit of extra time, an error would occur. Sometimes an extra worker would be used here to do the palletizing, but even in these situations the shipping box packers always had inventory and they had little room for mistakes. In the results of the bottleneck walk in this situation two bottlenecks can be seen. Firstly, the product packing bottleneck that was also observed in the first situation. Secondly, at the shipping box packing a bottleneck can be found. Especially when the workers would do the palletizing themselves, a lot of downtime was caused here.
For the first situation, the capacity of the workers can easily be measured. The speed at which the box folder can be set and the workers can just keep up is their maximum capacity. However, the capacity of the shipping box workers is not that trivial. The packing of the boxes could be done at a high pace. Sometimes the workers were even starved for boxes to pack. The problem here would be the variance. If some boxes would be slowly packed for some reason, the buffer would fill up and the line would stop. This means that it will not be possible to measure if this is a bottleneck by using the capacity of the workers. Instead, a combination of the capacity and the caused downtime should be analyzed.
4.2 Product groups
When special one-time orders are included, more than 500 different products are being processed by the packaging line. Many toys are discontinued within a year and there are around 80 new products each year, so it does not make a lot of sense to analyze each product separately. Instead, a categorization is made, based on the data that has been collected by SES. However, since the measuring system is relatively new, there are a lot of measuring errors and there is not a lot of data available. Therefore, the available data is critically evaluated for correctness by me and the operator. Firstly, the decision on what products to omit must be made. According to SES it is not worth it to evaluate products that have a sales forecast of less than 7500, since can be made in one order. Furthermore, there are products of which the parts are being fitted into a plastic frame. These products are a special case, because packaging them takes a lot of precision. Therefore, they are extremely slow products to pack. SES is working on another solution for these products, so they can be omitted in this project.
33 folder, because the rate at which the box folder can be configured is the speed at which the product packaging workers will work.
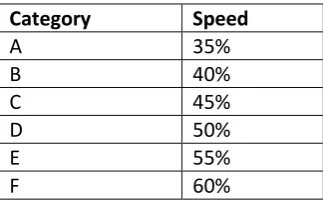
The product packaging determines at which speed the box folder can run. On products that are easy to place in the box, the box folder can run at a very high speed. If there are more difficult products to pack, the speed will be lower. Usually the operator will adjust the speed of the box folder in steps of 5%, so this will also be the interval in which the categories are made. These speed intervals will be used to group the products. The list of groups that are made can be found in table 4.1.
Table 4.1) Product groups
Category Speed
A 35%
B 40%
C 45%
D 50%
E 55%
F 60%
4.3 Product packing speed
Through observation, three different levels of complexity for the product packaging process have been found. There are products that are difficult to grab or difficult to fit into the box, difficult to grab and difficult to fit into the box and products that are easy to grab and easy to fit into the box. Parts that are difficult to grab can be those that somehow get stuck to each other such as parts with hooks or stacks of paper. Other parts that are considered difficult to grab are when an exact number of units needs to go into the box. Parts that are difficult to fit into the box are usually big or light products that barely fit or easily move out of the box through vibrations of the assembly line. These three levels of complexity will be used to estimate the speed of the product packing process.
According to the OCRA method, repetitive movements with a speed of more than 40 actions per minute for longer than an hour can result in injuries. Since the duration of the shifts is longer than an hour, the workers should never be forced to work at a faster speed than 40 products a minute. The fastest shift that was measured had a speed of 43 products per minute. The only way to reach these speeds is if multiple people will pack the same product and all the parts are simple to grab and simple to fit in the box. We won’t take this situation in account. The slowest shift that was ever measured in the packaging line had a speed of 20 products a minute. Slower than this will also result in badly folded boxes, because the box folder does not work well like this. This was a product that had a lot of complex parts. The OCRA method uses the action frequency constant as a starting point. The action frequency constant has a value of 30 actions per minute. This value fits nicely in between the other two found values. Therefore, it will be used as the speed for the middle level of complexity.
[image:34.595.217.379.221.322.2]34 result in injury, but the workers are not operating as fast as they can. The green zone is when the action limit is reached. This is where the workers should ideally operate to reach maximum efficiency.
Figure 4.2 HAL/TLV for worker speeds
4.4 Shipping box packing and palletizing speed
To find the speed of the shipping box packing and the palletizing, observations have been done. The first observation is the time it takes to fold one box, pack it and close it. This was measured from the time that the worker would first touch the box he was going to fold until he would touch the next box. The observation has been done 30 times. These observations can be found in appendix A. Afterwards, the software “Easystat” was used to fit a distribution to the data. The distribution that was found is a normal distribution with the parameters μ = 14,467 seconds and σ = 1,432 seconds.
In the second observation, the palletizing speed was observed. Again, 30 observations were done. All the observations could be rounded up to 3 seconds per box. Since all of the observations were this close, the assumption is made that palletizing can be done with a constant speed of 3 seconds per box.
4.5 Failure duration
Three different failures can occur in the system. The supply at the box folder can run out, the product packaging can cause a failure and the shipping box packing can cause a failure. The shipping box failure will automatically be solved by the system itself. When the buffer empties enough, the line will start running again, so for this failure, there does not have to be an estimation of the duration. For the other two failures, we do have to estimate how long they take. Since it is not always predictable when the system will fail, only ten measurements have been done for both types of failures. The observations can be found in appendix A.
35 not seem to be a relation between these times, so it is assumed that the failure duration is uniformly distributed between the values 66s and 191s.
When a product packing failure occurs, the workers press a button and the line will stop. Since the line does not immediately stop, the workers will have to fix the products that they could not keep up with. Then they will usually make sure that they open the boxes so that they will have a big enough supply and then they will start the line again. When the delay is small, this failure can be over quite fast. When there is a big delay, the failure takes a lot longer. Times were measured from 31 seconds to 133 seconds. With these measurements there also does not seem to be any relation between the results. It is assumed that the failure duration is uniformly distributed between the values 31s and 133s. These assumptions are quite arbitrary and with more measurements, a more accurate prediction could have been given. However, for now this assumption is realistic enough.
4.6 Conclusion
36
5. Conceptual model
In order to be a realistic representation of the packaging line, the simulation needs certain system requirements. These requirements can be grouped into three categories. These categories are abstraction, initialization and validation. For the abstraction it is important that the assumptions and simplifications about the packaging line are realistic. It is not possible to realistically model every detail of the system, so the abstraction that is decided on needs to be well thought out. In the initialization the correct settings and input values will have to be used. The settings and input values should model a realistic scenario. Correct settings will also make sure that the output values are reliable. A valid run length and number of replications will be necessary for this. To find realistic output values validation and verification is necessary to ensure that the simulation does what we want it to do and that it calculates the output data in a realistic way. Lastly, it is important that the output data that is calculated is the data that is useful for the research. This will be enough data to be able be reliable, but also not more data than necessary. How these model requirements are found can be read in this chapter.
5.1 Assumptions and simplifications
In the next section, we will talk about the assumptions and simplifications that will be done in the conceptual model. Assumptions and simplifications are necessary, because it will not be possible to make a perfect copy of reality. In this section we will discuss what the simplifications will be and why they are necessary.
Setup times are not included
Between every two orders some, setup is required. The duration of the setup can be anywhere between almost instantly to about 20 minutes. This depends on how different the previous order is from the next. With smart planning, setup times can be significantly reduced. However, since the simulation will only run single orders, the duration of the setup times is not of importance. Therefore, setup times will be omitted from the simulation.
Failures are modeled as a pause
In the packaging line, whenever a station fails, someone will have to go there to fix the problem. Usually this will be the operator, however the operator is working in different departments of the factory, so he might not be there. Usually when this happens, there is someone else available to fix the problem and to restart the line. When the operator is present, he will adjust the settings if necessary, to prevent future failure. This means that when the operator is there, slightly less failures will occur. However, since this is difficult to measure, we will not model this. Instead, in case of a failure, the machine will shut down for a period and start back up automatically.
No re-entrance