BACHELOR THESIS
Testing Cognitive Bias Modification with the
IVY Training App on Fatigue Self-Concept
in Explicit and Implicit Vitality
Author: Marie W. Wächtler
Faculty of Behavioural, Management and Social Sciences Department of Psychology
Supervisor 1: MSc Roos Wolbers Supervisor 2: Dr. Matthijs Noordzij
Abstract
Fatigue is a common problem in university students, as it is related to their high levels of stress due to high workload. Affected individuals experience enduring exhaustion which leads to a decrease in academic performance and general functionality. Increased levels of vitality, on the other side, are associated with better mental and physical well-being and more healthy behaviors. However, fear of fatigue and biased cognitions lead to avoidance behaviors of fatigue stimuli such as potentially tiring activities. These biases help maintain symptoms even after periods of study stress, which hinders increases in vitality. Those biases include
perceiving the self as fatigued in general and increasingly attending and memorizing
information that conforms with this fatigue self-concept. Cognitive Bias Modification (CBM) has already successfully changed biases in other conditions. The aim of this study was to test whether CBM with a newly developed app called IVY Training, is also able to change the fatigue self-concept and to increase vitality in students. The focus was hereby on testing its influence on implicit vitality (the unconscious self-concept) and on explicit vitality (the consciously expressible self-concept). Method: 56 university students completed the Subjective Vitality Scale (SVS) as explicit measure of vitality and a self-identity IAT as implicit measure of vitality both pre and post intervention. The intervention was a daily five-minute training with IVY for 14 consecutive days. Results and Discussion: The results showed that IVY had in general no positive influence on explicit vitality, but a small influence on the subgroups of fatigued individuals and individuals with a vitality bias at baseline level. Low correlations with adherence to app use supported the app’s positive influence on these groups. The IVY Training app had a strong influence on implicit vitality, with increases towards (more) vitality bias for all groups, in particular for the fatigue bias and fatigued groups. The non-existing relationship of implicit vitality outcomes with adherence to app use, however, cast doubts on whether increases can be attributed to IVY. Feedback showed good levels of liking and understanding, low task difficulty, and no association between general liking and understanding with adherence to app use. Only task difficulty interfered with the number of times the app was used. Based on these findings it was
concluded that, with reservations, the app could be beneficial for the target group with larger benefits for fatigued or fatigue biased students and stronger changes in implicit fatigue self-concept than in explicit fatigue self-self-concept.
Contents
1. Introduction ... 4
1.1 Fatigue in Students ... 4
1.2 Vitality ... 5
1.3 Cognitive Biases and Self-concept ... 6
1.4 Implicit and Explicit Measures ... 7
1.6 Cognitive Bias Modification ... 8
1.7 Aim of this Study ... 9
1.8 Research Questions and Hypotheses ... 9
2. Method ... 10
2.1 Participants ... 10
2.2 Materials ... 10
2.3 Design and Procedure ... 14
2.4 Data Analysis ... 16
3. Results ... 17
3.1 Descriptives ... 17
3.3 Research Question 1 ... 19
3.4 Research Question 2 ... 21
3.6 Feedback ... 22
4. Discussion ... 25
4.1 Research Question 1 ... 25
4.2 Research Question 2 ... 27
4.3 Research Question 3 ... 28
4.4 Feedback ... 29
4.5 Implications ... 29
4.6 Strengths and Limitations ... 30
4.7 Recommendations ... 30
4.8 Conclusion ... 30
References ... 31
Appendix ... 37
Appendix A: Subjective Vitality Scale ... 37
1.
Introduction
1.1 Fatigue in StudentsAs much as approximately half of all university students experience significantly high levels of stress presenting itself as symptoms of anxiety and/or depression (Regehr, Glancy, & Pitts, 2013; Cotton, Dollard, de Jonge, 2002). Reasons include high study workload and the
pressure to obtain good grades (Law, 2007; Galbraith & Merrill, 2012). An associated
problem is the high level of fatigue in university students (e.g. de Vries, van Hooff, Geurts, & Kompier, 2016; Smith, 2018; Law, 2007), which significantly increases after periods of academic stress (Dittner, Rimes, & Thorpe, 2011; Lee, Chien, & Chen, 2007; Chen, 1986). As compared to a fatigue prevalence rate of about 20% worldwide in the normal population (Young, 2004; Puetz, 2006), prevalence rates among university students are presumed to be higher due to their high levels of stress (Shankland et al., 2018; de Vries et al., 2016). In the Netherlands half of the students experience psychological problems with stress, fatigue and burnout being the most prevalent problems (LSVb, 2013). A similar result was found at a university in Taiwan (Lee, Chien, & Chen, 2007). Fatigue is thus a common problem in university students.
Fatigue in healthy individuals is a sensation to protect against physical and mental overload by inducing the desire to rest (Ryan et al., 2007). It is a subjective sensation which includes feeling tired, exhausted, weak, and lacking energy (Shen, Barbera, & Shapiro, 2006). It becomes a problem, however, when individuals keep feeling fatigued for at least one
month, which is defined as prolonged fatigue, or even for more than six months, which is defined as persistent or chronic fatigue (Fukuda et al., 1994). This enduring fatigue impairs functionality in personal and occupational life to a degree similar to other chronic medical conditions (Büttmann et al., 2002; Kroenke et al., 1988; Chen, 1986). Furthermore, other physical and psychological disorders such as anxiety and depression, are often concomitant.
In university students, this has two major consequences. Firstly, fatigue has a negative effect on cognitive performance which leads to lower learning outcomes and significantly decreased academic performance (Smith 2018; Palmer et al., 2013). Secondly, fatigue was found to be strongly associated with reduced wellbeing (Smith, 2018). It was also found that the more fatigued individuals felt, the lower they perceived their health (Flensner, Ek,
Landtblom, & Söderhamn, 2008), which in turn leads to reduced wellbeing (Ryan & Frederik, 1997). Low perceived health, however, was found to be also associated with less healthy lifestyles (Riffle, Yoho, & Sams, 1989; Killeen, 1989). As discussed, these lifestyle changes, including resting and avoidance of (physical) activity, help maintain fatigue (Lenaert et al., 2018), a condition that harms both students’ academic as well as personal lives.
Therefore, it seems evident that there is a strong need to counteract fatigue in students.
1.2 Vitality
One way of counteracting fatigue is to increase vitality. Vitality is the contrary feeling of fatigue and can be defined as positive and subjective feelings of being alive and energetic (Ryan & Frederick, 1997). It is composed of the three dimensions energy, motivation, and resilience (Strijk, Wendel-Vos, Hofstetter, & Hildebrandt, 2015). Hereby, energy refers to the feeling of being energetic; motivation refers to the active setting of goals which are pursued by investing a lot of effort; and resilience refers to the capability to handle and cope with daily problems and challenges.
More vital individuals experience usually higher levels of well-being, such as they feel more self-actualized and more self-determined, have more self-esteem, and have better mental and physical health (Ryan & Frederik, 1997). The reverse is also the case. Individuals who are less vital experience often higher levels of psychopathology such as anxiety, depression, or somatic complaints, as well as lower physical health.
1.3 Cognitive Biases and Self-concept
To find a successful way of increasing vitality, it is crucial to understand the processes and factors that underlie fatigue symptom maintenance, in more detail. Lenaert et al. (2018) distinguished four factors of how individuals learn to feel fatigued, in other words, what enforces fatigue maintenance. These factors were perceptual-cognitive biases, increased sensitivity to fatigue stimuli, the catastrophizing of feeling fatigued, and the
over-generalization of incidences of fatigue to other situations. Looking at these factors, they seem to have one thing in common, that is their cognitive component, especially in respect to biased cognitions towards fatigue severity and frequency. This impression is supported by several studies which found that negative and irrational thinking patterns are linked to catastrophizing of symptoms and higher perceived severity of fatigue (e.g. Kangas & Montgomery, 2009; Thornsteinsson & Brown, 2009). More adaptive and rational thinking patterns, in contrast, were associated with less severe fatigue.
Research that addressed the contributing factor of cognitive biases in fatigue in more depth, found that fatigued individuals form beliefs, such as that fatigue symptoms are severe, detrimental and not controllable or curable (Moss-Morris & Petrie, 2003) which are largely biased (Hughes, Hirsch, Chalder, & Moss-Morris, 2016). Based on these biases, affected individuals form negative illness schemas which they draw upon when interpreting new information, leading to an interpretation bias (Hughes et al., 2016). Less frequently found, but still present in research findings, is an attentional bias towards illness related information as a strategy to avoid further impairment. These biases were indeed found to help maintain the experienced severity of fatigue (Hughes et al., 2016).
in tobacco and alcohol use with individuals who had substance self-concepts (Lindgren, Neighbors, Gasser, Ramirez, & Cvencek, 2017). These individuals experience themselves as smokers or drinkers and consequently smoke or drink more readily, as it is in congruence with their self-concept. For fatigue, lifestyle changes such as avoidance behaviors have already been identified above (Lenaert et al., 2018; Riffle et al., 1989; Killeen, 1989). These might be maintained as they are congruent with the fatigue self-concept.
Concluding on the findings on fatigue, vitality, and cognitive biases, it is obvious that a change needs to be brought about in the cognitions of university students in order to
increase vitality to decrease the common and detrimental problem of fatigue. More precisely, biases in fatigue self-concepts need to be changed in order to increase vitality and therewith to promote more healthy and active lifestyles that will counteract further fatigue maintenance. In the following paragraphs it will be explained how these self-concepts can be measured and changed.
1.4 Implicit and Explicit Measures
Self-concepts consist of what an individual is consciously thinking about the self, but they also involve an unconscious component (Asendorpf, Banse, & Mücke, 2002). Conscious self-concepts can be assessed using explicit measures, such as self-report questionnaires. But for the unconscious components of the self-concept, implicit measures are needed.
The unconscious and conscious self-concepts that can be assessed by implicit and explicit measures, relate to the dual process models. According to these dual process models, human cognition operates with two systems (Evans, 2003; Frankish, 2010; Strack & Deutsch, 2004). One is the implicit system, an impulsive system that can operate rapidly and is largely responsible for spontaneous behaviors. The other one is the explicit system of analytical and reflective thinking that requires more time and is largely responsible for controlled behaviors (Evans, 2003; Frankish, 2010; Strack & Deutsch, 2004). Cognitive biases were, especially in early research, attributed to the first system as it is rather based on impulses, and correct responses to the second system which is rather based on logic (Evans & Curtis-Holmes, 2005; Evans, 2003; Evans, 1998). More recent research, however, also found cognitive biases in the explicit system (Evans & Stanovich, 2013; Frankish, 2010). Logical interpretations where found to sometimes be based on incomplete information that was produced by the attentional bias of the first system and led to an interpretation bias in the second system.
explicit substance self-concept, both implicit and explicit measures predicted substance use outcomes (Lindgren et al., 2017). Based on these findings, it becomes clear that the fatigue self-concept bias cannot exclusively be measured by an explicit method but also requires an implicit method, as both allow somewhat different inferences about resulting behaviors.
In both the studies of Asendorpf et al. (2002) and Lindgren et al. (2017) an Implicit Association Test (IAT) was used as the implicit measure. The IAT is a commonly used measure of implicit processes (Hofmann, Gawronski, Gschwendner, Le, & Schmitt, 2005) in which concepts are sorted into two categories for which categorization speed shows the strength of implicit association (Greenwald, McGhee, & Schwartz, 1998). In respect to self-concept it shows the degree to which participants identify themselves rather with fatigue or vitality concepts and is expressed in so called D-scores. Explicit measures like questionnaires can also assess self-concepts to some extend and have a low but significant relation with implicit measures (Hofmann et al., 2005). This shows that implicit and explicit self-concepts may be distinct but with some relation.
1.6 Cognitive Bias Modification
Self-concepts can be changed using the implicit method called Cognitive Bias Modification (CBM). CBM is a method that seeks to change cognitive biases by requesting participants to respond in ways contrary to their bias in often repetitive tasks, which leads to an implicit manifestation of these newly learned responses (Hertel & Mathews, 2011; Koster, Fox, & McLeod, 2009). Though literature has not yet assessed CBM’s effectiveness in changing fatigue self-concepts, it has already proved to successfully treat other psychological conditions that also included cognitive biases. For example, a literature review on CBM for social anxiety found promising treatment results for interventions which exposed participants to simulated social situations and trained them to interpret these as non-threatening rather than threatening - which is contrary to their interpretation bias (Mobini, Reynolds, & Mackintosh, 2012). Another study found that CBM could help to increase health behaviors and
successfully decreases an approach bias in chocolate consumption, when training individuals to avoid pictorial chocolate stimuli (Schumacher, Kemps, & Tiggemann, 2016). Also, in alcohol addicts CBM interventions proved to successfully modify approach biases (Wiers, Eberl, Rinck, Becker, & Lindenmeyer, 2011) and attention biases (Schoenmakers et al., 2010).
the explicit system, research has not yet come to a definite conclusion. The results of a study by Hertel and Mathews (2011), however, suggests that participants are most of the time not consciously aware of the changes and only implicit measures are able to reveal them.
1.7 Aim of this Study
This study aims to test the influence of the CBM training app ‘IVY’ on vitality in university students. It aims to give first indications about the effectiveness of this newly developed CBM intervention, as well as to get participant feedback on the usability of the app. The Subjective Vitality Scale (SVS) as explicit measure, and an IAT as implicit measure are used both pre and post intervention. Although this app is still in its testing phase, it is assumed that it promotes the identification with vitality rather than fatigue concepts, which is expected to counteract the negative fatigue self-concept bias and increases vitality. Therewith more healthy and active lifestyles might be promoted which counteract further maintenance of fatigue symptoms and improve students’ academic and personal lives.
1.8 Research Questions and Hypotheses
1. What is the influence of the IVY Training app on explicit vitality?
• Hypothesis 1a: The mean difference between pre- and post-test SVS measures is significant. Mean values tend towards more vitality in post-test measures.
• Hypothesis 1b: Increases in explicit vitality are positively related to adherence to app use.
2. What is the influence of the IVY Training app on implicit vitality?
• Hypothesis 2a: The mean difference between pre- and post-test D-scores is significant. Mean values tend towards more vitality bias in post-test
measures.
• Hypothesis 2b: Increases in implicit vitality are positively related to adherence to app use.
3. What is the difference between the influence of the IVY Training app on implicit vitality and on explicit vitality?
2. Method
2.1 Participants
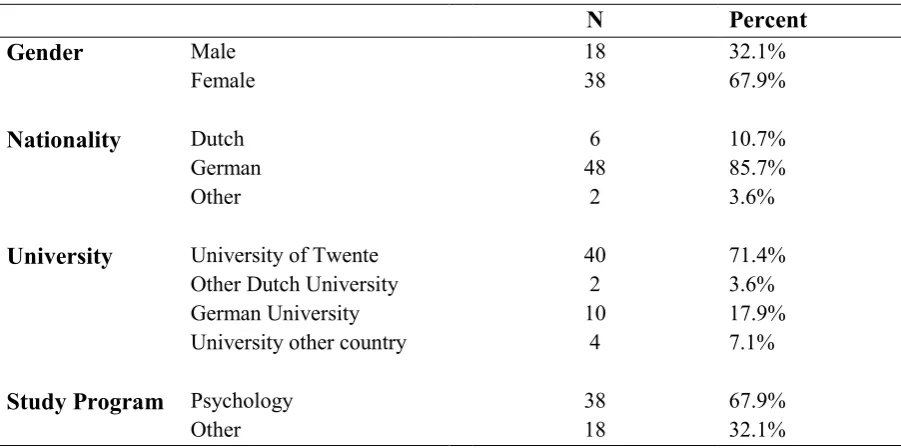
[image:10.595.73.524.419.643.2]The participants to this study consisted of 56 university students, who were selected using a purposive sampling method (Tongco, 2007). The inclusion criteria involved being a university student, being proficient in the English language, and possessing a smartphone. Out of these 56 university students who fulfilled the inclusion criteria, 67.9% were female, and 32.1% were male; They were between 18 and 31 years old, with a mean age of 21.45 (σ = 2.29). Most of the participants (n = 40) were recruited using the test subject pool system ‘Sona’ of the University of Twente. In this system university students receive credit points as a compensation for their participation, which they need for successful completion of their university degrees. Other participants from different universities, who were known to the researchers, were recruited based on their willingness to participate. The demographics can be found in Table 1.
Table 1
Demographics
N Percent
Gender Male
Female
18 38
32.1% 67.9%
Nationality Dutch
German Other
6 48
2
10.7% 85.7% 3.6%
University University of Twente 40 71.4%
Other Dutch University 2 3.6%
German University 10 17.9%
University other country 4 7.1%
Study Program Psychology 38 67.9%
Other 18 32.1%
2.2 Materials
data collected with the soSci Survey was statistically analyzed using the computer program IBM SPSS Statistics 24.
Subjective Vitality Scale. To measure explicit, subjective vitality the Subjective Vitality Scale (SVS) was used. This scale has been developed by Ryan & Frederick (1997) and encompasses seven items, such as ‘I feel alive and vital.’ or‘I look forward to each new day.’. Participants are asked to rate these items on a 7-Point Likert scale with 1 being ‘not at all true’, 4 being ‘somewhat true’, and 7 being ‘very true’. Two versions are available of this scale, the individual difference level version and the state level version. The former asks participants to rate each statement as it relates to their general life, and the latter asks participants to rate each statement as it relates to this moment in time. For this study the individual difference level version was chosen as it relates more to a rather stable perception of the self, than the state level version which might depend too largely on moods and external circumstances. Since a study by Bostic, McGartland Rubio, and Hood (2000) found that removing the second item yielded more valid results, this study also uses the reduced 6-item version omitting item 2. Vitality scores (in the following often related to as explicit vitality) are computed by adding the scores on the 7-Point Likert Scale of each item and dividing it by the sum of items, that is by 6. This scale was shown to have high levels of internal
consistency, as well as an adequate factor structure, and convergent validity (Rouse et al., 2015).
Checklist Individual Strength. This study was part of a larger study. In collaboration with Vogel (2019) the data to this study was collected. Therefore, the ‘Checklist Individual Strength’ questionnaire (CIS) was included as well, as it was relevant to the study by Vogel (2019), which focused on the influence of IVY on fatigue. The CIS is a 20 item self-report questionnaire to assess fatigue, which includes items like ‘thinking requires effort’, ‘I feel weak’, and ‘physically I feel I am in a good shape’, to be rated on a 7-Point Likert Scale ranging from ‘yes, that is true’ to ‘no, that is not true’ (Beurskens et al., 2000). The scale was validated by a study of Beurskens et al., (2000). For more details the study by Vogel (2019) can be consulted.
Self-identity IAT. To measure the participants’ implicit self-identification with vitality (implicit vitality), a self-identity IAT was used. It shows the degree to which participants identify themselves rather with fatigue or vitality concepts.
side of the screen. Details can be found in Table 2 and an example of the task is presented in Figure 1.
Table 2
Specifics IAT Blocks
Blocks Categories Examples
Left side Right side
1 = Practice block self others Mine, their, she
2 = Practice block fatigue vitality Exhausted, awake, weary
3 = Practice block self fatigue
others vitality
Strong, he, their, tired
4 = Test block self
fatigue vitality others Strong, he, their, tired
5 = Practice block others self Mine, their, she
6 = Practice block others fatigue
self vitality
Sleepy, fit, me, attentive, he
7 = Test block others
fatigue vitality self Sleepy, fit, me, attentive, he
An IAT yields D-scores, which are the quotients of the averaged difference between the IAT (test) blocks (Greenwald, Nosek, Banaji, 2003). In the following these D-score outcomes are often related to as implicit vitality. These D-scores were directly computed by soSci Survey, involving total D-scores on all blocks including practice blocks, and D-scores for test blocks only. For this study the total D-score was chosen, as it includes more data. This was expected to yield more valid results, since using the test blocks only might involve learned responses from the practice blocks rather than the actual responses based on
Figure 1. Self-Identity IAT Test Blocks
IVY Training app. For the intervention, the IVY Training app was used, which is an app freely available in the iTunes App Store and in the Android Play Store. It was developed by ‘Evolution36’ on behalf of the University of Twente. The IVY Training app uses the method of Cognitive Bias Modification (CBM) in form of a daily training. The goal of this CBM app is to strengthen the associations between the self and vitality concepts.
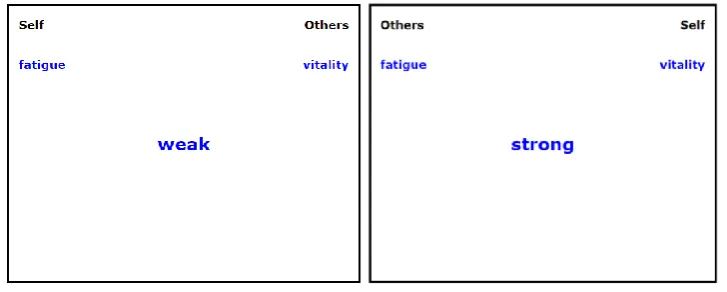
In case of the IVY Training app, participants were requested to swipe words, which appear in the middle of the screen, either up towards the category ‘Other/Self’, or down towards the category ‘Self/Vital’ (see Figure 2). This swiping gesture is supposed to simulate the movement of concepts away or towards the self. Examples for words that are to be swiped towards the self are ‘strong’, ‘vital’, ‘self’, or ‘attentive’, while words like ‘weary’, ‘other’, ‘weak’, ‘exhausted’, or ‘dull’ are to be swiped away from the self. This task had to be executed with considerable speed in order to largely respond with the implicit system which holds the (majority of) biases that are to be changed (Evans & Stanovich, 2013; Frankish, 2010). Right categorization led to a green light on the screen and the appearance of a new word, and wrong responses led to a red light on the screen and the swiping gesture had to be repeated until categorization was correct. This way, the identification of the self with words of vitality becomes implicitly manifested. This IVY training was available every day for the categorization of 100 words, which took about five minutes. The app also includes a daily reminder for participants to complete this daily training unit.
Figure 2. IVY Training app
Feedback. To gain insight into the usability of the IVY Training app, participants were asked for their feedback after completing the study. This can also help to understand the app’s ability to influence vitality. Firstly, general liking was to be rated on a 5-Point Likert Scale with 1 being ‘very good’, 2 being ‘good’, 3 being ‘barely acceptable’, 4 being ‘poor’, and 5 being ‘very poor’. Secondly, understanding of the app’s instructions was to be rated on a 5-Point Likert Scale with 1 being ‘always’, 2 being ‘very often’, 3 being ‘sometimes’, 4 being ‘rarely’, and 5 being ‘never’. Thirdly, on the same scale as understanding, task
difficulty was to be rated. Fourthly, participants were asked the three open questions ‘Which features would you most like to see added?’, ‘Which features of the app were least useful to you?’, and ‘Would you like to share any more thoughts about the app or any experiences with the app?’. In a fifth step, participants were asked to rate how often they used the app in the last two weeks on a 6-Point Likert Scale with 1 being ‘every day’, 2 being ‘almost every day’, 3 being ‘ most of the time’, 4 being ‘sometimes’, 5 being ‘almost never’, and 6 being ‘never.
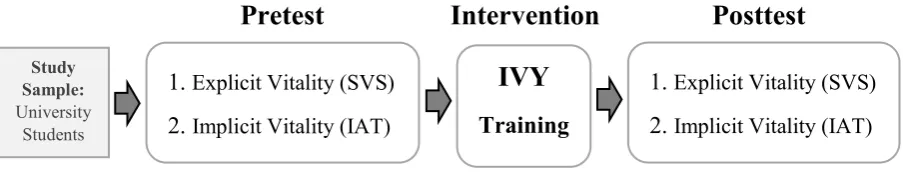
2.3 Design and Procedure
This study employed a semi-experimental pretest-posttest design, with the influence of the IVY Training app being tested on the dependent variables implicit vitality and explicit vitality for all participants by comparing pre- and posttest measures. Figure 3 shows an illustration of the study design.
Pretest
Intervention Posttest
Figure 3. Study Design and Setup
Study Sample:
University Students
1. Explicit Vitality (SVS) 2. Implicit Vitality (IAT)
IVY
Training
1. Explicit Vitality (SVS)
[image:14.595.72.524.665.752.2]After the study had been approved under the number 190341 by the Ethics Committee of the Behavioural, Management and Social sciences (BMS) of the University of Twente, students were able to either sign up to the study via the test subject pool system ‘Sona’ of the University of Twente, or were approached by the researchers. Subsequently, the participants received a link to the soSci pretest survey. After a short introduction to the study, students were presented with an informed consent form and were asked to either agree or disagree with their data use in the scope of this research, such as test results or their e-mail address to
receive a reminder for the follow-up questionnaire. Students who agreed preceded to first filling in questions regarding their demographics. These questions were asking for age, whether they were currently a university student, language fluency, gender, nationality, their university, the study program they were currently enrolled in, their study year, their Personal Code by which the researchers were able to identify participants in both the survey and the app (consisting of the first letters of their first and last names and the last two digits of their year of birth), and their e-mail address (for sending a reminder to the posttest). Then, participants went on to fill in first the Checklist Individual Strength questionnaire (CIS) and then the Subjective Vitality Scale (SVS). Subsequently they received a short introduction to the self-identity IAT and immediately continued with the seven blocks of the IAT. After approximately 20-25 minutes, the students were done with the whole pretest survey and were asked to download the IVY Training app to complete the daily training units for 14
consecutive days.
One day before completion of the 14th day, the students received a reminder for the post measurement via e-mail, which included the link to the soSci posttest survey. The
posttest survey was similarly structured as the pretest survey. Participants first received a brief introduction and then had to fill in their Personal Code again, to enable the researchers to link pre- and posttest cases. Subsequently, participants had to fill in the Checklist Individual Strength questionnaire (CIS) and then the Subjective Vitality Scale (SVS) again. After a short introduction, participants then immediately started with the seven blocks of the self-identity IAT. Next, after a short explanation, participants were asked to give feedback on the IVY Training app and their experiences. The first question asked for their general liking, the second for their understanding of the tasks, the third for task difficulty, and the fourth for how often they used the app. Subsequently, they had the opportunity to also give individual
2.4 Data Analysis
The data obtained in this study was analyzed using the computer program IBM SPSS Statistics. In a first step, the data was analyzed for descriptive statistics to gain an overview of the data. Subsequently, the data file was split into groups of high and low vitality scores in explicit and implicit measures at baseline level. For implicit vitality, the data file was split into the groups ‘vitality bias’ (D-scores below 0 at baseline level), and ‘fatigue bias’ (D -scores above 0 at baseline level). For explicit vitality, the data file was split into the groups ‘fatigued group’ (cases below population average of the SVS averaged total scores at baseline level) and the ‘vital group’ (cases above population average of the SVS averaged total scores at baseline level). The descriptive statistics analysis was repeated for each of the four groups separately. Means and standard deviations were also computed for the feedback ratings ‘general liking’, ‘understanding’, ‘task difficulty’, and ‘adherence’ to app use.
In a second step, the mean difference between pre- and posttest SVS averaged total scores was computed, to test the influence of the IVY Training app on explicit vitality. A Shapiro Wilk test was run to test for normality and subsequently the Wilkoxon signed-rank test was executed to compute the mean difference and its significance. Effect sizes were calculated by subtracting the means and dividing the outcome by the pooled standard deviation, not only for this analysis of mean difference, but also for the following analyses. To find out whether adherence to app use can be related to post intervention increases in explicit vitality, the relationship between the difference scores of explicit vitality and adherence to app use was assessed using the Spearman’s rank-order correlation.
In a third step, the mean difference between pre- and posttest D-scores was computed, to assess the influence of the IVY Training app on implicit vitality. A Shapiro Wilk test was run to test for normality and subsequently the paired-samples t-test was run to test for the mean differences. Subsequently, the relationship between adherence to app use and post intervention increases in implicit vitality was investigated, using the Spearman’s rank-order correlation.
Both step two and three were also run for each of the vitality/fatigue bias groups and the vital/fatigued groups separately. These analyses were to provide insight into the influence of the intervention on explicit and implicit vitality with regards to individuals who were either showing fatigue or vitality at baseline level as expressed explicitly or as assessed with implicit measures.
In a fourth step, frequencies of participant ratings of their general liking,
an overview of the feedback data. Furthermore, their individual feedback was sorted into overarching subjects, to gain more insight into the usability of the app which holds
implications for the evaluation of the app’s influence on vitality. Subsequently, a cumulative odds ordinal logistic regression was performed to assess whether participants’ ratings of general liking, understanding, and task difficulty of the app were associated with the variation in adherence to app use. This analysis was to provide insight into adherence in order to being able to draw further inferences about adherence’s importance for intervention success.
3. Results
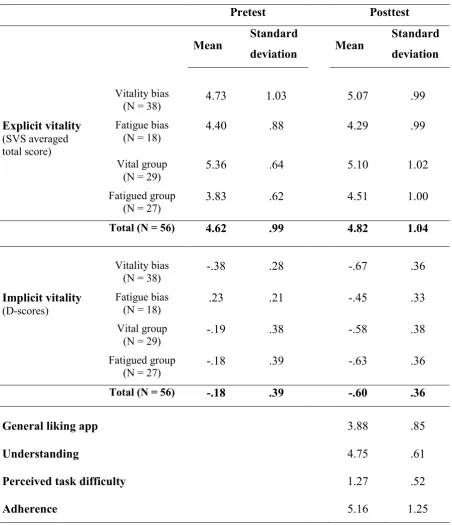
3.1 Descriptives
Table 3
Descriptives
Pretest Posttest
Mean Standard
deviation Mean
Standard deviation
Vitality bias
(N = 38) 4.73 1.03 5.07 .99
Explicit vitality (SVS averaged total score)
Fatigue bias
(N = 18) 4.40 .88 4.29 .99
Vital group
(N = 29) 5.36 .64 5.10 1.02
Fatigued group
(N = 27) 3.83 .62 4.51 1.00
Total (N = 56) 4.62 .99 4.82 1.04
Vitality bias
(N = 38) -.38 .28 -.67 .36
Implicit vitality (D-scores)
Fatigue bias
(N = 18) .23 .21 -.45 .33
Vital group
(N = 29) -.19 .38 -.58 .38
Fatigued group
(N = 27) -.18 .39 -.63 .36
Total (N = 56) -.18 .39 -.60 .36
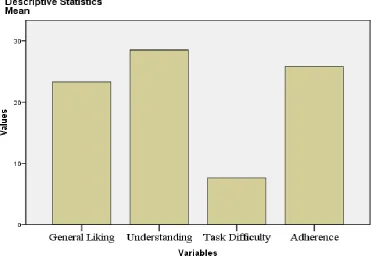
General liking app 3.88 .85
Understanding 4.75 .61
Perceived task difficulty 1.27 .52
Figure 4. Ratings of the IVY training app and app use, with a maximum score of 30 representing ‘very good’/’always’/’every day'
3.3 Research Question 1
To answer the first research question “What is the influence of the IVY Training app on explicit vitality?” the mean difference between pre- and posttest SVS averaged total scores was computed. It was hypothesized that the mean difference between both measurements is significant with mean values tending towards more vitality on posttest. Four outliers were detected that were more than 1.5 box-lengths from the edge of the box in a boxplot. Inspection of their values did not reveal them to be extreme and they were kept in the analysis. Since the difference scores of the SVS total scores between pre- and posttest were found not to be normally distributed, as assessed by Shapiro Wilk’s test (p = .045), it was chosen to use the Wilkoxon signed-rank test as a non-parametric alternative. Out of the 56 participants, an increase in vitality was observed in 30 participants, whereas a decrease was observed in 17 participants. In 7 participants there were no improvements observed in vitality. The Wilkoxon signed-rank test determined that the improvements in explicit vitality from pre- to posttest were statistically not significant (Mdn = .1650), z = -1.689, p = .091. Therefore, hypothesis 1a was rejected for the whole sample.
The difference scores between pre- and posttest were found not to be normally distributed for the vitality bias group (W(38) = .940, p = .041), but normally distributed for the fatigue bias group (W(18) = .956, p = .527). Both the paired-samples t-test and the Wilkoxon signed-rank test as the nonparametric alternative, however, came to the same conclusion. The paired-samples t-test showed that the increase in vitality was statistically significant for the vitality bias group, μ = .34, 95% CI [-.005, .679], t(37) = 1.996, p = .05 with a small effect size (𝑑𝐶𝑜ℎ𝑒𝑛 = .337) (Cohen, 1992). For the fatigue bias group, the paired-samples t-test showed that the decrease in vitality was not significant, μ = -.11, 95% CI [-.590, .370], t(17) = -.484, p
= .635. The Wilkoxon signed-rank test also showed a significant increase in explicit vitality for the vitality bias group (z = -2.138, p = .033), and no significant difference for the fatigue bias group (z = -.259, p = .795). Therefore, hypothesis 1a was accepted for the vitality bias group but rejected for the fatigue bias group.
When splitting the file into the two groups of below and above population average scores on the SVS averaged total score at baseline level – in the following called fatigued and vital groups – the outcomes were again different. The Wilkoxon signed-rank test showed a significant increase in explicit vitality for the fatigued group (z = -2.237, p = .025) with a large effect size (𝑑𝐶𝑜ℎ𝑒𝑛 = .817), but not for the vital group (z = -.582, p = .561). Therefore, hypothesis 1a was accepted for the fatigued group but rejected for the vital group.
Adherence’s relationship with the intervention outcome. To find out whether there is a relationship between the low difference scores of explicit vitality and (non-) adherence to app use, a Spearman’s rank-order correlation was run, first for the whole sample, then split into vitality and fatigue groups. It was hypothesized that increases in explicit vitality are positively related to app use. A preliminary analysis showed the relationship for the whole sample to be monotonic, as assessed by visual inspection of a scatterplot. The correlation between difference scores of explicit vitality (SVS) and adherence to app use was found to be statistically significant, rs(54) = .294, p < .05. This is a low positive correlation (Mukaka, 2012), indicating that low scores in adherence to app use are related to low difference scores. Therefore, hypothesis 1b was accepted for the whole sample.
When split into vitality bias and fatigue bias groups, the correlation proved to be significant for the vitality bias group, rs(36) = .420, p = .009, and not significant for the fatigue bias group, rs(16) = .043, p = .865. Therefore, hypothesis 1b was accepted for the vitality bias group but rejected for the fatigue bias group.
p = .743. Therefore, hypothesis 1b was accepted for the fatigued group but rejected for the vital group.
Relationship between vitality/fatigue bias and vital/fatigued groups. Due to these contrary results, a chi-square test for association was run, to assess whether there is a reverse relationship between the two grouping variables vitality/fatigue bias and fatigued/vital groups. The association between both groupings was not significant, χ2(1) = .034, p = .854. This indicates that although the reverse outcomes suggested a reverse relationship, both groupings were actually not related with each other.
3.4 Research Question 2
To answer the second research question “What is the influence of the IVY Training app on implicit vitality?”, the mean difference between pre- and posttest D-scores was computed. It was hypothesized that the mean difference between both measurements is significant with mean values tending towards (more) vitality bias on posttest. Three outliers were detected that were more than 1.5 box-lengths from the edge of the box in a boxplot. Inspection of their values did not reveal them to be extreme and they were kept in the analysis. The difference scores between pre- and posttest measurements of implicit vitality – that is between D-scores –were normally distributed, as assessed by a Shipiro Wilk’s test (p = .768). Therefore, the paired-samples t-test was selected as suitable. The analysis showed that the increase in vitality bias was statistically significant, μ = -.42, 95% CI [-.522, -.312], t(55) = -7.969, p < .001, which is a large effect size (𝑑𝐶𝑜ℎ𝑒𝑛 = -1.111) (Cohen, 1992).
Split for vitality and fatigue groups. Again, the analysis was repeated for the vitality bias group and the fatigue bias group separately. The difference scores between pre- and posttest D-values were normally distributed for both the vitality bias group (W(38) = .967, p = .327), and the fatigue bias group (W(18) = .971, p = .810). The analysis with the paired-samples t-test showed that the increase in vitality bias was significant for both the vitality bias group, μ = -.30, 95% CI [-.411, -.182], t(37) = -5.228, p < .001, with a large effect size
(𝑑𝐶𝑜ℎ𝑒𝑛 = -.921), and the fatigue bias group, μ = -.67, 95% CI [-.849, -.492], t(17) = -7.921, p
< .001, with a very large effect size (𝑑𝐶𝑜ℎ𝑒𝑛 = -2.444), with a larger mean difference for the fatigue bias group (MD = .68) than for the vitality bias group (MD = .29).
When split into fatigued and vital groups, the difference scores were again normally distributed for the fatigued group (W(27) = .188, p = .177), as well as for the vital group (W(29) = .128, p = .904). The analysis with the paired-samples t-test showed that the increase in vitality bias was significant for both the fatigued group, μ = -.44, 95% CI [-.615, -.275],
-.39, 95% CI [-.527, -.254], t(28) = -5.872, p < .001 with a large effect size (𝑑𝐶𝑜ℎ𝑒𝑛 = -1.034), with a larger mean difference for the fatigued group (MD = .44) than for the vital group (MD = .39).
On the basis of the results of both the whole sample and the split groups, hypothesis 2a was accepted.
Adherence’s relationship with the intervention outcome. To gain more evidence that the significant difference scores can be related to the intervention, it was tested whether there is a relationship between the difference scores of implicit vitality and adherence, first for the whole sample and then again split into vitality and fatigue groups. For that purpose, a Spearman’s rank-order correlation was run. It was hypothesized that the relationship between adherence and the difference scores of implicit vitality is significant. A preliminary analysis showed the relationship in the whole sample to be monotonic, as assessed by visual inspection of a scatterplot. The correlation between difference scores of implicit vitality (D-scores) and adherence to app use was found to be negative and not statistically significant for the whole sample, rs(54) = -.046, p > .05.
This outcome remained the same when running the analysis for vitality and fatigue bias separately, with no significant relation between difference scores and adherence in the vitality bias group, rs(36) = -.049, p = .769, and in the fatigue bias group, rs(16) = -.081, p = .750. The same holds for the splitting into fatigued and vital groups. There was no significant relation found between difference scores of implicit vitality and adherence to app use in the fatigued group, rs(25) = -.097, p = .632, as well as in the vital group rs(27) = -.122, p = .527.
On the basis of the results of both the whole sample and the split groups, hypothesis 2b was rejected.
3.6 Feedback
The participants were asked to rate the app with closed questions, as well as to give feedback on their experiences with open questions. This feedback gives information on usability and is also essential for interpreting the outcome of the intervention.
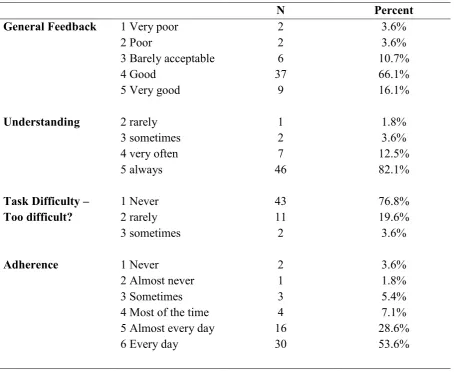
Table 4
Participants’ Ratings of the IVY App
N Percent
General Feedback 1 Very poor 2 Poor
3 Barely acceptable 4 Good
5 Very good
2 2 6 37 9 3.6% 3.6% 10.7% 66.1% 16.1%
Understanding 2 rarely
3 sometimes 4 very often 5 always 1 2 7 46 1.8% 3.6% 12.5% 82.1%
Task Difficulty –
Too difficult? 1 Never 2 rarely 3 sometimes 43 11 2 76.8% 19.6% 3.6%
Adherence 1 Never
2 Almost never 3 Sometimes 4 Most of the time 5 Almost every day 6 Every day
2 1 3 4 16 30 3.6% 1.8% 5.4% 7.1% 28.6% 53.6%
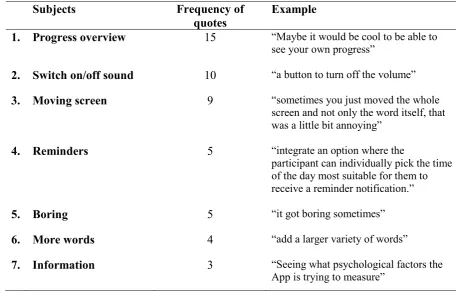
When the participants were asked to give feedback on the IVY Training app in three open questions, 7 distinctive subjects emerged (see Table 5). Other less distinctively related participant experiences were grouped into the categories complaints about ‘malfunctions’ of the app (not related to one of the 7 subjects), ‘ideas for improvements’, ‘positive feedback’, and ‘other experiences’ the participants wanted to share. Details about these less distinctively related experiences can be found in Appendix B Table 1.
The first out of the 7 distinctive subjects included the wish to have a progress
request for more words in the app. Finally, the seventh subject was about the request for more information and instruction in the app (see Table 5). More details can be found in Appendix B Table 1.
Table 5
Participants’ Feedback Categorized into 7 Distinctive Subjects
Subjects Frequency of
quotes
Example
1. Progress overview 15 “Maybe it would be cool to be able to
see your own progress”
2. Switch on/off sound 10 “a button to turn off the volume”
3. Moving screen 9 “sometimes you just moved the whole
screen and not only the word itself, that
was a little bit annoying”
4. Reminders 5 “integrate an option where the
participant can individually pick the time of the day most suitable for them to
receive a reminder notification.”
5. Boring 5 “it got boring sometimes”
6. More words 4 “add a larger variety of words”
7. Information 3 “Seeing what psychological factors the
App is trying to measure”
4. Discussion
This study aimed to test the influence of the ‘IVY Training’ app on vitality in university students, to give first indications about the effectiveness of this newly developed CBM intervention. By manifesting the identification with vitality rather than fatigue concepts, IVY intended to counteract the negative fatigue self-concept bias and to increase vitality. This was expected to promote more healthy and active lifestyles and to counteract fatigue maintenance. This study also aimed to generate insight into the usability of the app by means of participant feedback.
The results have shown that IVY had in the overall no positive influence on explicit vitality, but a strong influence on fatigued and a weak influence on vitality biased subgroups. Low correlations with adherence supported the app’s influence on these groups. IVY showed a strong influence on implicit vitality, with increases towards (more) vitality bias for all groups, in particular for the fatigue bias and fatigued groups. The non-existing relation of these outcomes with adherence to app use, however, cast doubts on whether increases can be attributed to IVY. Feedback showed good levels of liking and understanding, and low task difficulty. In the following, these results will be discussed in more detail and separately for the three research questions.
4.1 Research Question 1
The first research question was “What is the influence of the IVY Training app on explicit vitality?”. The pretest of explicit vitality showed that the students perceived themselves on average as slightly above medium vitality, meaning that about half of the students had low vitality values. This is in line with the findings that about half of university students are fatigued (low vitality) (Law, 2007; Lee et al., 2007). The analysis showed that the small increase from pre- to posttest was not significant, showing that IVY did not influence explicit fatigue. This is in line with the finding that the effect of CBM is likely not to be explicitly noticed (Hertel & Mathews, 2011).
Split for vitality and fatigue groups. Results differed when splitting the sample into the groups of below and above sample average in explicit vitality at baseline level
size. These increases in explicit vitality contradict the finding that changes due to CBM are not consciously perceived (Hertel & Mathews, 2011).
It becomes clear that firstly, the unconscious experience of vitality before the intervention, seemed to have an influence on consciously perceived vitality after the
intervention. This indicates an effect of the implicit system on the explicit one, as also found by Evans and Stanovich (2013), and Frankish (2010). However, this effect did not appear for fatigue biased students. An explanation could be that they underwent a greater change towards vitality bias than formerly vitality biased students and that these greater changes do not (yet) reach consciousness. Alternatively, students unconsciously perceiving themselves as vital, might be generally more ready to experience increases in conscious vitality. Since literature has not yet addressed this topic, these explanations should be tested by future research.
Secondly, it becomes clear that vital/fatigued groups and vitality/fatigue bias groups are distinct. The analysis indeed showed no relation between them, showing that students who consciously felt vital, did not necessarily also unconsciously associate themselves with
vitality and vice versa. This is in line with Hofmann et al. (2005) who found that the
conscious and unconscious experiences do not always match. On the other hand, it could have been expected to find explicitly fatigued students to also hold implicit fatigue self-concepts, as they are largely responsible for maintenance of perceived fatigue (Lenaert et al., 2018; Hughes et al., 2016). However, this might be only found in a sample of fatigued students and not in the normal population.
Adherence’s relationship with the intervention outcome. The results also showed a low positive correlation between improvements in explicit vitality and adherence to app use. This shows that the outcome somehow depended on frequency of app use, but also that to some extent it did not differ how often IVY was used. This is expectable, considering that IVY only influenced subgroups, not the whole sample. According to Hertel and Mathews (2011) the amount of time needed to modify a cognitive bias probably depends on the strength of biased cognitions. This suggests that cognitive biases might probably not have been so strong in this sample or varied, which might be why improvements were not so clearly connected to adherence. When splitting into the subgroups, the analysis showed that only the significant improvements in fatigued and vitality biased groups were associated with
outcomes. However, this would have to be tested by future research including a control group in the design.
Answer to the research question. Based on these findings, the first research question “What is the influence of the IVY Training app on explicit vitality?” can be answered. It was hypothesized that mean differences between pre- and posttest SVS measures would be significant with mean values tending towards more vitality on the posttest. This seemed indeed to be true for students explicitly perceiving themselves as fatigued and holding implicit vitality biases at baseline level. However, it seemed not to be true for students explicitly perceiving themselves as vital and holding implicit fatigue biases at baseline level. It was also hypothesized that increases in vitality would be positively related to adherence. This was found to be true only for groups showing increases on the posttest. Therefore, it can be concluded that IVY seemed to have a significant influence on consciously fatigued and unconsciously vitality biased students.
4.2 Research Question 2
The second research question was “What is the influence of the IVY Training app on implicit vitality?”. The pretest showed on average a slight vitality bias in students, which significantly increased towards the posttest. It indicates that IVY positively influenced implicit vitality. This is in line with findings of CBM effectiveness on other conditions, such as social anxiety (Mobini et al., 2012), unhealthy eating behaviors (Schumacher et al., 2016), or alcohol addiction (Wiers et al., 2011).
Split for vitality and fatigue groups. Results for the subgroups remained similar. Improvements were significant in each group, with effect sizes being large for vitality biased students but considerably larger for fatigue biased students. Since vitality biased students were double as many as fatigue biased students, this shows that the relatively small number of fatigue biased students experienced extreme improvements. It is not clear though, whether with a larger sample of fatigued students the same extreme improvements would be reached. Explicitly fatigued students also had slightly larger effect sizes than vital students. This suggests, that all groups clearly benefitted from IVY, but that implicitly and explicitly fatigued students benefited from it in particular. These are first indications for the particular effectiveness of the app on fatigued individuals.
powerful and a few sessions already brought about the change. The findings of Hertel & Mathews (2011) that the time needed to change a cognitive bias probably depends on bias severity, supports this assumption since fatigue self-concepts were not so severe in this normal population sample. Another explanation is that IVY was not responsible for the improvements in implicit vitality. Rather, a training effect might have occurred after a few sessions, since the tasks in the IAT and IVY Training were similar, and both used the same words. If students did not always honestly answer the question about their adherence, this would also explain the missing link between adherence and implicit vitality improvements. These explanations remain unanswered questions that need to be addressed by future research.
Answer to the research question. Based on these findings, the second research question “What is the influence of the IVY Training app on implicit vitality?” can be answered. It was hypothesized that mean differences between pre- and posttest D-scores would be significant with mean values tending towards less bias in post-test measures. This seems to be true for the whole sample and each subgroup, particularly for the fatigue bias and fatigued groups. However, some concerns remain whether these improvements can be
attributed to IVY. Therefore, with reservations, it can be concluded that the IVY Training app seems to increase vitality bias in students, especially in fatigued and fatigue biased students.
4.3 Research Question 3
On the basis of the results on research questions 1 and 2, a conclusion can also be drawn on the third research question “What is the difference between the influence of the IVY Training app on implicit and on explicit vitality?”. The non-existing relation with adherence for implicit vitality allows only an answer with reservations. It was hypothesized that the influence of the IVY Training app would be stronger on implicit than on explicit vitality with the direction of influence being towards more vitality. This seems to be true, since
4.4 Feedback
Students’ ratings and experiences with IVY give more input for interpreting its influence on vitality. Overall, students experienced IVY to be good. This shows that the points of criticism mentioned, such as malfunctions or missing functions or elements, were still acceptable to them and did not essentially downgrade their experience with IVY.
Students reported to almost always have understood instructions and that they perceived task difficulty as low. Furthermore, students claimed having used IVY almost every day on average. This shows again, that the experience with IVY seemed to be good, as students were motivated to use it frequently. Liking and understanding were found not to be related to app use, but increased task difficulty lowered the probability of adherence. This shows that the criticisms of IVY did not influence frequency of app use, supporting the app’s ability to influence vitality. Still, improvements of IVY should be considered, especially concerning simplifications of tasks and explanations.
4.5 Implications
Since the results of this study need to be apprehended with caution, the same holds for their implications. Firstly, the results hold implications for students’ further health behaviors such as more (physical) activity. Since explicit self-concepts can be related to controlled health behaviors (Asendorpf et al., 2002), the increases in explicit vitality suggest increases in controlled health behaviors. This might include taking more often the decision to engage in active behaviors such as physical activities instead of engaging in resting and activity
avoidance behaviors. Similarly, the strong increases in implicit vitality would lead to strongly improved spontaneous health behaviors (Asendorpf et al., 2002). This might include, for example, spontaneously rather taking the stairs than the elevator or without consideration saying yes when being asked to join an activity. This would be opposite to the common behaviors of resting and avoiding activity in the fatigued (Lenaert et al., 2018). As a result, this might mean that IVY may also help to counteract the maintenance of fatigue symptoms by increasing the occurrence of healthy and active behaviors.
Furthermore, that fatigued and fatigue biased students benefited most from IVY implies that it might be very and particularly suitable for the target group of fatigued university students.
4.6 Strengths and Limitations
Strengths of this study include the approach of using explicit and implicit subgroup differentiation to understanding the intervention’s influence on implicit and explicit vitality.
The biggest limitation to this study is the missing control group, as effects cannot be attributed to the intervention with certainty, and moderating relations of adherence cannot be established. Further, both the self-identity IAT and IVY were not validated by research before, restraining the results’ meaningfulness. Also, their task similarity and use of the same words might have led to a training effect rather than an intervention effect. Another limitation is that a delay between end of intervention and completion of the posttest occurred for some students, distorting immediate intervention effects. Finally, more meaningful results on IVY’s influence on the target group might have been gained from a sample of fatigued students.
4.7 Recommendations
It is recommended for future research to replicate this study while including a control group. Further, the questions that came up with this study or remained unanswered should be answered with future research. This includes whether less grave improvements in implicit vitality can be experienced in explicit vitality as opposed to more grave improvements; whether individuals who hold vitality biases are more ready to experience increases in consciously perceived vitality; or whether IVY really has an influence on resulting health behaviors. Finally, it should be assessed why improvements in implicit vitality are not related to adherence, and how many training sessions with IVY are necessary to modify fatigue self-concepts of different severities. Gaining more insight on these remaining questions, will help to improve the beneficial influence of IVY for the target group and future health behaviors.
4.8 Conclusion
References
Asendorpf, J. B., Banse, R., & Mücke, D. (2002). Double Dissociation Between Implicit and Explicit Personality Self-Concept: The Case of Shy Behavior. Journal of Personality and Social Psychology,83(2), 380-393. doi:10.1037//0022-3514.83.2.380
Beurskens, A. J. H. M., Bültmann, U., Kant, I., Vercoulen, J. H. M. M., Bleijenberg, G., & Swaen, G. M. H. (2000). Fatigue among working people: Validity of a questionnaire measure. Occupational & Environmental Medicine,57(5), 353-357.
http://dx.doi.org/10.1136/oem.57.5.353
Bostic, T. J., McGartland Rubio, D., & Hood, M. (2000). A Validation of the Subjective Vitality Scale Using Structural Equation Modeling. Social Indicators Research,52(3), 313-324. https://doi.org/10.1023/A:1007136110218
Briones, B., Adams, N., Strauss, M., Rosenberg, C., Whalen, C., Carskadon, M., Roebuck, T., Winters, M., & Redline, S. (1996). Relationship Between Sleepiness and General Health Status. Sleep,19(7), 583-588. https://doi.org/10.1093/sleep/19.7.583
Büttmann, U., Kant, I., Kasl, S. V., Beurskens, A. J. H. M., & Van den Brandt, P. A. (2002). Fatigue and psychological distress in the working population: Psychometrics,
prevalence, and correlates. Journal of Psychosomatic Research,52(6), 445-452. https://doi.org/10.1016/S0022-3999(01)00228-8
Chen, M. K. (1986). The epidemiology of self-perceived fatigue among adults. Perspective Medicine,15(1), 74-81. https://doi.org/10.1016/0091-7435(86)90037-X
Cohen, J. (1992). A Power Primer. Psychological Bulletin,122(1), 155-159. Retrieved May 27, 2018, from http://www2.psych.ubc.ca/~schaller/528Readings/Cohen1992.pdf
Cotton, S. J., Dollard, M. F., & De Jonge, J. (2002). Stress and Student Job Design: Satisfaction, Well-Being, and Performance in University Students. International Journal of Stress Management,9(3), 147-162.
https://doi.org/10.1023/A:101551571
Cunningham, S. J., & Turk, D. J. (2017). Editorial: A review of self-processing biases in cognition. The Quarterly Journal of Experimental Psychology,70(6), 987-995. https://doi.org/10.1080/17470218.2016.1276609
Davis, H., & Unruh, W. R. (1981). The Development of the Self-Schema in Adult Depression. Journal of Abnormal Psychology,90(2), 125-133.
de Vries, J. D., Van Hooff, M. L. M., Geurts, S. A. E., & Kompier, M. A. J. (2016). Exercise as an Intervention to Reduce Study-Related Fatigue among University Students: A Two-Arm Parallel Randomized Controlled Trial. PLoS ONE,11(3), 1-21.
https://doi.org/10.1371/journal.pone.0152137
Dittner, A. J., Rimes, K., & Thorpe, S. (2011). Negative perfectionism increases the risk of fatigue following a period of stress. Psychology & Health,26(3), 253-268.
https://doi.org/10.1080/08870440903225892
Evans, J. St. B. T. (1998). Matching Bias in Conditional Reasoning: Do We Understand it After 25 Years? Thinking & Reasoning,4(1), 45-110.
https://doi.org/10.1080/135467898394247
Evans, J. St. B. T. (2003). In two minds: Dual-process accounts of reasoning. TRENDS in Cognitive Sciences,7(10), 454-459. doi:10.1016/j.tics.2003.08.012
Evans, J. St. B. T. & Curtis-Holmes, J. (2005). Rapid responding increases belief bias: Evidence for the dual-process theory of reasoning. Thinking & Reasoning,11(4), 382-389. doi:10.1080/13546780542000005
Evans, J. St. B. T. & Stanovich, K. E. (2013). Dual-Process Theories of Higher Cognition: Advancing the Debate. Perspectives on Psychological Science,8, 223-241.
doi:10.1177/1745691612460685
Flensner, G., Ek, A., Landtblom, A., & Söderhamn, O. (2008). Fatigue in relation to
perceived health: People with multiple sclerosis compared with people in the general population. Scandinavian Journal of Caring Sciences,22(3), 391-400. https://doi-org.ezproxy2.utwente.nl/10.1111/j.1471-6712.2007.00542.x
Frankish, K. (2010). Dual-Process and Dual-System Theories of Reasoning. Philosophy Compass,5(10), 914-926. doi:10.1111/j.1747-9991.2010.00330.x
Fukuda, K., Strauss, S. E., Hickie, I., Sharpe, M. C., Dobbins, J. G., & Komaroff, A. (1995). The Chronic Fatigue Syndrome. Journal of Chronic Fatigue Syndrome,1(2), 953-959. https://doi.org/10.1300/J092v01n02_06
Galbraith, C. S., & Merrill, G. B. (2015). Academic performance and burnout: An efficient frontier analysis of resource use efficiency among employed university
students. Journal of Further and Higher Education,39(2), 255-277. https://doi-org.ezproxy2.utwente.nl/10.1080/0309877X.2013.858673
Greenwald, A. G., McGhee, D. E., & Schwartz, J. L. (1998). Measuring Individual Differences in Implicit Cognition: The Implicit Association Test. Journal of
Greenwald, A.G., Nosek, B.A., Banaji, M.R. (2003). Understanding and Using the Implicit Association Test: I. An Improved Scoring Algorithm. Journal of Personality and Social Psychology, (85), 2, 197-216. doi:10.1037/0022-3514.85.2.197
Hertel, P. T., & Mathews, A. (2011). Cognitive Bias Modification: Past Perspectives, Current Findings, and Future Applications. Perspectives on Psychological Science,6(6), 521-536. https://doi.org/10.1177/1745691611421205
Hofmann, W., Gawronski, B., & Gschwendner, T. (2005). A Meta-Analysis on the Correlation Between the Implicit Association Test and Explicit Self-Report Measures. Personality and Social Psychology Bulletin,31(10), 1369-1385. https://doi.org/10.1177/0146167205275613
Hughes, A., Hirsch, C., Chalder, T., & Moss-Morris, R. (2016). Attentional and interpretive bias towards illnessrelated information in chronic fatigue syndrome: A systematic review. British Journal of Health Psychology,21(4), 741-763.
https://doi.org/10.1111/bjhp.12207
Kangas, M., & Montgomery, G. H. (2011). The role of cognitive, emotional and personality factors in the experience of fatigue in a university and community sample. Psychology & Health,26(1), 1-19. https://doi.org/10.1080/08870440903521779
Killeen, M. (1989). Health promotion practices of family caregivers. Health Values,13(4), 3-10. Retrieved June 2, 2019, from https://europepmc.org/abstract/med/10318322.
Koster, E. H., Fox, E., & McLeod, C. (2009). Introduction to the Special Section on Cognitive Bias Modification in Emotional Disorders. Journal of Abnormal Psychology,118(1), 1-4. doi:10.1037/a0014379
Kroenke, K., Wood, D. R., Mangelsdorff, A. D., Meyer, N. J., & Powell, J. B. (1988). Chronic Fatigue in Primary Care Prevalence, Patient Characteristics, and Outcome. JAMA,260(7), 929-934. doi:10.1001/jama.1988.03410070057028 Law, D. W. (2007). Exhaustion in University Students and the Effect of Coursework
Involvement. Journal of American College Health,55(4), 239-245. https://doi.org/10.3200/JACH.55.4.239-245
Lee, Y., Chien, K., & Chen, H. (2007). Exercise as an Intervention to Reduce Study-Related Fatigue among University Students: A Two-Arm Parallel Randomized Controlled Trial. Journal of the Formosan Medical Association,106(7), 565-572.
Lenaert, B., Boddez, Y., Vlaeyen, J. W., & Van Heugten, C. M. (2018). Learning to feel tired: A learning trajectory towards chronic fatigue. Behaviour Research and Therapy,100, 54-66. https://doi.org/10.1016/j.brat.2017.11.004
Lindgren, K. P., Neighbors, C., Gasser, M. L., Ramirez, J. J., & Cvencek, D. (2017). A review of implicit and explicit substance self-concept as a predictor of alcohol and tobacco use and misuse. The American Journal of Drug and Alcohol Abuse,43(3), 237-246. https://doi.org/10.1080/00952990.2016.1229324
LSVb. (2013). Psychische klachten bij helft studenten. Retrieved June 2, 2019, from https://lsvb.nl/2013/03/29/psychische-klachten-bij-helft-studenten/
Mobini, S., Reynolds, S., & Mackintosh, B. (2012). Clinical Implications of Cognitive Bias Modification for Interpretative Biases in Social Anxiety: An Integrative Literature Review. Springer Science Business Media,37, 173-182. doi:10.1007/s10608-012-9445-8
Morea, J. M., Friend, R., & Bennett, R. M. (2008). Conceptualizing and measuring illness self‐concept: A comparison with self‐esteem and optimism in predicting fibromyalgia adjustment. Research in Nursing and Health,31(6), 563-575.
https://doi.org/10.1002/nur.20294
Moss-Morris, R., & Petrie, K. J. (2003). Experimental evidence for interpretive but not attention biases towards somatic information in patients with chronic fatigue
syndrome. British Journal of Health Psychology,8, 195-208. Retrieved February 26, 2019, from http://citeseerx.ist.psu.edu/viewdoc/download?doi=10.1.1.560.198&rep= rep1&type=pdf
Mukaka, M. M. (2012). Statistics Corner: A guide to appropriate use of Correlation
coefficient in medical research. Malawi Medical Journal,24(3), 69-71. Retrieved May 30, 2019, from https://www.ajol.info/index.php/mmj/article/view/81576.
Niemiec, C. P., Ryan, R. M., Patrick, H., Deci, E. L., & Williams, G. C. (2010). The energization of health-behavior change: Examining the associations among
autonomous self-regulation, subjective vitality, depressive symptoms, and tobacco abstinence. The Journal of Positive Psychology,5(2), 122-138.
https://doi.org/10.1080/17439760903569162
Palmer, L. (2013). The Relationship Between Stress, Fatigue, and Cognitive
Functioning. College Student Journal,47(2), 312-325. Retrieved June 2, 2019, from https://www.ingentaconnect.com/content/prin/csj/2013/00000047/00000002/art00007.
https://research.utwente.nl/en/activities/cognitive-bias-modification-to-relieve-fatigue-symptoms-prelimina
Puetz, T. W. (2006). Physical Activity and Feelings of Energy and Fatigue. Sports Medicine,36(9), 767-780. https://doi.org/10.2165/00007256-200636090-00004 Regehr, C., Glancy, D., & Pitts, A. (2013). Interventions to reduce stress in university
students: A review and meta-analysis. Journal of Affective Disorders,148(1), 1-11. https://doi.org/10.1016/j.jad.2012.11.026
Riffle, K. L., Yoho, J., & Sams, J. (1989). Health‐Promoting Behaviors, Perceived Social Support, and Self‐Reported Health of Appalachian Elderly.Public Health
Nursing,6(4), 204-211. https://doi.org/10.1111/j.1525-1446.1989.tb00598.x
Rouse, P. C., Veldhuijzen Van Zanten, J. J. J. C. S., Ntoumanis, N., Metsios, G. S., Yu, C., Kitas, G. D., & Duda, J. L. (2015). Measuring the positive psychological well-being of people with rheumatoid arthritis: A cross-sectional validation of the subjective vitality scale. Arthritis Research & Therapy,17(312), 1-7. https://doi.org/10.1186/s13075-015-0827-7
Ryan, J. L., Carroll, J. K., Ryan, E. P., Mustian, K. M., Fiscella, K., & Morrow, G. R. (2007). Mechanisms of Cancer-Related Fatigue. The Oncologist,12(1), 22-34.
doi:10.1634/theoncologist.12-S1-22
Ryan, R. M., & Frederick, C. (1997). On Energy, Personality, and Health: Subjective Vitality as a Dynamic Reflection of Well‐Being.Journal of Personality,65(3), 529-565. https://doi.org/10.1111/j.1467-6494.1997.tb00326.x
Schoenmakers, T. M., De Bruin, M., Lux, I. F., Goertz, A. G., Van Kerkhof, D. H., & Wiers, R. W. (2010). Clinical effectiveness of attentional bias modification training in abstinent alcoholic patients. Drug and Alcohol Dependence,109, 30-36.
doi:10.1016/j.drugalcdep.2009.11.022
Schumacher, S. E., Kemps, E., & Tiggemann, M. (2016). Bias modification training can alter approach bias and chocolate consumption. Appetite,96, 219-224.
http://dx.doi.org/10.1016/j.appet.2015.09.014
Shankland, R., Kotsou, I., Vallet, F., Bouteyre, E., Dantzer, C., & Leys, C. (2018). Burnout in university students: The mediating role of sense of coherence on the relationship between daily hassles and burnout. Higher Education,1-23.
https://doi-org.ezproxy2.utwente.nl/10.1007/s10734-018-0332-4
Shen, J., Barbera, J., & Shapiro, C. M. (2006). Distinguishing sleepiness and fatigue: Focus on definition and measurement. Sleep Medicine Reviews,10(1), 63-76.