Original citation:
Celia, Helen, Iona, Alfonsina, Petrescu, Alina, Clegg, Chris, Battisti, Giuliana and Fu, Xiaolan (2008) Understanding retail capabilities. London: Research Report.
Permanent WRAP URL:
http://wrap.warwick.ac.uk/96310
Copyright and reuse:
The Warwick Research Archive Portal (WRAP) makes this work by researchers of the University of Warwick available open access under the following conditions. Copyright © and all moral rights to the version of the paper presented here belong to the individual author(s) and/or other copyright owners. To the extent reasonable and practicable the material made available in WRAP has been checked for eligibility before being made available.
Copies of full items can be used for personal research or study, educational, or not-for-profit purposes without prior permission or charge. Provided that the authors, title and full bibliographic details are credited, a hyperlink and/or URL is given for the original metadata page and the content is not changed in any way.
A note on versions:
The version presented here is a working paper or pre-print that may be later published elsewhere. If a published version is known of, the above WRAP url will contain details on finding it.
UNDERSTANDING RETAIL
CAPABILITIES
Helen Celia, Alfonsina Iona, Alina Petrescu,
Chris Clegg, Giuliana Battisti, & Xiaolan Fu
For further information contact:
UNDERSTANDING RETAIL CAPABILITIES
Contents
Page
1. Executive Summary 1
2. Introduction 5
2.1 Background rationale 5
2.2 What were the objectives of the survey? 5
2.3 Which capabilities were included in the survey? 6
2.4 How was the survey conducted? 8
2.5 Who took part? 9
2.6 What makes this survey unique? 11
3. Findings 12
3.1 What levels of capabilities are reported by retailers? 12
3.2 For how long have businesses been highly capable in each area? 16 3.3 Do capabilities vary systematically? 21 3.4 Are the capabilities themselves inter-related? 28
4. Discussion and Implications 33
4.1 Representativeness and reliability of the findings 33
4.2 Summary of the findings -- What have we found? 35
4.3 Implications -- What does it mean? 36
4.4 Further investigations 37
5. Acknowledgements
38
1. Executive Summary
1.1 This report describes the results of a survey of retail businesses in the UK. The aims of the survey were to examine the prevalence of certain key capabilities across retailers, and to investigate their potential contribution to productivity.
1.2 The specific research questions are:
What levels of capabilities are reported by retailers?
Where they are capable, for how long have they been capable in the various areas?
Do capabilities vary systematically? (for example by size of business or ownership)
Are the capabilities themselves inter-related?
Do the capabilities correlate with productivity?
1.3 34 organisational capabilities were measured and these can be grouped into 5 categories, namely: Human Resources; Operations; Rewards and Incentives; Marketing; and Leadership and Change.
1.4 The survey was designed and analysed by researchers at the
Universities of Aston, Leeds, Nottingham and Oxford. It was undertaken by a business and market research agency, using telephone interviews with senior managers in retail organisations.
1.5 The survey used a random stratified sample of retail businesses in the UK employing 10 or more people. Businesses were surveyed from 6 retail sub-sectors across a range of sizes from 10 to over 250
employees. Within these categories, approximately 7% of all retail businesses operating in the UK were sampled, and 1,000 complete and valid responses were obtained. As such, the survey represents the most comprehensive survey of retailers’ capabilities within the UK.
1.6 Interviews were conducted with senior managers who had responsibility for operations. The response rate1 was 29%. Interviewees were asked a range of questions about the capabilities of their UK business and other factors important to business productivity.
1.7 The main findings concern 5 questions:
What levels of capabilities are reported by retailers?
It is apparent that the levels of reported capabilities vary systematically within this sample. In particular retail strengths lie in Marketing and Operational capabilities.
These strengths almost certainly reflect the strategic priorities that have been pursued within retail businesses.
At the other end of the spectrum, significantly lower levels of capability are reported in Human Resources and Rewards and Incentives. Mid-level scores are reported in the areas of Leadership and Change.
Again, it may well be that these relative weaknesses reflect the strategic priorities that retail businesses have set themselves.
This pattern of strengths and weaknesses may well reflect something of a cultural zeitgeist within retailing in the UK.
Most obviously there is much scope for general improvement in the areas of Human Resources, Rewards and Incentives, and Leadership and Change. Significant numbers of businesses report that they have moderate capabilities or less in these areas.
But there is also scope for improvement even in strong areas. With the exception of the 2 top rated capabilities, even for the remaining top 8, around 40-50% of businesses report less than a great deal of capability.
One possible interpretation of the results is that the lower capabilities in Human Resources, Rewards and Incentives, and Leadership and Change all reflect a strategic lack of attention to, and focus on, the ‘people aspects’ of retailing.
This could be interpreted both as a weakness but also as a significant opportunity.
For how long have businesses been highly capable in each area?
It is apparent that businesses reporting high levels of capability claim to have been working at a high level for some quite considerable periods of time – these are not new issues. Thus, for those businesses who
reported high levels of capability (level 5 or more) the average capability maturity had been established for 17.4 years.
The top ten longest established mature capabilities tended to belong to either Marketing or Operations, whereas the bottom ten were
predominantly Human Resource capabilities with two Rewards and Incentives items with the shortest durations.
Thus the highest reported levels of capability also tend to be those that have been in place the longest
Do capabilities vary systematically?
The strongest pattern of findings was that the results are broadly common across the sample, regardless of business size, sub-sector of activity, pattern of ownership, and by age of the business.
Where these differences exist within the sample, they do not appear to be surprising (though this does require further confirmatory
investigation).
For example smaller businesses report higher capability than medium and large businesses at retaining good staff and listening to staff. On the other hand, they are worse at providing clear targets for staff and thoroughly appraising them.
Similarly there are some minor differences according to Sub-sector, by British-owned vs. Foreign owned, by Family-owned vs. not, by Group-owned vs. not, and by age of the business.
Are the capabilities themselves inter-related?
Initial statistical tests do suggest that the Capabilities are inter-related.
This may be because businesses strong in one area also tend to be strong in others perhaps reflecting an underlying overall management capability.
Or this inter-relationship may reflect, at least in part, a positive bias when answering questions of this kind.
The same arguments apply for those reporting themselves less capable in certain areas.
There is some statistical evidence that the 5 areas of capability can be treated as distinct categories for the purposes of analysis.
Statistical evidence also supports the validity of combining all 5 capability categories into a single Total Capability Index.
Do the capabilities correlate with productivity?
The data reveal that the 2 indices of labour productivity, one gathered from survey respondents and the other from independent financial information, are significantly correlated with various measures of
capability. This gives some confidence that capabilities and productivity are linked.
However, the data are correlational and cannot be used to interpret a causal relationship. This will require a stronger longitudinal research design and the collection of further data over time.
1.8 A number of potential implications arise from these results and the most significant of these are elaborated below:
Retail businesses should consider their individual profiles of strengths and weaknesses.
It is likely that there is scope for considerable improvement in issues concerned with Human Resources, Rewards and Incentives, and Leadership and Change.
These are likely to represent major challenges but also major opportunities.
One major issue here may well concern the amount of priority and focus given by individual businesses to how they manage and lead their staff, especially as competition increases and operational changes become the norm.
One way forward may involve reviewing the role of the HR or Personnel function within retail – does the function have the strategic role, priority, focus, and quality that meet the needs of the business?
Senior management teams within retail should also focus some of their energies on learning from other sectors and from other cultures (as was the case with UK manufacturing industry during the 1990s). Thus for example,
o Can retail learn from manufacturing?
o Can retail in the UK learn from retail in the USA, France or Japan?
o What opportunities are there for systematic benchmarking of capabilities and productivity?
1.9 The following activities are identified as priorities for the next stages of research in this area:
More sophisticated multi-variate statistical analyses of the existing data set.
Follow-up work to explain why certain differences have been found within this study.
More detailed work in retail businesses to see how capabilities are developed over time on the ground.
Further collection of independent performance data over time. This will enable researchers to investigate for lagged effects of Capabilities on Productivity.
Repeat of survey in 2-4 years time to examine changes in capabilities and productivity over time.
Further use of these ideas in other sectors to investigate whether or not Capabilities offer a useful explanation for variations in productivity.
2. Introduction
2.1 Background Rationale
2.1.1 Empirical evidence suggests that a ‘productivity gap’ exists whereby the labour productivity of retailers in the UK lags behind retailers in other countries, such as the USA and France2. Furthermore, the retail sector appears to account for a substantial part of the shortfall in overall
national productivity statistics, again comparing the UK with the USA and France. The productivity of retail businesses in the UK appears to be a significant topic and to date has been relatively under-researched. The survey described in this report forms one part of a study examining productivity in retail businesses in the UK.
2.1.2 This survey focuses on the capabilities reported by a randomised stratified sample of retail businesses in the UK. The survey adopts a broad definition of capabilities which are taken to mean the successful exploitation of an organisation’s existing competency3
. The study included a broad range of capabilities and covered:
Human Resources (such as the capabilities to attract, train and appraise staff).
Operations (such as the capabilities to control waste, manage suppliers and work in teams).
Rewards and Incentives (such as the capabilities to provide a good reward package, provide incentives, and praise and encourage staff).
Marketing (such as the capabilities to provide customers with high quality goods and services, price products competitively and have a strong brand in the market place).
Leadership and Change (such as the capabilities to implement new initiatives and provide leadership throughout the business).
2.2 What were the objectives of this survey?
2.2.1 The core aim of the survey was to examine the prevalence of
capabilities across retailers in the UK, and how important these are to productivity. The specific research questions are as follows:
2 For more information see Reynolds, J., Howard, E., Dragun, D., Rosewell, B., & Ormerod, P. (2005).
Assessing the Productivity of the UK Retail Sector. International Review of Retail, Distribution and Consumer Research, 15 (3), 237-280.
3 Teece, D. J., Pisano, G. & Shuen, A. (2004). Dynamic Capabilities and Strategic Management. In: The
What levels of capabilities are reported by retailers?
Where they are capable, for how long have they been capable in the various areas?
Do capabilities vary systematically? (for example by size of business or ownership)
Are the capabilities themselves inter-related?
Do the capabilities correlate with productivity?
2.2.2 In addition to these specific objectives, the survey was designed to be part of an ongoing investigation and analysis of retail capabilities and productivity.
2.3 Which capabilities were included in the survey?
2.3.1 The research team decided at the outset to include a broad range of capabilities. The rationale was twofold.
2.3.2 First, much of the research in the management literature examining productivity tends to focus on particular issues, for example on whether or not aspects of HR predict higher productivity. Typically such studies do not include at the same time issues concerning HR, Operations, Rewards and Incentives, Marketing and Leadership. This means that any evidence thereby is partial.
2.3.3 And second, the inclusion of a wider range allows more interesting data analysis. For example, one can test whether or not HR issues predict productivity better or worse than the others. Alternatively, one might argue (and be able to test) whether or not businesses need to be capable across all these areas in order to perform well. The underlying point is that wider inclusion allows more comprehensive testing of alternative explanations.
2.3.4 The final set of capabilities used in the survey was developed using the following process:
A review of research on organisational capabilities and management practices, including detailed evaluation of retail case studies and previous employer surveys within the UK.
The development of a list of 62 capabilities then used in detailed case studies in 4 departments in 2 stores of a large national department store in the UK.
The use of 32 capabilities in a study of hotels in the UK and Brazil.
Category Item Capability Description
HR
1 Attracting strong candidates for job vacancies
2 Selecting good members of staff
3 Retaining good staff
4 Training staff in customer service and selling
5 Training staff in product knowledge
6 Developing staff to the best of their abilities
7 Thoroughly appraising staff on a regular basis
8 Identifying and promoting good people
9 Managing ‘poor performers’
OP
10 Ensuring staff rotas match the times customers are shopping
11 Controlling waste (e.g., damage and losses)
12 Ensuring stock is on the shelves and available at the right time
13 Managing suppliers effectively
14 Communicating with staff
15 Listening to staff
16 Empowering shop floor staff to take responsibility and make operational decisions
17 Solving problems quickly on the shop floor
18 Working in teams on the shop floor
19 Working flexibly on the shop floor
20 Using shop floor systems and processes that are clear and well-understood
RI
21 Providing a good reward package (both monetary and non-monetary)
22 Providing incentives that motivate staff to improve performance
23 Praising and encouraging staff
24 Providing clear targets for shop floor staff
25 Routinely giving feedback to shop floor staff on their performance
MK
26 Providing customers with high quality products and services
27 Pricing products competitively
28 Providing customers with value for money
29 Having a strong brand or image in the market place
30 Gathering and listening to customer feedback
31 Advertising and promotions (including visual merchandising)
LC
32 Implementing new initiatives to improve the business
33 Providing leadership throughout the business
34 Learning from competitors
Key to capability categories: HR = Human Resources; OP = Operations; RI = Rewards and Incentives; MK = Marketing; LC = Leadership and Change.
For each capability the respondents were asked, “In the UK at present, how capable is your business?” using the following response format:
Level 1 No real capability
Level 2 A small amount of capability
Level 3 A moderate amount of capability, but it can be patchy and inconsistent across the business
Level 4 Quite a lot of capability, but it can be patchy and inconsistent across the business
Level 5 A great deal of capability
Level 6 Excellent, truly world class and consistent across all parts of the business
2.4 How was the survey conducted?
2.4.1 The survey was designed and analysed by researchers at the Universities of Aston, Leeds, Nottingham and Oxford. A leading
business and market research company undertook the survey pilot, prior to running the main study. Data were collected through telephone
interviews with senior managers in retail organisations. The survey included questions regarding:
the business environment within which the organisation operates (e.g., retail sub-sector, total number of employees, country of ownership, number of selling branches, overall selling area);
the levels of the 34 capabilities across retailers (also duration for those rated as mature, i.e., ‘at least a great deal’ or ‘excellent, world-class’);
the nature of the workforce (e.g., number of full-time equivalent
employees, trade union membership, % shop floor staff with a degree);
indicators about the way in which internal processes operate within the business (e.g., annual training hours per employee, number of
management levels);
aspects of customer demand (e.g., % internet sales, extent of unpredictable variation in customer demands);
a small number of financial performance variables (e.g. annual sales turnover, gross profit).
2.4.2 Once the survey data had been gathered from 1,000 businesses, various databases were used to gather independent information from their most recently available financial reports. These data were matched to each business’ survey results by Company Registration Number. This was to allow the researchers to investigate statistical relationships between the data in the survey and the independent financial
information.
2.5 Who took part?
2.5.1 The survey was administered to a random stratified sample of retail businesses operating in the UK4 with more than 10 employees. Two dimensions were used to stratify the sample: business size (number of employees) and retail sub-sector5.
2.5.2 The original survey brief focused on businesses based in England, Scotland and Wales (i.e., the UK excluding Northern Ireland). However, a small number of businesses based in N.I. have been included; these businesses operate retail operations across the rest of the UK.
2.5.3 Three categories of business size were used: businesses employing 10 - 49, 50 – 249, and 250 or more people. These size categories are the ones in standard use within BERR6 (formerly known as the DTI).
2.5.4 Businesses were surveyed in 6 of the 7 retail sub-sectors using the UK’s Standard Industrial Classification (SIC) system, category 52. The sub-sector Repair of personal and household goods (52.7) was excluded from this study because it constitutes only a relatively small proportion of SIC 52 (just 1.4%). The sub-sector Retail sale of second hand goods in stores (52.5) was also initially excluded from the study based on its small size; however the reclassification exercise (see point 2.5.6) resulted in 10 businesses being sampled from this sub-sector. For completeness we have included those cases.
2.5.5 The IDBR7 database was used to identify the overall population of businesses in SIC 52 and its constituent sub-sectors. The majority of completed interviews were sourced from Dun and Bradstreet (956, 95.6%) with a minority from Experian (44, 4.4%).
4 The survey company obtained contact details and company registration numbers for retailers operating
in the UK. If, when contacted, a business did not have any retail function then it was not surveyed.
5
This is not necessarily the primary SIC code for every organisation; it is the corresponding code for the organisation’s primary retail business. Even if businesses operate nominally in one industry they may, in fact, operate in different market niches (e.g. a business which manufactures, wholesales, and retails its products).
6
The UK government’s Department for Business, Enterprise and Regulatory Reform.
7
UK SIC code
Description of Sub-sector
Number of Employees
10-49 50-249 250+ TOTAL
52.1 Retail sale in non-specialised
stores 148 (1,985) 7.5% 38 (210) 18.1% 18 (100) 18.0% 204 (2,295) 8.9% 52.2
Retail sale of food, beverages and tobacco in specialised stores 155 (1,750) 8.9% 19 (100) 19.0% 4 (35) 11.4% 178 (1,885) 9.4% 52.3
Retail sale of pharmaceutical and medical goods, cosmetic and toilet articles
53 (840) 6.3% 14 (80) 17.5% 9 (20) 45.0% 76 (940) 8.1%
52.4 Other retail sale of new goods in
specialised stores 369 (7,255) 5.1% 112 (745) 15.0% 31 (285) 10.9% 512 (8,285) 6.2%
52.5 Retail sale of second-hand
goods in stores
7 (145) 4.8% 3 (10) 30.0% 0 (0) 0.0% 10 (155) 6.5%
52.6 Retail sale not in stores 10 (480)
2.1% 8 (65) 12.3% 2 (30) 6.7% 20 (575) 3.5%
52 TOTAL 742 (12,455)
[image:15.612.61.542.98.417.2]6.0% 194 (1,210) 16.0% 64 (470) 13.6% 1,000 (14,135) 7.1% In each cell: Number of responses (population) proportion of population surveyed %.
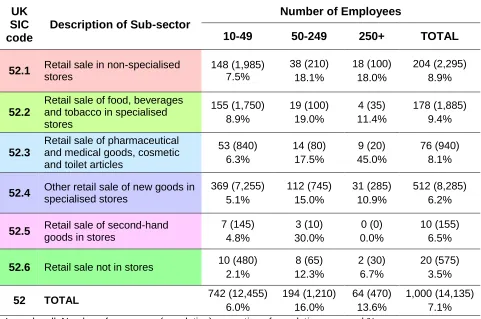
Table 2. Sampling frame used in the survey.
2.5.6 The aim was to sample a random quota of 5% of all businesses within each category (i.e., 5% from each cell in Table 2). In practice, 1,000 usable interviews were achieved. Table 2 shows the distribution of these. The first figure in each cell shows the number of completed interviews, while the total number of businesses in each category is shown in brackets. For example, 148 responses were obtained from the 1,985 businesses in ’52.1 Retail Sale in Non-Specialised Stores’
employing 10-49 employees, representing 7.5% of the population in this cell. Overall, a sample of 7.1% was achieved.
For statistical reasons, efforts were made to sample relatively more businesses in cells where there were relatively few businesses. Typically this meant over-sampling the medium-sized and large businesses.
resulted in a minority of businesses (129) being re-classified into an alternative code.
2.5.7 For each business, the interview was conducted with a senior manager who holds responsibility for operations. In a small business this might have been the Owner-Manager, or in the case of a large business the Operations Director.
2.5.8 Potential respondents from 2,453 businesses declined to take part when approached, and 1,000 interviews were successfully completed to an acceptable standard. This represents a response rate of 29.0% (‘complete interviews’ divided by ‘complete interviews plus refusals’).
2.5.9 In each case, respondents were asked to give answers based on the entity’s UK business as a whole.
2.5.10 The interviews were conducted during October and November 2007.
2.6 What makes this survey unique?
2.6.1 So far as the authors can ascertain the following features make this survey of retail businesses in the UK unique:
The large sample size, gathered using a rigorous randomised stratified sampling frame.
The collection of both self-reported and independently gathered
performance data, and the opportunity to gather further performance and productivity data over time.
3. Findings
The major findings are described below, organised into 5 sections:
What levels of capabilities are reported by retailers?
For how long have businesses been highly capable in each area?
Do capabilities vary systematically?
Are the capabilities themselves inter-related?
Do the capabilities correlate with productivity?
3.1 What levels of capabilities are reported by retailers?
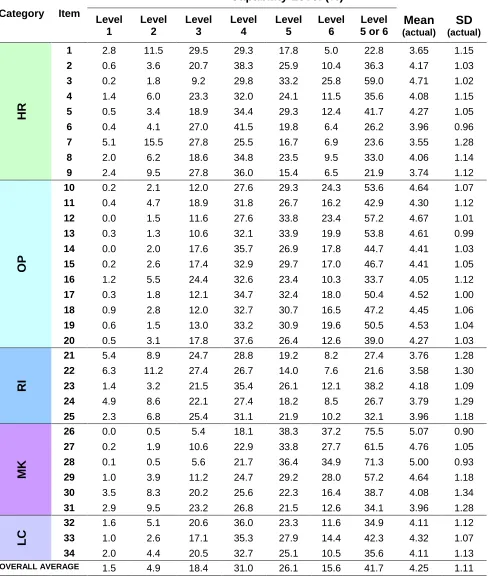
3.1.1 One of the main objectives of the survey was to establish the levels of retail capabilities. These findings are summarised in Table 3, which shows the percentage of businesses reporting levels of capability in each area.
3.1.2 A statistical test8 revealed that there are significant differences in the levels of capability reported across the 34 different areas. For example, it is clear as a sample that businesses report they are significantly more capable in the areas of Marketing (for example, items 26, 28, 27 and 29) than they are in the area of Human Resources (for example, items 9, 1, 7, 6 and 8).
3.1.3 It is evident from Tables 3 and 3a that the highest levels of capabilities are reported for Marketing capabilities. For example, 75.6% of
businesses report that they are at levels 5 or 6 in ‘Providing customers with high quality products and services’ (item 26) and the data are similarly positive for ‘Providing customers with value for money’ (item 28 -- 71.3%), ‘Pricing products competitively’ (item 27 -- 61.5%) and ‘Having a strong brand or image in the market place’ (item 29 -- 57.2%).
3.1.4 Operational capabilities are rated nearly as highly. For example, 57.2% of businesses report themselves at levels 5 or 6 in ‘Ensuring stock is on the shelves and available at the right time’ (item 12) and the ratings are all over 50% for ‘Managing suppliers effectively’ (item 13), ‘Ensuring staff rotas match the times customers are shopping’ (item 10), ‘Working flexibly on the shopfloor’ (item 19) and ‘Solving problems quickly on the shopfloor’ (item 17).
3.1.5 Nevertheless, it should be noted that there is still scope for
improvement. Thus the percentage of businesses rating themselves at levels 5 or 6 on these capabilities reveals that a large number of retailers
surveyed do not consider they have at least a great deal of capability in these key areas. Looking at 8 of the top 10 capabilities, one-third to one-half of businesses report that they have less than a great deal of capability.
3.1.6 In contrast, the lowest levels of capabilities are reported in 2 areas, namely Human Resources, and Rewards and Incentives. These are reported at levels 5 and 6 for between approximately 22% and 34% of businesses (see Table 3b).
3.1.7 Put another way round between 45% and 31% of this sample report that they have no real capability, a small amount of capability or a moderate amount of capability (which can be patchy and inconsistent across the business) in ‘Providing incentives’ (item 22), ‘Managing poor performers’ (item 9), ‘Attracting strong candidates’ (item 1), ‘Appraising staff’ (item 7), ‘Developing staff’ (item 6), ‘Providing targets’ (item 24), ‘Providing a good reward package’ (item 21), ‘Giving feedback’ (item 25), ‘Promoting good people’ (item 8) and ‘Empowering shopfloor staff’ (item 16).
Clearly there is plenty of scope for general improvement.
3.1.8 Inspection of the lowest 10 scores reveals that all these items are concerned with how businesses manage their staff.
3.1.9 Looking more closely at these data, it is also apparent that in the areas where businesses on average are stronger (Marketing and Operations) their lowest scores are for: ‘Advertising and promotions (item 31); Gathering and listening to customer feedback (item 30); ‘Empowering shopfloor staff to take responsibility and make operational decisions’ (item 16); and ‘Using shopfloor systems and processes that are clear and well-understood’ (item 20).
3.1.10 On the other hand, looking at the areas where the businesses appear to be weakest (Human Resources and Rewards and Incentives), the scores are in the top to mid range for ‘Retaining staff’ (item 3), ‘Training staff in product knowledge’ (item 6), ‘Praising and encouraging staff’ (item 23).
3.1.11 For the fifth category of capability, namely Leadership and Change (items 32-34), the scores are largely in the mid range.
Category Item
Capability Level (%)
Level 1 Level 2 Level 3 Level 4 Level 5 Level 6 Level 5 or 6
Mean (actual)
SD (actual)
HR
1 2.8 11.5 29.5 29.3 17.8 5.0 22.8 3.65 1.15
2 0.6 3.6 20.7 38.3 25.9 10.4 36.3 4.17 1.03
3 0.2 1.8 9.2 29.8 33.2 25.8 59.0 4.71 1.02
4 1.4 6.0 23.3 32.0 24.1 11.5 35.6 4.08 1.15
5 0.5 3.4 18.9 34.4 29.3 12.4 41.7 4.27 1.05
6 0.4 4.1 27.0 41.5 19.8 6.4 26.2 3.96 0.96
7 5.1 15.5 27.8 25.5 16.7 6.9 23.6 3.55 1.28
8 2.0 6.2 18.6 34.8 23.5 9.5 33.0 4.06 1.14
9 2.4 9.5 27.8 36.0 15.4 6.5 21.9 3.74 1.12
OP
10 0.2 2.1 12.0 27.6 29.3 24.3 53.6 4.64 1.07
11 0.4 4.7 18.9 31.8 26.7 16.2 42.9 4.30 1.12
12 0.0 1.5 11.6 27.6 33.8 23.4 57.2 4.67 1.01
13 0.3 1.3 10.6 32.1 33.9 19.9 53.8 4.61 0.99
14 0.0 2.0 17.6 35.7 26.9 17.8 44.7 4.41 1.03
15 0.2 2.6 17.4 32.9 29.7 17.0 46.7 4.41 1.05
16 1.2 5.5 24.4 32.6 23.4 10.3 33.7 4.05 1.12
17 0.3 1.8 12.1 34.7 32.4 18.0 50.4 4.52 1.00
18 0.9 2.8 12.0 32.7 30.7 16.5 47.2 4.45 1.06
19 0.6 1.5 13.0 33.2 30.9 19.6 50.5 4.53 1.04
20 0.5 3.1 17.8 37.6 26.4 12.6 39.0 4.27 1.03
RI
21 5.4 8.9 24.7 28.8 19.2 8.2 27.4 3.76 1.28
22 6.3 11.2 27.4 26.7 14.0 7.6 21.6 3.58 1.30
23 1.4 3.2 21.5 35.4 26.1 12.1 38.2 4.18 1.09
24 4.9 8.6 22.1 27.4 18.2 8.5 26.7 3.79 1.29
25 2.3 6.8 25.4 31.1 21.9 10.2 32.1 3.96 1.18
MK
26 0.0 0.5 5.4 18.1 38.3 37.2 75.5 5.07 0.90
27 0.2 1.9 10.6 22.9 33.8 27.7 61.5 4.76 1.05
28 0.1 0.5 5.6 21.7 36.4 34.9 71.3 5.00 0.93
29 1.0 3.9 11.2 24.7 29.2 28.0 57.2 4.64 1.18
30 3.5 8.3 20.2 25.6 22.3 16.4 38.7 4.08 1.34
31 2.9 9.5 23.2 26.8 21.5 12.6 34.1 3.96 1.28
LC
32 1.6 5.1 20.6 36.0 23.3 11.6 34.9 4.11 1.12
33 1.0 2.6 17.1 35.3 27.9 14.4 42.3 4.32 1.07
34 2.0 4.4 20.5 32.7 25.1 10.5 35.6 4.11 1.13
[image:19.612.62.550.102.680.2]OVERALL AVERAGE 1.5 4.9 18.4 31.0 26.1 15.6 41.7 4.25 1.11
Top Ten Capabilities Level 5 or 6 (%)
Level 1, 2, or
3 (%) Category Item Capability Description
MK 26 Providing customers with high quality products and services 75.5 5.9
MK 28 Providing customers with value for money 71.3 6.2
MK 27 Pricing products competitively 61.5 12.7
HR 3 Retaining good staff 59.0 11.2
OP 12 Ensuring stock is on the shelves and available at the right time 57.2 13.1
MK 29 Having a strong brand or image in the market place 57.2 16.1
OP 13 Managing suppliers effectively 53.8 12.2
OP 10 Ensuring staff rotas match the times customers are shopping 53.6 14.3
OP 19 Working flexibly on the shop floor 50.5 15.1
[image:20.612.60.565.89.336.2]OP 17 Solving problems quickly on the shop floor 50.4 14.2
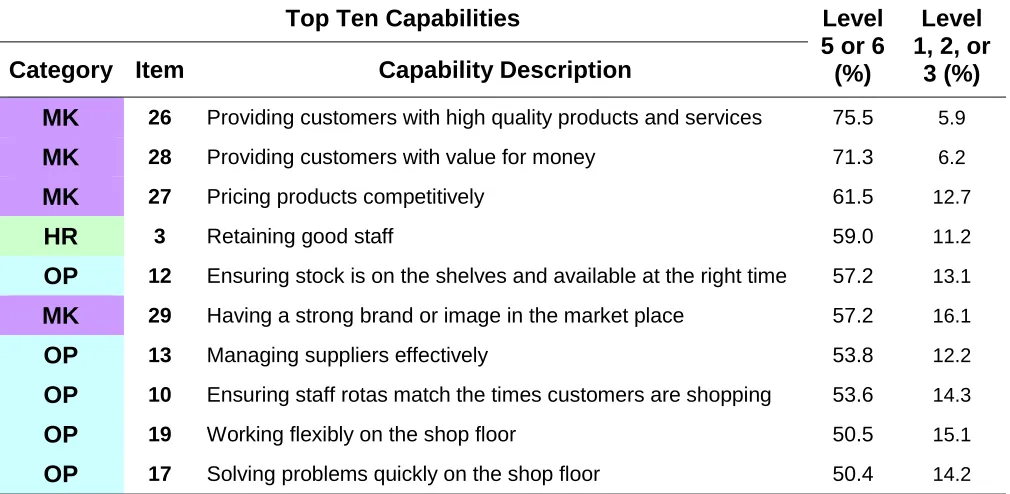
Table 3a. Top ten capabilities, by % of businesses at level 5 or 6, plus % at level 1, 2 or 3.
Bottom Ten Capabilities Level 5 or 6 (%)
Level 1, 2, or
3 (%) Category Item Capability Description
RI 22 Providing incentives that motivate staff to improve performance 21.6 44.9
HR 9 Managing ‘poor performers’ 21.9 39.7
HR 1 Attracting strong candidates for job vacancies 22.8 43.8
HR 7 Thoroughly appraising staff on a regular basis 23.6 48.4
HR 6 Developing staff to the best of their abilities 26.2 31.5
RI 24 Providing clear targets for shop floor staff 26.7 35.6
RI 21 Providing a good reward package 27.4 39.0
RI 25 Routinely giving feedback to shop floor staff on their
performance 32.1 34.5
HR 8 Identifying and promoting good people 33.0 26.8
OP 16 Empowering shop floor staff to take responsibility and make
operational decisions 33.7 31.1
[image:20.612.57.564.400.674.2]3.1.13 Summary
There are significant differences in capability levels across the 34 capabilities measured.
The highest levels of capabilities are reported in the areas of Marketing and Operations.
The very highest capabilities are reported for two capabilities from the marketing category: ‘Providing customers with high quality products and services’, and ‘Providing customers with value for money’. More than 70% of respondents reported that their business has at least a great deal of capability in each of these areas.
Having said that, not all the capabilities in these areas were scored highly – for example, relatively low scores were given for: ‘Advertising and promotions’ (item 31); ‘Gathering and listening to customer
feedback’ (item 30); ‘Empowering shopfloor staff to take responsibility and make operational decisions’ (item 16); and ‘Using shopfloor systems and processes that are clear and well-understood’ (item 20).
The lowest levels of capabilities are reported for Human Resources and Rewards and Incentives.
The very lowest levels of capabilities are reported for 4 capabilities at the heart of how businesses manage their staff, namely: ‘Providing
incentives that motivate staff to improve performance’ (item 22),
‘Managing poor performers’ (item 9), ‘Attracting strong candidates’ (item 1), and ‘Thoroughly appraising staff’ (item 7). A total of 40% or more of this sample reported that they have no real capability, a small amount of capability or a moderate amount of capability in these areas.
However, even in these (low-scoring areas) some scores are in the top to mid range, namely those for ‘Retaining staff’ (item 3), ‘Training staff in product knowledge’ (item 5), and ‘Praising and encouraging staff’ (item 23).
The capabilities concerned with Leadership and Change were scored in the mid-range.
The variability in the reported capabilities appears to reflect a differentiated and considered set of responses to the survey.
3.2 For how long have businesses been highly capable in each area?
operating at a high level of capability on this issue, they describe that they have been at this level for 16 years.
3.2.2 If a business reported a capability level lower than 5, they were not asked this question.
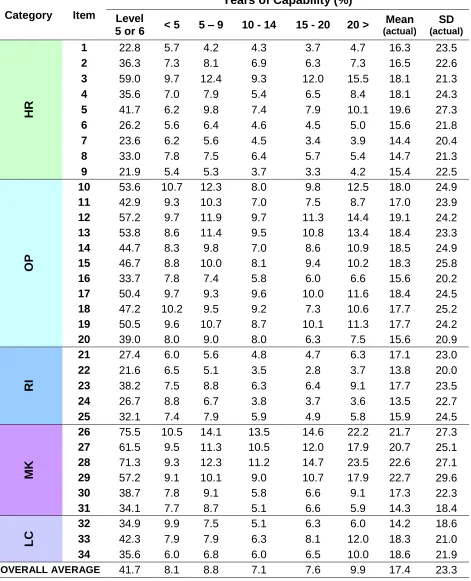
3.2.3 The average capability maturity has been established for 17.4 years.
3.2.4 The high capabilities that have been in place for the longest and shortest periods are summarised in Tables 4a and 4b.
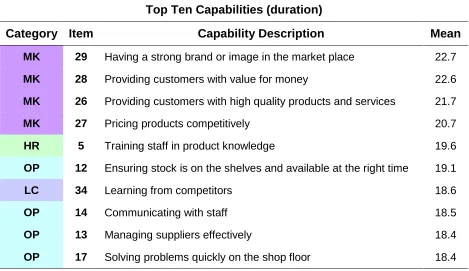
3.2.5 The list of the longest standing capabilities is dominated by Marketing and Operations issues. Thus, for example, ‘Having a strong brand or image’ (item 29), ‘Providing customers with value for money’ (item 28), ‘Providing customers with high quality products and services’ (item 26), and ‘Pricing products competitively’ (item 27) have all been in place on average for 20 or more years. Operating capabilities also had 4 items in the top ten, ranging between 18 and 20 years (Stock availability,
Communicating with staff, Managing suppliers, Solving problems quickly on the shop floor).
3.2.6 2 other capabilities reached the top ten: ‘Training staff in product
knowledge’ (item 5, HR), and ‘Learning from competitors’ (item 34, LC). These 2 capabilities have been mature for a longer amount of time than other capabilities in these categories.
3.2.7 The list of 10 most recently developed capabilities is dominated by Human Resource and Rewards and Incentives items: ‘Providing clear targets’ (item 24), ‘Providing incentives’ (item 22), ‘Thoroughly
appraising staff’ (item 7), ‘Identifying and promoting good people’ (item 8), ‘Managing poor performers’ (item 9), and ‘Developing staff to the best of their abilities’ (item 6), with the average number of years of capability at around 13 to 16 years.
3.2.8 Referring back to the levels of capabilities reported in Section 3.1, it is largely the same capabilities which feature in the ‘top ten’ and ‘bottom ten’ in terms of both level and duration.
3.2.9 7 ‘top ten’ items are duplicated; 4 from Marketing (Having a strong brand, Providing value for money, Providing high quality products and services, and Pricing products competitively) and 3 from Operations (Stock availability, Managing suppliers, Solving problems quickly).
3.2.10 7 ‘bottom ten’ items are duplicated; 4 from Human Resources
and a mixture of Rewards and Incentives (Providing clear targets, Incentives to improve performance) and Operations (Using clear systems and processes).
3.2.11 This pattern strongly suggests that there is a positive relationship between the level of capability and the duration of that maturity9. Similarly, the lower the average level of a capability, the more likely the capability is to have been mature for a shorter amount of time.
3.2.12 One possible explanation for this pattern could be that retailers do hold common strategic management priorities, and over time the relevant capabilities have been intentionally developed to a mature level at a relatively early stage (compared to other capabilities). At the other end of the scale those capabilities which retailers may consider less
important, or are perhaps more difficult or resource-intensive to improve, tend to reach lower average levels and for those retailers which have developed them to maturity this has occurred at a relatively late stage (compared to other capabilities).
3.2.13 Summary
For those businesses who reported high levels of capability (level 5 or more) the average capability maturity had been established for 17.4 years.
The top ten longest established mature capabilities tend to belong to either Marketing or Operations, whereas the bottom ten are
predominantly Human Resource capabilities with two Rewards and Incentives items with the shortest durations.
Thus the highest reported levels of capability also tend to be those that have been in place the longest.
9 NB only businesses reporting capabilities at the level ‘a great deal’ or higher were asked “How long
Category Item
Years of Capability (%)
Level
5 or 6 < 5 5 – 9 10 - 14 15 - 20 20 >
Mean
(actual)
SD
(actual)
HR
1 22.8 5.7 4.2 4.3 3.7 4.7 16.3 23.5
2 36.3 7.3 8.1 6.9 6.3 7.3 16.5 22.6
3 59.0 9.7 12.4 9.3 12.0 15.5 18.1 21.3
4 35.6 7.0 7.9 5.4 6.5 8.4 18.1 24.3
5 41.7 6.2 9.8 7.4 7.9 10.1 19.6 27.3
6 26.2 5.6 6.4 4.6 4.5 5.0 15.6 21.8
7 23.6 6.2 5.6 4.5 3.4 3.9 14.4 20.4
8 33.0 7.8 7.5 6.4 5.7 5.4 14.7 21.3
9 21.9 5.4 5.3 3.7 3.3 4.2 15.4 22.5
OP
10 53.6 10.7 12.3 8.0 9.8 12.5 18.0 24.9
11 42.9 9.3 10.3 7.0 7.5 8.7 17.0 23.9
12 57.2 9.7 11.9 9.7 11.3 14.4 19.1 24.2
13 53.8 8.6 11.4 9.5 10.8 13.4 18.4 23.3
14 44.7 8.3 9.8 7.0 8.6 10.9 18.5 24.9
15 46.7 8.8 10.0 8.1 9.4 10.2 18.3 25.8
16 33.7 7.8 7.4 5.8 6.0 6.6 15.6 20.2
17 50.4 9.7 9.3 9.6 10.0 11.6 18.4 24.5
18 47.2 10.2 9.5 9.2 7.3 10.6 17.7 25.2
19 50.5 9.6 10.7 8.7 10.1 11.3 17.7 24.2
20 39.0 8.0 9.0 8.0 6.3 7.5 15.6 20.9
RI
21 27.4 6.0 5.6 4.8 4.7 6.3 17.1 23.0
22 21.6 6.5 5.1 3.5 2.8 3.7 13.8 20.0
23 38.2 7.5 8.8 6.3 6.4 9.1 17.7 23.5
24 26.7 8.8 6.7 3.8 3.7 3.6 13.5 22.7
25 32.1 7.4 7.9 5.9 4.9 5.8 15.9 24.5
MK
26 75.5 10.5 14.1 13.5 14.6 22.2 21.7 27.3
27 61.5 9.5 11.3 10.5 12.0 17.9 20.7 25.1
28 71.3 9.3 12.3 11.2 14.7 23.5 22.6 27.1
29 57.2 9.1 10.1 9.0 10.7 17.9 22.7 29.6
30 38.7 7.8 9.1 5.8 6.6 9.1 17.3 22.3
31 34.1 7.7 8.7 5.1 6.6 5.9 14.3 18.4
LC
32 34.9 9.9 7.5 5.1 6.3 6.0 14.2 18.6
33 42.3 7.9 7.9 6.3 8.1 12.0 18.3 21.0
34 35.6 6.0 6.8 6.0 6.5 10.0 18.6 21.9
[image:24.612.79.550.82.663.2]OVERALL AVERAGE 41.7 8.1 8.8 7.1 7.6 9.9 17.4 23.3
Table 4. Years with ‘at least a great deal’ of capability: % at level 5 or 6, % distribution,
Top Ten Capabilities (duration)
Category Item Capability Description Mean
MK 29 Having a strong brand or image in the market place 22.7
MK 28 Providing customers with value for money 22.6
MK 26 Providing customers with high quality products and services 21.7
MK 27 Pricing products competitively 20.7
HR 5 Training staff in product knowledge 19.6
OP 12 Ensuring stock is on the shelves and available at the right time 19.1
LC 34 Learning from competitors 18.6
OP 14 Communicating with staff 18.5
OP 13 Managing suppliers effectively 18.4
[image:25.612.67.536.84.355.2]OP 17 Solving problems quickly on the shop floor 18.4
Table 4a. Top ten capabilities by mean years with at least a great deal of capability.
Bottom Ten Capabilities (duration)
Category Item Capability Description Mean
RI 24 Providing clear targets for shop floor staff 13.5
RI 22 Providing incentives that motivate staff to improve performance 13.8
LC 32 Implementing new initiatives to improve the business 14.2
MK 31 Advertising and promotions (including visual merchandising) 14.3
HR 7 Thoroughly appraising staff on a regular basis 14.4
HR 8 Identifying and promoting good people 14.7
HR 9 Managing ‘poor performers’ 15.4
HR 6 Developing staff to the best of their abilities 15.6
OP 16 Empowering shop floor staff to take responsibility and make
operational decisions 15.6
OP 20 Using shop floor systems and processes that are clear and
well-understood 15.6
3.3 Do capabilities vary systematically?
3.3.1 Thus far the data have been described as a homogenous set. It is important to investigate whether or not there are any significant patterns of difference within the data. In particular are there differences by:
Size of business (comparing small, medium and larger businesses)
Sub-sector
Whether or not the business is Family-owned
Whether or not the business is British owned (as opposed to foreign owned)
Whether or not the business is owned by a Group
When the business was founded
How long the current ownership structure has been in place
Business Size
3.3.2 The most persistent finding is that there were few significant differences in the levels of capability reported according to business size, and there were no significant differences across any of the capabilities when comparing medium sized and large businesses.
3.3.3 There were however a small number of statistically significant
differences when comparing small businesses with medium and large businesses10.
3.3.4 Thus small retail businesses have a significantly higher level of
capability in ‘Retaining good staff’ (item 3) and ‘Listening to staff’ (item 15) than medium or large businesses surveyed.
3.3.5 Conversely, small businesses reported a significantly lower level of capability in ‘Providing clear targets for staff’ (item 24) versus both other size groups, and ‘Thoroughly appraising staff on a regular basis’ (item 7) versus large businesses only.
Sub-sector
3.3.6 Comparisons here were made across the 6 sub-sectors included in the study. Again, the main finding is that there were few significant
differences in the levels of capability according to sub-sector (see Table 5b, and Table 2 for a definition of each sub-sector).
Category Item
Average Capability Level
S M L Mean SD
HR
1 3.60 3.73 4.02 3.65 1.15
2 4.16 4.22 4.17 4.17 1.03
3 4.81* 4.49* 4.23* 4.71 1.02
4 4.07 4.06 4.18 4.08 1.15
5 4.29 4.23 4.23 4.27 1.05
6 3.96 3.95 4.00 3.96 0.96
7 3.47* 3.72 3.97* 3.55 1.28
8 4.01 4.19 4.16 4.06 1.14
9 3.71 3.79 3.86 3.74 1.12
OP
10 4.62 4.73 4.54 4.64 1.07
11 4.31 4.26 4.29 4.30 1.12
12 4.70 4.63 4.45 4.67 1.01
13 4.64 4.49 4.58 4.61 0.99
14 4.47 4.23 4.22 4.41 1.03
15 4.49* 4.18* 4.09* 4.41 1.05
16 4.09 3.96 3.89 4.05 1.12
17 4.57 4.43 4.25 4.52 1.00
18 4.45 4.47 4.42 4.45 1.06
19 4.56 4.48 4.34 4.53 1.04
20 4.27 4.29 4.17 4.27 1.03
RI
21 3.75 3.74 3.94 3.76 1.28
22 3.51 3.70 3.97 3.58 1.30
23 4.18 4.16 4.28 4.18 1.09
24 3.67* 4.04* 4.27* 3.79 1.29
25 3.95 3.95 4.17 3.96 1.18
MK
26 5.08 5.07 4.88 5.07 0.90
27 4.77 4.77 4.66 4.76 1.05
28 5.02 5.01 4.78 5.00 0.93
29 4.59 4.77 4.86 4.64 1.18
30 4.11 3.94 4.16 4.08 1.34
31 3.87 4.17 4.30 3.96 1.28
LC
32 4.09 4.15 4.21 4.11 1.12
33 4.32 4.31 4.38 4.32 1.07
34 4.09 4.20 4.06 4.11 1.13
[image:27.612.86.485.97.676.2]OVERALL AVERAGE 4.24 4.25 4.26 4.25 1.11 * p < .01
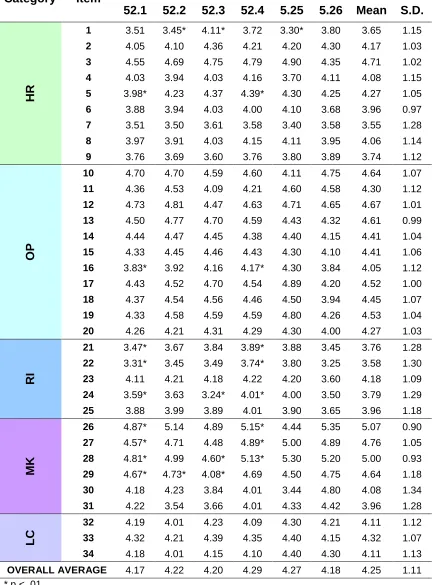
3.3.7 There are however some statistically significant patterns which demonstrate consistent (if small) differences11.
3.3.8 Retailers in sub-sector 52.4 (other retail sale of new goods in specialised stores) achieve a significantly higher level of capability than those in sub-sector 52.1 (retail sale in non-specialised stores) across a range of capabilities. The capability strengths lie in ‘Training staff in product knowledge’ (item 5), ‘Empowering shop floor staff’ (item 16), ‘Providing a good reward package’ (item 21), ‘Providing incentives that motivate staff to improve performance’ (item 22), ‘Providing clear targets for shop floor staff’ (item 24), ‘Providing customers with high quality products and services’ (item 26), ‘Pricing products competitively’ (item 27), and
‘Providing customers with value for money’ (item 28). In terms of trends, 3 of these 8 capabilities belong in Rewards and Incentives and 3 in Marketing.
3.3.9 In a competitive marketplace, retailers which provide a highly tailored, focused offering do (at least to some extent) compete with less
specialised retail entities for customers on like-for-like sales. The pattern of capabilities suggest that retailers in this sub-sector typically develop an empowered, knowledgeable and motivated workforce, which in turn prides itself on providing customers with high quality products and services at competitive prices. Our findings suggest that these highly tailored retailers are more aware of the need to differentiate themselves from the competition through effectively developing and maintaining capability in these areas.
3.3.10 Retail businesses in sub-sector 52.3 (retail sale of pharmaceuticals and medical goods) are rated significantly higher than two other sub-sectors on ‘Attracting strong candidates for job vacancies’ (item 1). However, this sub-sector fared less well in other areas and was rated significantly lower than at least one other sub-sector on ‘Providing clear targets for shop floor staff’ (item 24), ‘Providing customers with value for money’ (item 28), and ‘Having a strong brand in the market place’ (item 29).
3.3.11 Retailers of pharmaceuticals and other medical products fell down on 2 marketing capabilities, most obviously on having a strong brand in the marketplace. This may be linked to increasing consolidation of
pharmaceutical retailers in the UK which has created small number of large retailers in this category which have economies of scale (e.g., in advertising and stock purchases) beyond the reach of smaller retailers. Consequently the small-sized retailers in this category compare
themselves to these large nationwide competitors and rate themselves lower on these capabilities, and because these small businesses
constitute the majority this results in lower average capability ratings. In
Category Item
Average Capability Level
52.1 52.2 52.3 52.4 5.25 5.26 Mean S.D.
HR
1 3.51 3.45* 4.11* 3.72 3.30* 3.80 3.65 1.15
2 4.05 4.10 4.36 4.21 4.20 4.30 4.17 1.03
3 4.55 4.69 4.75 4.79 4.90 4.35 4.71 1.02
4 4.03 3.94 4.03 4.16 3.70 4.11 4.08 1.15
5 3.98* 4.23 4.37 4.39* 4.30 4.25 4.27 1.05
6 3.88 3.94 4.03 4.00 4.10 3.68 3.96 0.97
7 3.51 3.50 3.61 3.58 3.40 3.58 3.55 1.28
8 3.97 3.91 4.03 4.15 4.11 3.95 4.06 1.14
9 3.76 3.69 3.60 3.76 3.80 3.89 3.74 1.12
OP
10 4.70 4.70 4.59 4.60 4.11 4.75 4.64 1.07
11 4.36 4.53 4.09 4.21 4.60 4.58 4.30 1.12
12 4.73 4.81 4.47 4.63 4.71 4.65 4.67 1.01
13 4.50 4.77 4.70 4.59 4.43 4.32 4.61 0.99
14 4.44 4.47 4.45 4.38 4.40 4.15 4.41 1.04
15 4.33 4.45 4.46 4.43 4.30 4.10 4.41 1.06
16 3.83* 3.92 4.16 4.17* 4.30 3.84 4.05 1.12
17 4.43 4.52 4.70 4.54 4.89 4.20 4.52 1.00
18 4.37 4.54 4.56 4.46 4.50 3.94 4.45 1.07
19 4.33 4.58 4.59 4.59 4.80 4.26 4.53 1.04
20 4.26 4.21 4.31 4.29 4.30 4.00 4.27 1.03
RI
21 3.47* 3.67 3.84 3.89* 3.88 3.45 3.76 1.28
22 3.31* 3.45 3.49 3.74* 3.80 3.25 3.58 1.30
23 4.11 4.21 4.18 4.22 4.20 3.60 4.18 1.09
24 3.59* 3.63 3.24* 4.01* 4.00 3.50 3.79 1.29
25 3.88 3.99 3.89 4.01 3.90 3.65 3.96 1.18
MK
26 4.87* 5.14 4.89 5.15* 4.44 5.35 5.07 0.90
27 4.57* 4.71 4.48 4.89* 5.00 4.89 4.76 1.05
28 4.81* 4.99 4.60* 5.13* 5.30 5.20 5.00 0.93
29 4.67* 4.73* 4.08* 4.69 4.50 4.75 4.64 1.18
30 4.18 4.23 3.84 4.01 3.44 4.80 4.08 1.34
31 4.22 3.54 3.66 4.01 4.33 4.42 3.96 1.28
LC
32 4.19 4.01 4.23 4.09 4.30 4.21 4.11 1.12
33 4.32 4.21 4.39 4.35 4.40 4.15 4.32 1.07
34 4.18 4.01 4.15 4.10 4.40 4.30 4.11 1.13
[image:29.612.86.519.98.683.2]OVERALL AVERAGE 4.17 4.22 4.20 4.29 4.27 4.18 4.25 1.11 * p < .01
terms of attracting stronger candidates than businesses in certain other sub-sectors, this may be due to the requirement of certain qualifications for pharmaceutical roles.
Ownership and business age
3.3.12 Examining patterns in ownership, the averages across each capability item are presented in Table 5c. Again the strongest pattern is that there are few significant differences between the different categories,
indicating that capabilities in general are not different for different types of ownership. Nevertheless a small number of statistically significant differences can be observed12.
3.3.13 In terms of Nationality of ownership (columns 1 and 2), British-owned businesses reported higher capability in ‘Retaining good staff’ (item 3) than foreign-owned businesses. Conversely, foreign-owned businesses reported higher capability in ‘Providing clear targets for shop floor staff’ (item 24).
3.3.14 Further information would be required to be able to understand and explain the reasons for these differences.
3.3.15 Turning to the differences between Family-owned vs. Non Family-owned businesses (as reported in columns 3 and 4) it is apparent that the former report significantly higher capability at 'Listening to staff’ (item 15) than non-family owned businesses, although when business size is accounted for this relationship becomes insignificant (i.e. the meaningful difference relates to business size). Conversely, family-owned
businesses reported lower capability at ‘Providing clear targets for shop floor staff’ (item 24, to a lesser extent business size accounts for this relationship also). This pattern of findings is not surprising. Family-owned businesses tend to be smaller organisations, and both of these observations replicate those seen between small organisations and those which are greater in size. It may be too that family-owned businesses are less formal and bureaucratised, and thereby rely on informal methods of managing their staff.
3.3.16 Data comparing Group-owned retailers from non-Group owned are presented in columns 5 and 6. Group-owned retailers reported higher levels of ‘Providing clear targets for shop floor staff’ (item 24) and ‘Advertising and promotions’ (item 31) than non-group owned
businesses. These results make sense in that businesses which are part of a group tend to be larger and have the benefit of shared services providing specialist advice and support on how to effectively manage
Average Capability Level
Capabilities British VS
Foreign
Family VS
Non Group VS Non Overall
Category Item British Foreign Family
Non-family Group
Non-Group Mean SD
H
R
1 3.66 3.65 3.62 3.76 3.63 3.66 3.65 1.15
2 4.17 4.08 4.17 4.16 4.25 4.15 4.17 1.03
3 4.74* 4.27* 4.75 4.63 4.64 4.74 4.71 1.02
4 4.06 4.40 4.07 4.10 4.08 4.08 4.08 1.15
5 4.27 4.38 4.27 4.27 4.14 4.31 4.27 1.05
6 3.96 4.02 3.96 3.96 3.98 3.96 3.96 0.96
7 3.55 3.65 3.53 3.63 3.63 3.53 3.55 1.28
8 4.06 3.94 4.05 4.07 4.14 4.04 4.06 1.14
9 3.72 4.10 3.69 3.88 3.86 3.71 3.74 1.12
OP
10 4.64 4.72 4.68 4.54 4.67 4.63 4.64 1.07
11 4.28 4.63 4.29 4.33 4.26 4.31 4.30 1.12
12 4.67 4.77 4.72 4.54 4.66 4.68 4.67 1.01
13 4.61 4.60 4.62 4.56 4.62 4.61 4.61 0.99
14 4.40 4.49 4.42 4.37 4.36 4.42 4.41 1.03
15 4.40 4.41 4.46* 4.26* 4.36 4.42 4.41 1.05
16 4.03 4.29 4.01 4.15 4.07 4.05 4.05 1.12
17 4.51 4.71 4.54 4.47 4.54 4.52 4.52 1.00
18 4.45 4.51 4.45 4.47 4.46 4.45 4.45 1.06
19 4.54 4.33 4.55 4.47 4.39 4.57 4.53 1.04
20 4.26 4.22 4.26 4.28 4.29 4.26 4.27 1.03
RI
21 3.76 3.63 3.79 3.67 3.70 3.77 3.76 1.28
22 3.58 3.56 3.57 3.60 3.53 3.59 3.58 1.30
23 4.18 4.35 4.19 4.16 4.17 4.19 4.18 1.09
24 3.76* 4.29* 3.71* 4.00* 4.02* 3.72* 3.79 1.29
25 3.95 4.12 3.94 4.01 4.00 3.95 3.96 1.18
MK
26 5.06 5.16 5.08 5.03 5.03 5.09 5.07 0.90
27 4.76 4.87 4.82 4.63 4.68 4.79 4.76 1.05
28 5.01 4.83 5.04 4.89 4.86 5.04 5.00 0.93
29 4.65 4.53 4.66 4.61 4.71 4.63 4.64 1.18
30 4.06 4.46 4.08 4.07 4.05 4.09 4.08 1.34
31 3.94 4.22 3.96 3.95 4.25* 3.88* 3.96 1.28
LC
32 4.11 4.28 4.11 4.10 4.12 4.11 4.11 1.12
33 4.32 4.36 4.32 4.32 4.35 4.31 4.32 1.07
34 4.10 4.32 4.11 4.13 4.15 4.10 4.11 1.13
[image:31.612.75.532.80.681.2]OVERALL AVERAGE 4.24 4.33 4.25 4.24 4.25 4.25 4.25 1.11 * p < .01
large volumes of staff (i.e., using targets). Being part of a group is likely to offer benefits in advertising and promotions.
3.3.17 A small number of significant patterns exist between the age of a business and capability levels. Younger businesses reported slightly higher levels of capability in ‘Attracting strong candidates for job
vacancies’ (item 1), ‘Managing poor performers’ (item 9), ‘Praising and encouraging staff’ (item 23), and ‘Providing leadership throughout the business’ (item 33). No significant13
patterns were found between capability levels and the year a business started operating under its current ownership. These findings suggest that younger retailers have developed strengths in these areas to a higher level more quickly than older retailers, and these patterns are unrelated to how long the
ownership structure has been in place.
3.3.18 Summary
In general the levels of reported capabilities do not vary systematically by size of business, by sub-sector, by pattern of ownership, or by how long the business or current ownership structure has been in operation.
There are however small numbers of capabilities which display significant differences by size, sub-sector, type or duration of current ownership, or business age.
In terms of business size, a small number of capability differences exist between small retailers and medium or large (i.e. no differences
between medium and large).
Small businesses reported relatively high levels for ‘Retaining good staff’ and ‘Listening to staff’, and lower levels for ‘Providing clear targets for staff’ and ‘Thoroughly appraising staff on a regular basis’.
One possible explanation is that smaller businesses find it easier to utilise relatively informal ways of managing their staff.
Retailers in sub-sector 52.4 (other retail sale of new goods in specialised stores) achieve a significantly higher level of capability than those in sub-sector 52.1 (retail sale in non-specialised stores) across 8 capabilities, largely from Rewards and Incentives and also from Marketing. This finding suggests these highly tailored retailers differentiate themselves from non-specialised competition in these capability areas.
Retail businesses in sub-sector 52.3 (retail sale of pharmaceuticals and medical goods) displayed differences on four capabilities, most notably relatively low levels on two marketing capabilities.
British-owned businesses reported higher capability in ‘Retaining good staff’, and lower capability in ‘Providing clear targets for shop floor staff’, than foreign-owned businesses.
Family-owned businesses reported higher capability at ‘Listening to staff’, and lower capability at ‘Providing clear targets for shop floor staff’, than non-family owned businesses. Family-owned businesses tend to be smaller organisations, and both of these observations replicate those observed between small organisations and those greater in size.
Group-owned retailers reported higher levels of ‘Providing clear targets for shop floor staff’ and ‘Advertising and promotions’ than non-group owned businesses. These results make sense because groups of businesses tend to have economies of scale in terms of establishing workers’ targets and (where there is a shared brand) advertising costs.
Younger businesses reported capability strengths in ‘Attracting strong candidates for job vacancies’ (item 1), ‘Managing poor performers’ (item 9), ‘Praising and encouraging staff’ (item 23), and ‘Providing leadership throughout the business’ (item 33). No significant14
patterns were found between capability levels and the year a business started operating under its current ownership. These findings suggest that younger retailers have developed strengths in these areas to a higher level more quickly than older retailers, and these patterns are unrelated to how long the ownership structure has been in place.
3.4 Are the capabilities themselves inter-related?
3.4.1 There are two issues of interest here. First, do businesses who report themselves strong in one area, also in general report themselves to be strong in other areas? Thus, are there well managed businesses strong across many areas, and indeed less well managed businesses? And second, within the 5 areas of capability defined for this study, do the issues tend to inter-relate? Thus, for example, do the issues under the label Human Resources tend to go together so that they can
meaningfully be combined as a set (or factor)?
3.4.2 Further statistical tests are required but at this stage it appears that businesses that report themselves as strong in some capabilities also tend to report themselves as strong on others. This may reflect 2 alternative underlying explanations. First it could well be that
businesses that are strong and well managed in some areas do also tend to be strong and well managed in other areas. Or second, it could be a positive reporting bias, whereby some respondents tend to be more generally positive, whilst others are more generally negative regarding their levels of capability.
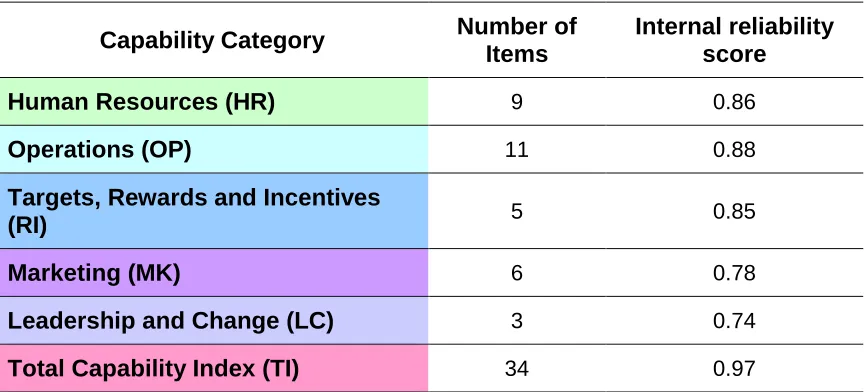
Capability Category Number of Items
Internal reliability score Human Resources (HR) 9 0.86
Operations (OP) 11 0.88
Targets, Rewards and Incentives
(RI) 5 0.85
Marketing (MK) 6 0.78
Leadership and Change (LC) 3 0.74
[image:34.612.96.530.85.281.2]Total Capability Index (TI) 34 0.97
Table 6. Internal reliability of each capability category.
3.4.3 Regarding the relations across the 5 sets of capabilities, initial statistical tests are mixed and continuing. However, the data in Table 6 above shows that when the individual 34 capability items are grouped into the 5 areas as initially would be expected (for example that items 1 to 9 are grouped under the heading of Human Resources), then these groupings do reach an acceptable level of statistical reliability. In simple terms these tests measure the extent to which a set of questions form a consistent grouping. In this test an acceptable score for reliability must be > 0.7, as is the case for each of the 5 areas of Capability (see Table 6). This means that, for example, each of the 9 HR capability questions measure similar capabilities.
3.4.4 Finally, all of the 34 capabilities were grouped into a single overall measure. Toward the bottom of Table 6 we can see that when we combine the 34 capabilities into a single Total Capability Index (TI) the internal reliability score is statistically acceptable (> 0.7).
3.4.5 Summary
Initial statistical tests do suggest that the Capabilities are inter-related.
This may be because businesses strong in one area also tend to be strong in others perhaps reflecting an underlying overall management capability.
Or this inter-relationship may reflect, at least in part, a positive bias when answering questions of this kind.
The same arguments apply for those reporting themselves less capable in certain areas.
Statistical evidence also supports the validity of combining all 5 capability categories into a single Total Capability Index.
3.5 Do the capabilities correlate with productivity?
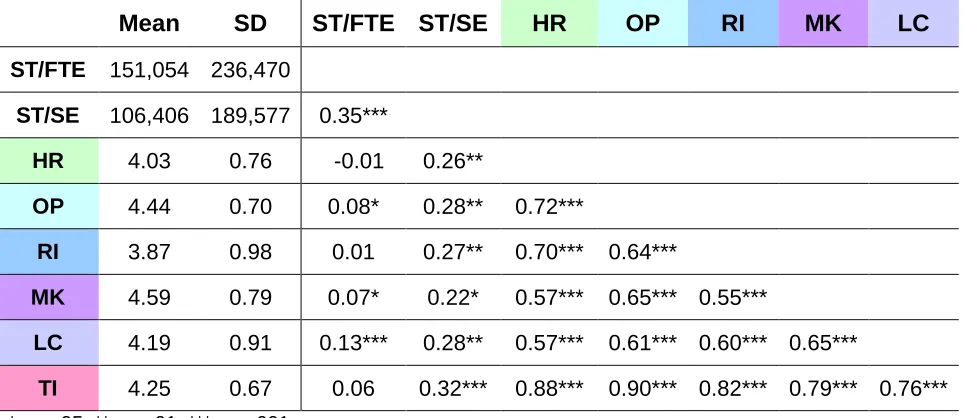
3.5.1 In the survey retailers were asked a small number of questions about the performance of their business. In particular respondents were asked to provide information on their sales turnover for the most recent financial year, along with the numbers of Full-time Equivalent staff employed. These data enabled the researchers to compute the Sales Turnover per Full Time Equivalent (ST/FTE) used as a straightforward index of Labour Productivity.
3.5.2 In addition, data were collected from independent financial reports for as many of the 1,000 responding businesses as possible and for the most recently completed financial period, which proved to be for 2006. Of most interest here were data on Labour Productivity for 2006 which involved an index of Sales Turnover/ Staff Employed (ST/SE).
3.5.3 This enabled the researchers to match the self-report capability data from the survey, with the self-report performance data from the survey (in particular the ST/FTE), and with the financial data for each business gathered from independent sources (in particular the ST/SE).
3.5.4 Correlations were computed relating the scores on each capability with both the self-reported productivity data (ST/FTE) and the independent financial data (ST/SE). In addition, the researchers have grouped the 34 capabilities into 5 categories, namely Human Resources, Operations, Rewards and Incentives, Marketing, and Leadership and Change. The justification for these groupings is given in Section 3.4 above. The correlations15 between these variables are shown in Table 7.
3.5.5 The pattern of findings is clear:
First, the self-report and the independent productivity data are
significantly related though by no means a perfect fit (r =.35***). This is as one would expect.
Second, the 5 sets of capabilities are themselves significantly inter-correlated, and again this would be expected.
Thirdly, looking at the correlations with self-reported Sales Turnover per FTE, it is apparent 3 sets of capabilities (Leadership and Change, Operations and Marketing) are significantly positively related. However
15 One-tailed statistical tests were conducted because we predict a positive relationship between