http://wrap.warwick.ac.uk
Original citation:
Jarvis, Stephen A., 1970-, Foley, B. P., Isitt, P. J., Spooner, Daniel P., Rueckert, D. and
Nudd, G. R. (2008) Performance prediction for a code with data-dependent runtimes. In:
4th UK e-Science All Hands Meeting (AHM 2005), Nottingham, England, 19-22 Sep
2005. Published in: Concurrency and Computation: Practice & Experience, Volume 20
(Number 3). pp. 195-206.
Permanent WRAP url:
http://wrap.warwick.ac.uk/30430
Copyright and reuse:
The Warwick Research Archive Portal (WRAP) makes this work by researchers of the
University of Warwick available open access under the following conditions. Copyright ©
and all moral rights to the version of the paper presented here belong to the individual
author(s) and/or other copyright owners. To the extent reasonable and practicable the
material made available in WRAP has been checked for eligibility before being made
available.
Copies of full items can be used for personal research or study, educational, or not-for
profit purposes without prior permission or charge. Provided that the authors, title and
full bibliographic details are credited, a hyperlink and/or URL is given for the original
metadata page and the content is not changed in any way.
Publisher’s statement:
"This is the pre-peer reviewed version of the following article: Jarvis, Stephen A., 1970-,
Foley, B. P., Isitt, P. J., Spooner, Daniel P., Rueckert, D. and Nudd, G. R. (2008)
Performance prediction for a code with data-dependent runtimes. Concurrency and
Computation: Practice & Experience, Volume 20 (Number 3). pp. 195-206., which has
been published in final form at
http://onlinelibrary.wiley.com/doi/10.1002/cpe.1191/abstract
.
A note on versions:
The version presented here may differ from the published version or, version of record, if
you wish to cite this item you are advised to consult the publisher’s version. Please see
the ‘permanent WRAP url’ above for details on accessing the published version and note
that access may require a subscription.
Performance Prediction for a Code with Data-dependant
Runtimes
B. P. Foley
∗D. P. Spooner
P. J. Isitt
S. A. Jarvis
G. R. Nudd
Dept. of Computer Science, University of Warwick, Coventry, CV4 7AL, UK
Abstract
In this paper we present a preliminary predictive model for a key biomedical imaging application in the UK e-Science IXI (Information eXtraction from Images) project [1]. This code represents a significant challenge for our existing performance prediction tools as it has internal structures that exhibit highly variable runtimes depending on qualities in the input data provided. Since the runtime can vary by more than an order of magnitude, it has been difficult to apply meaningful quality of service criteria to workflows that use this code. The model developed here is used in the context of an interactive scheduling system which provides rapid feedback to the users, allowing them to tailor their workloads to available resources, or to allocate extra resources to scheduled workloads.
1
Introduction
For grid applications to function efficiently, they rely on middleware services to manage resources and allocate them to tasks amongst variable and unpredictable application workloads. Tools that measure the performance of various resources and estimate the runtimes of tasks on these resources can provide essential data that enable Grid sched-ulers to perform more efficient task scheduling, and make it possible to deliver sustainable Qual-ities of Service.
Previous performance work at Warwick has fo-cused on performance prediction with a tool called PACE [2] and an adaptable scheduling system called TITAN [3]. The PACE tools assist the user in generating analytical performance models that can account for the computations, network com-munications and cache utilisation of an applica-tion. The evaluation of these models allows the performance and scalability of parallel applica-tions to be estimated on different architectures. TI-TAN is a scheduler that creates schedules from groups of workflows by allocating them to nodes on the local cluster and by using a genetic algo-rithm continually refines that schedule. The ge-netic algorithm is aware of QoS requirements for a workflow and its adaptive nature allows it to re-spond to changes in resource availability almost
in-∗High Performance Systems Group, Dept. of Computer
Sci-ence, University of Warwick, Coventry. Email: {bfoley, dps, pji}@dcs.warwick.ac.uk
stantly.
Here, we describe two improvements to this sys-tem. The first is a demonstration of how PACE models can be extended to cope with applications whose runtime varies significantly depending on the kind of data provided. The application used for this isnreg, a tool developed as part of a UK e-Science medical imaging project. This IXI project [1] demonstrates how grid-computing technologies can be used to enable large scale image processing and medical image analysis. Connectors in IXI’s workflow manager can submit jobs to dedicated clusters, Condor-managed workstations, or to the National Grid Service.
2
nreg
Image Registration
nregis a medical imaging tool [4] used to per-form non-rigid registration on pairs of 3-D MRI scans. It differs from other registration algorithms in that it uses a mesh of B-splines to capture both local deformation and global motion between the two images and its similarity measure is based on normalised mutual information which allows it to align images from different MRI modalities such as CT, MR and PET. It has been shown to be highly effective at compensating for misregistra-tion in breast MR images and for isolating tumour growth for visualisation purposes.
The use of B-splines has desirable numerical attributes, including smoothness, continuity, and the property that moving a control point only af-fects the transformation in the local neighbourhood of the control point, making it computationally tractable to use large numbers of points.
2.1
The algorithm
The core of the algorithm is a gradient descent op-timisation with thousands of degrees of freedom (three for each control point). The algorithm fits a uniform mesh of control points onto the 3-D im-age. A function calledEvaluateDerivative
is called for each control point to experimentally move them by a fixed step-size in the x, y and
zaxes, and measure the effect of this motion on the transformation using a fitness function. If there is an improvement, the best set of motions is kept. This process is controlled by a function calledEvaluateGradientand if it judges that there is sufficient overall improvement (ie we are on a sufficiently steep path in our multidimensional space), the fitting process is repeated for another it-eration.
When the fitting yields little or no improvement over the previous results, the process of iteration is stopped, the step-size is halved and a new round of fitting is performed. Once the step-size reaches a certain threshold, significant improvements in the fitness of the transformation are unlikely to occur and the optimisation is halted.
To account for global motion as well as local de-formations, this entire optimisation process is pe-formed at several different image resolutions, start-ing with a low resolution image and repeatedly doubling the image resolution. After each optimi-sation, the number of points in the mesh is doubled in each dimension and a B-spline subdivision algo-rithm is used to insert the new points.
The fitness function consists of two components: the first imposes some costs on the transformations
to make sure they are well formed. For example, one cost encourages smoother transformations by calculating a 3-D analogue of an equation that de-scribes the bending energy of a thin sheet. Trans-formations that require more bending energy (and are therefore have more local irregularities), are pe-nalised.
The second component is a technique for mea-suring the similarity between two images. It cal-culates the normalised mutual information of the two images, a statistical measure from information theory that quantifies how much information one image contains about the second.
2.2
Computational Costs
The runtime ofnregis limited by the speed of the CPU and main memory. Upon initialisationnreg
reads two image files into main memory and con-structs the set of subsampled images that are used later in the registration process. For images that take a long time to register this setup phase takes a negligible amount of the total runtime. Other than these reads and the final write of the transformation to an output file no disk I/O occurs.
Several factors account for the bulk of the the runtime ofnreg:
1. All else being equal, the runtime is propor-tional to the number of voxels in the target image.
2. All else being equal, the runtime is propor-tional to the number of control points in the transformation mesh (i.e., the number of calls
toEvaluateDerivativeper iteration).
3. All else being equal, the runtime is propor-tional to the number of iterations of the fitting function (EvaluateGradient).
4. For each call of EvaluateDerivative, there is a fixed cost of computing and then clearing the overall normalised mutual infor-mation statistics. This cost is proportional to the number of control points.
5. For each call of EvaluateDerivative, there is a highly variable cost associated with gathering the statistics relating the trans-formed source.
The first two factors are predictable and can be reduced to simple analytical expressions.
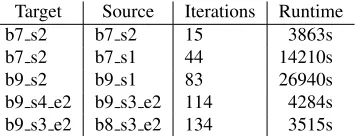
Target Source Iterations Runtime
b7 s2 b7 s2 15 3863s
b7 s2 b7 s1 44 14210s
b9 s2 b9 s1 83 26940s
[image:4.612.112.290.75.143.2]b9 s4 e2 b9 s3 e2 114 4284s b9 s3 e2 b8 s3 e2 134 3515s
Table 1:EvaluateGradientiterations
runtime, this effect can often be occluded by other factors.
Factor4 exhibits some variance depending on the input images, but it is several times less than the large differences in runtime in table1. In fact, the bulk of the variation comes from factor5.
Table2was generated by running a number of sample registrations under the profiling simulator callgrind [5]. Callgrind uses an x86 CPU emu-lator to execute user processes and accounts for the number of CPU cycles spent waiting for mem-ory accesses by simulating the behaviour of the first and second level caches. The table shows that while the cost of calculating the statistics is quite stable, the cost of gathering the image statistics from the results of moving a control point is highly variable: in some images it dom-inates the runtime, for other images it is a much smaller factor. The table shows only average costs across the entire execution of the program, but when parallelisingnregwe found that the cost of
EvaluateDerivativevaries widely from one
control point to another.
2.3
Parallelisation
Since the runtime ofnregcan be extensive (tens of hours), it may be desirable to have a parallel version ofnreg. Despite the inefficiencies intro-duced by parallelisation overheads, it can improve turnaround and resource utilisation in cases where a user has many free machines and wishes to per-form small registration workflows. Depending on the requirements of a workflow, a mix of sequen-tial and parallel tasks can provide the best overall use of the system.
The processing performed by nreg as de-scribed in the previous section is almost entirely CPU and memory bound, and this lack of I/O re-moves one potential barrier to a scalable paralleli-sation. On the other hand, the internal workings ofnreg’s algorithm appear less amenable to par-allelisation: they involve an unknown number of iterations of mesh transformation, each dependant on the last. Furthermore this occurs at several dif-ferent step-sizes and resolutions.
However, the amount of work done inside each
Target Source Gather NMI eval/clr b7 s2 b7 s2 721kc/iter 244kc/iter b7 s2 b7 s1 816kc/iter 254kc/iter b9 s2 b9 s1 945kc/iter 282kc/iter b9 s4 e2 b9 s3 e2 99kc/iter 246kc/iter b9 s3 e2 b8 s3 e2 93kc/iter 286kc/iter
Table 2:EvaluateDerivativecosts
iteration is substantial. It involves the experimen-tal movement of thousands of control points and, as observed before, the use of B-splines means that the movement of control points only affects voxels in the vicinity of those control points. The effect of each of these movements can be calculated in-dependently and thus in parallel with all the rest. The simplest parallel decomposition would involve dividing the work into N equal pieces and hand-ing one to each CPU. This decomposition is sim-ple and needs no communications to arrange, but is inefficient on hetrogenous systems or systems with varying load: the overall runtime is limited by the speed of the slowest CPU. Also our analysis has shown that the variable cost of gathering the image statistics means different amounts of work occur per candidate move, making it impossible to stat-ically divide up the workload into equal chunks. This leads us to our current parallelisation tech-nique: a simple master/slave decomposition of the workload. Approximately 95% of the application’s runtime is spent in a very small portion of the code. The remainder of the code runs identically and in lockstep on each CPU. When they reach the inner transform fitting iteration, one CPU (the master), hands out small packets of work to each of the slave CPUs in turn. This work involves comput-ing the effect of movcomput-ing a small number of control points. When this work is completed, the results are passed back and more work is received. When all the movements for an iteration have been com-pleted, the master distributes all the results to all the CPUs. Then every CPU returns to ‘lockstep mode’, executing the same code as every other un-til they enter the next iteration.
[image:4.612.316.510.75.144.2]CPUs Runtime Speedup 1 58320s 1.00x 2 31895s 1.83x 4 19340s 3.02x 8 14045s 4.15x 16 9625s 6.06x
Table 3: Parallel scaling ofnreg
3
Predictive model
The workflows that TITAN can currently support for IXI includenregand two other codes - BET [6] and FAST [7]. These pre-process input images for use withnregand perform a fixed amount of per-voxel work that is directly related to the in-put parameters and size of the inin-put image. They can be analysed using PACE tools and analytical expressions for each are readily formed. Perfor-mance tests reveal that these models yield a high level of predictive accuracy, with the relative error of predicted vs. measured execution time typically less than 10%.
Thenregmodel is less straight-forward. The program has been emperically described as ‘unpre-dictable’ in that the execution time varies widely. This variation is caused partly by the variation in the number of mesh fitting iterations that occur and partly because of the variable amount of work re-quired to calculate the improvement generated by moving each point. In some execution scenarios, there are a large number of very fast iterations of
EvaluateGradient. In other scenarios, the
routine is called far less frequently, but the runtime is also much slower. From source code analysis, study of the internal data structures and analysis of profiling traces, it is apparent that the execu-tion time ofnregcorrelates most strongly with the choice of ‘target’ image. This is the second of the two input images and is the image that the first image (the source) is registered against. The sensi-tivity to the target image is dramatic and can effect the overall execution time by an order of magni-tude.
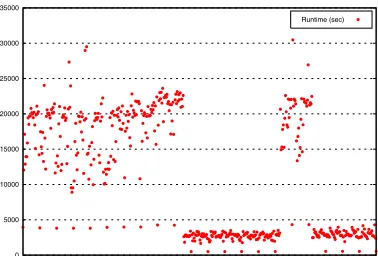
Figure1illustrates the variability in the overall runtime and Table1shows the number of iterations that can occur for different images and how it may affect runtime. The difficulty in predicting the ex-ecution time fornregis related to anticipating, a priori, how many iterations will occur and their overall costs.
3.1
Pre-model work parameter
Despite the variations in runtime, we have identi-fied fourclassesof execution behaviour. The steps
0 5000 10000 15000 20000 25000 30000 35000
Runtime (sec)
Fig. 1: Runtime variation for different images
between these classes are significant - an average ‘low’ class will run for 2500s on a 2.8GHz P4 ar-chitecture, while an average ‘high’ class will run for 18000s on the same machine. TITAN is able to compensate when tasks complete earlier than expected (see below) or over-run – so it was felt that, initially, it was sufficient to attempt to iden-tify which class the execution belonged to.
One approach to estimating the runtime is to pre-process the destination image to distinguish whether it is likely to cause more (or less) work than other images. Earlier work on PACE ad-dressed a related problem where a data-dependent application, a lossless video compressor, per-formed an inexpensive initial scan over the data to identify potential features that would affect the runtime [8]. The result of this analysis yielded a model parameter than could be used by PACE’s evaluation engine. Unfortunately, while some statistics such as intensity variations or various in-formation theoretic properties can be found in the MRI scans, these do not (directly) reveal the effect the image has on the gradient descent solver.
Static analysis of the code revealed that while data sensitivity is significant, the program’s run-time is also related to the size of the input image and the number of control points used. If the image has smaller physical dimensions (or is of a lower resolution), there is less work to do. This feature can be exploited by using nregitself to gener-ate the pre-model parameter. Running the program with a subsampled version of the image, it is pos-sible to obtain an indicator of execution time and classify which band the image will fit into.
[image:5.612.138.260.74.144.2]0.02 0.04 0.08 0.16 0.32 0.64
[image:6.612.107.296.76.199.2]Subsampled by 2 Subsampled by 2 (perfect scaling) Subsampled by 4 Subsampled by 4 (perfect scaling)
Fig. 2: Runtime scaling with subsampled images
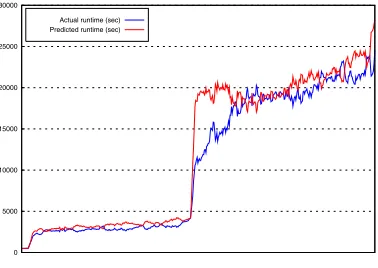
subsampled images. The lowest task-time is by a ‘self-registration,’ that is a registration of an image with itself. This causes the lowest number of itera-tions ofEvaluateGradient, causing the min-imum amount work required for a registration in this class. Conversely, a ‘bad brain’ image, which has been empirically found, is much more diffi-cult to correlate and exercises the code closer to the limits of each iteration. Using these upper and lower bounds on the execution time it is possible, by subsampling an image, to hugely shorten the runtime but still keep the salient features of the im-age. When compared with the subsampled worst case registration and subsampled self-registration it is straightforward to identify a candidate work-load parameter. Figure3shows how effective this performance prediction technique can be.
0 5000 10000 15000 20000 25000 30000
Actual runtime (sec) Predicted runtime (sec)
Fig. 3: Predicted runtimes
With this technique predictions of the overall runtime can be made at the cost of performing one self-registration using a subsampled version of the target registered against itself and one registration with subsampled versions of the source and tar-get images. It has been found that subsampling in each axis by a factor of 4 provides good results, although it may be possible to subsample further without sacrificing accuracy. Furthermore, it is a simple matter to cache the results of each of these
performance predictions. One typical use pattern ofnregis to register several images against the one reference image and, in this case, the reference self-registration only needs to be predicted once. Withspeculativeexecution, as described below, it is likely that users will add, and then remove, regis-trations with very long runtimes from their specu-lative schedules many times, further increasing the hit-rate of the cache.
Once an expectation of runtime is available, TI-TAN can manoeuvre the workflows as appropri-ate. Workflows are constructed using an applet-based graphical composition tool that communi-cates with the TITAN service for submission and monitoring of the workflows.
4
TITAN workflow scheduling
TITAN is a multi-cluster scheduling system that uses a rapid genetic algorithm to create schedules in real-time. The operation of the scheduler is de-scribed in [3]. More recently, the ability to sched-ule workflows has been added by allowing depen-dencies to be considered across a process flow [9]. Given an expectation of execution time TITAN is able to build a series of schedules and evaluate their suitability according to a fitness function that can take multiple criteria into account.
In this work, several new features have been added that allow a degree of interaction with the user. This uses features already present in TITAN that were previously not directly available to the user. An improved front-end has been written that allows workflows to be constructed, submitted for execution, and monitored. This resembles many other DAG construction editors, but with the dif-ference that these components represent the per-formance models not the applications themselves. As a result of this, the user can interactively deter-mine the resources requirements of the workflow and verify if it can be run within the desired time-frame. In practice, rather than requiring ‘yet an-other workflow editor’, it is more likely that the services that TITAN exposes would be connected to the end user’s preferred DAG tool. The IXI project has a custom workflow builder, the IXI Workbench [10] and it is planned that TITAN will be integrated with this.
[image:6.612.107.296.439.573.2]work-flow incrementally, and each component will pro-vide an indication of the CPU time required and the scalability of the component. Currently, the front-end assumes that each of these applications will have an associated performance model. This is not an assumption that TITAN requires – indeed, the scheduler can work around tasks in the queue that do not have such a performance model.
Once the workflow has been assembled, it can be submitted to the scheduler, and it is possible to do thisspeculatively. Speculative tasks are scheduled like other tasks, but have the lowest possible prior-ity and are marked as tasks that are never to be exe-cuted. Tasks with a higher priority will ‘jump over’ these tasks if they block the scheduling queue, de-pending on the weight attached to deadline.
An accurate runtime estimation for an entire workflow cannot be obtained using only perfor-mance data for each task in the workflow: the only information this provides is how much CPU time is required by a task and how well it scales. Since the decision of how best to allocate CPUs to a spe-cific task can only be made by examining both the workflow and other workflows in the schedule, pre-dictions from the performance models need to be evaluated in the context of a complete schedule.
By speculatively submitting a workflow, the scheduler is able to optimise the schedule for the entire workflow by exploring the mapping of sub-tasks to available hosts. The schedule returned from a speculative workflow provides an accurate runtime prediction for the entire workflow with op-timal selection of the number of hosts each sub-task will run on.
5
Related work
There are a number of Grid projects that con-tain workflow composition tools including myGrid [11], Geodise [12], IXI [1], CAT [13], and Grid-Service-in-a-Box [14]. The myGrid project is a toolkit of components for forming, executing, and managing experiments in bioinformatics. One of these components, the Taverna workbench [15], is a graphical tool for building and executing work-flows composed of local or remote web services and Java applications. The Composition Analysis Tool (CAT) enables the formulation of workflows for scientific computations and business-related web services. Semantic data associated with indi-vidual steps and links allows the system to anal-yse and verify workflows in order to help users compose complete and consistent workflows. The Grid-Service-in-a-Box (GSiB) project provides vi-sual interfaces to a suite of tools for creating, de-ploying, managing, using, and querying Grid
ser-vices. In addition, GSiB provides a service client with tools for creating service-based composite ap-plications by drawing their workflow.
The IXI project have developed a tool, the IXI Workbench, which provides a web-based inter-face tonreg. The IXI Workbench consists of a database used for intermediate storage of images and web pages providing search and update capa-bilities geared towards atlas generation. The IXI Workbench is used in a medical domain, so the
provenanceof an image and an audit trail of the tools used to process it is of particular importance. The Geodise project aims to build up a service oriented computing environment for engineers to perform complicated computations in a distributed system. A component of the Geodise project is their Workflow Construction Environment (WCE), a graphical workflow editor written in Java, used mainly for workflow construction and runtime job management [16]. Geodise has a ‘workflow advi-sor’ which, by using a set of ontologies, guides the user in workflow construction and in selecting and configuring the appropriate components.
These projects are similar in concept to the workflow composition front-end described in this paper in that they aim to simplfy the creation of complex workflows by providing graphical tools for their construction. However, these projects lack the integration between the workflow compo-sition front-end and workflow execution environ-ment provided by the platform described here. The tight integration between TITAN PACE and the workflow composition end enables the front-end to provide an estimated execution time for each subtask within a workflow and an execution time prediction for the entire flow. This prediction data is made immediately visible to the user allowing them to interactively determine how modifications they make to a workflow impact its execution time. For applications such asnregwhose execution time can vary greatly for different input data, the ability to understand the implications of executing tasks in a given configuration prior to executing a workflow can provide significant advantages.
6
Conclusions
the execution time of this application is particularly difficult as the execution time is highly dependent on the input data.
The application’s algorithm is described; its run-time behaviour is analysed using profiling and source code analysis; a simple parallel implemen-tation is developed; and heuristics for estimating the runtime of the application based on timings ex-tracted from the registration of subsampled images are explored.
Also a workflow composition front-end and workflow scheduling system are presented. The benefits to the end-user of tight integration be-tween an interactive workflow environment, per-formance prediction, and speculative scheduling are outlined.
Future work will involve a more detailed mod-elling ofnreg´s performance in concert with more fine-grained benchmarking of subsampled image registration. It is envisaged that this scheduling and prediction work will be integrated into the IXI Workbench in the near future.
7
Acknowledgements
The authors would like to express our gratitude to Daniel R¨uckert and Derek Hill of the IXI project who provided us with valuable insights into the
nregcode and the IXI Workbench system. This work is sponsored in part by funding from the EPSRC e-Science Core Programme (contract no. GR/S03058/01), the NASA AMES Research Centres (administered by USARDSG, contract no. N68171-01-C-9012) and the EPSRC (contract no. GR/R47424/01).
References
[1] R. A. Heckemann, T. Hartkens, K. K. Le-ung, Y. Zheng, D. L. G. Hill, J. V. Hajnal, D. Rueckert. Information Extraction from Medi-cal Images: Developing an e-Science Applica-tion Based on the Globus Toolkit.Proceedings of the 2nd UK e-Science All Hands Meeting, 2003.
[2] G.R. Nudd, D.J. Kerbyson, E. Papaefstathiou, J.S. Harper, S.C. Perry, D.V. Wilcox. PACE: A Toolset for the Performance Prediction of Par-allel and Distributed Systems.Int. J. of High Performance Computing Applications, Special Issues on Performance Modelling, 14(3):228-251, 2000.
[3] D.P. Spooner, S.A. Jarvis, J. Cao, S. Saini, G.R. Nudd. Local Grid Scheduling
Tech-niques using Performance Prediction. IEE Proc. Comp. Dig. Tech., 15(2):87-96, 2003. [4] D. Rueckert, L. I. Sonoda, C. Hayes, D. L.
G. Hill, M. O. Leach, D. J. Hawkes. Non-rigid Registration Using Free-Form Deforma-tions: Application to Breast MR Images.IEEE Transactions on Medical Imaging, 18(8):712-721, August 1999.
[5] http://kcachegrind.sf.net/
[6] S. M. Smith. Fast Robust Automated Brain Ex-traction. Human Brain Mapping, 17(3):143-155, November 2002.
[7] Y. Zhang, M. Brady, S. Smith. Segmentation of Brain MR Images Through a Hidden Markov Random Field Model and the Expectation Maximization Algorithm.IEEE Transactiosn on Medical Imaging, 20(1):45-57, 2001. [8] J. D. Turner, R. Lopez-Hernandez, D. J.
Ker-byson, G. R. Nudd. Performance Optimisation of a Lossless Compression Algorithm using the PACE Toolkit.University of Warwick Re-search Report CS-RR-389, 10 May, 2002. [9] D. P. Spooner, J. Cao, S. A. Jarvis, L. He, G.
Nudd. Performance-aware Workflow Manage-ment for Grid Computing.The Computer Jour-nal, 2004.
[10] A. L. Rowland, M. Burns, T. Hartkens, J. V. Hajnal, D. Rueckert, D. L. G. Hill. Infor-mation eXtraction from Images (IXI): Image Processing Workflows Using A Grid Enabled Image Database. DiDaMIC Workshop - MIC-CAI, 2004, Rennes, France.
[11] R. D. Stevens, Alan. J. Robinson, C. A. Goble. myGrid: Personalised Bioinformatics on the Information Grid. 11th International Conference on Intelligent Systems for Molec-ular Biology, Bioinformatics Vol. 19 Suppl. 1 2003, pp.302-304.
[12] http://www.geodise.org
[13] J. Kim, M. Spraragen, Y. Gil. An Intelligent Assistant for Interactive Workflow Composi-tion.Proceedings of the 9th International Con-ference on Intelligent User Interface, ACM Special Interest Group on Computer-Human Interaction, 2004, pp. 125-131.
[14] http://www.wesc.ac.uk/projects/ gsib
[15] http://taverna.sf.net