http://wrap.warwick.ac.uk/
Original citation:
Chester, Adam P., Leeke, Matthew, Al-Ghamdi, M., Jarvis, Stephen A. and Jhumka,
Arshad (2011) A modular failure-aware resource allocation architecture for cloud
computing. In: UK Performance Engineering Workshop (UKPEW'11), Bradford, United
Kingdom, 7-8 July 2011
Permanent WRAP url:
http://wrap.warwick.ac.uk/45660
Copyright and reuse:
The Warwick Research Archive Portal (WRAP) makes this work by researchers of the
University of Warwick available open access under the following conditions. Copyright ©
and all moral rights to the version of the paper presented here belong to the individual
author(s) and/or other copyright owners. To the extent reasonable and practicable the
material made available in WRAP has been checked for eligibility before being made
available.
Copies of full items can be used for personal research or study, educational, or
not-for-profit purposes without prior permission or charge. Provided that the authors, title and
full bibliographic details are credited, a hyperlink and/or URL is given for the original
metadata page and the content is not changed in any way.
A note on versions:
The version presented in WRAP is the published version or, version of record, and may
be cited as it appears here.
A Modular Failure-Aware Resource Allocation
Architecture for Cloud Computing
A.P. Chester, M. Leeke, M. Al-Ghamdi, S.A. Jarvis, and A. Jhumka
Department of Computer Science, University of Warwick, Coventry, UK, CV4 7AL
{apc,matt,mhd,arshad,saj}@dcs.warwick.ac.uk
Abstract. The prevalence of cloud computing environments and the ever in-creasing reliance of large organisations on computational resources has meant that service providers must operate at unprecedented scales and levels of effi-ciency. Dynamic resource allocation (DRA) policies have been shown to allow service providers to improve resource utilisation and operational efficiency in presence of unpredictable demands, hence maximising profitability. However, practical considerations, such as power and space, have led service providers to adopt rack based approaches to application servicing. This co-location of compu-tation resources, and the associated common provision of utilities it encourages, has immediate implications for system dependability. Specifically, in the pres-ence of rack crash failures which can lead to all the servers within a rack becom-ing unavailable, resource allocation policies need to be cognisant of failures. In this paper, we address this issue and make the following specific contributions: (i) we present a modular architecture for failure-aware resource allocation, where a performance- oriented DRA policy is composed with a failure-aware resource
allocator, (ii) we propose a metric, calledCapacity Loss, to capture the exposure
of an application to a rack failure, (iii) we develop an algorithm for reducing the proposed metric across all applications in a system operating under a DRA policy, and (iv) we evaluate the effectiveness of the proposed architecture on a large-scale DRA policy in context of rack failures, ultimately concluding that our approach reduces the number of failed requests as compared to a single random alloca-tion. The main benefit of our approach is that we have developed a failure-aware resource allocation framework that can work in tandem with any DRA policy.
1
Introduction
The emergence of cloud computing promises to the revolutionise the way that organi-sations manage their use of computational resources. Under traditional models, organ-isations must take responsibility for the procurement, installation and maintenance of costly and inflexible systems that must be periodically reconsidered. However, under a cloud-based model this is not the case. Instead organisations can consume resources as and when they are required, with cloud providers ensuring that the capacity of supplied resources can expand to meet the individual needs of any organisation.
Further, the characteristics of DRA policies and the multiplicity of concerns they ac-count for make them particularly applicable at large-scale, such as in the context of cloud computing.
In order to realise effective and economic models for cloud computing, service providers are turning to data centers and high speed networks, as well as DRA. In order to maximise resource utilisation and operational efficiency, hence profitability, a cloud provider must also make many practical considerations in the design of a data center, including those relating to physical space, connectivity, power and cooling. These con-siderations typically make it practical for computational resources to be arranged in collections, hence the necessity of rack based application servicing. However, this ar-rangement typically leaves collections of resource dependent on common utilities, such as power and network connections, as well as exposing them to a host of co-location issues, such as physical impact and disconnection.
The described environment is particularly consistent with the notion of a cloud provider offeringInfrastructure as a Service[14], where an elastic computational re-source is leased to a organisation, who must then configure the rere-source for use. Under this model an organisation would typically be billed for the resource utilised, this pro-viding flexibility in situations where workloads are volatile.
Given the scale at which physical resources exist in such environments, failures will be the norm rather than the exception [6]. However, when problems such as power outage or network switches failures occur, a whole rack can fail, leading to multiple servers being unavailable. Failures at such a scale are very likely to significantly reduce the efficiency, hence profitability, of a system. Thus, two possible ways of addressing this problem of multiple serves being unresponsive are: (i) design DRA policies that are failure-aware or (ii) execute a DRA when a failure is encountered. In this paper, we adopt the first of these approaches, and reserve the second option for future work.
For the design of failure-aware DRA policies, it is unrealistic to expect organisa-tions to modify their policies to capture failure awareness. Rather, it would be better if a failure-aware module can be designed that can work with any DRA currently in use. In this paper, we propose a modular architecture for failure-aware DRA, whereby a aware allocator module works in tandem with a DRA module. The failure-aware allocator module ensures that resource allocation are made in such a way so as to minimise the impact of rack failures on running applications. The novel property of our approach is that the failure-aware allocator only performs “robustness” balancing across applications.
1.1 Contributions
In this context, we make the following specific contributions:
– We develop a modular architecture for failure-aware resource allocation.
– We propose a metric, calledCapacityLoss, which captures the exposure of an ap-plication to a rack failure
– We evaluate the effectiveness of our framework on a large-scale DRA policy in context of rack failures, and show the efficiency of our approach.
The overarching contribution of this paper is the development of a modular aware architecture for resource allocation. The novel aspect of this is that the failure-aware resource allocator can work well in tandem with any DRA policy that is being used by the organisation.
1.2 Paper Structure
The remainder of this paper is structured as follows: In Section 2 we provide a survey of related work. In Section 3 we set out the system and fault models adopted in this paper. In Section 4 we define and illustrate a machine placement metric for improving the dependability of existing DRA policies. In Section 5 we detail our experimental setup, before presenting the results of our experimentation in Section 6. In Section 7 we discuss the implications of the results presented. Finally, in Section 8 we conclude this paper with a summary and a discussion of future work.
2
Related Work
The properties of DRA policies have been throughly considered in the context of per-formance evaluation and measurement. In this context, the use of dynamic resource allocation has been shown to improve application performance and the utilisation of resources [3] [10]. Other work relating to the performance of DRA policies had led to the development, augmentation and evaluation of policies with a view to further en-hancing DRA system performance [1] [17]. For example, in [4] the authors developed an algorithm for profit maximisation of multi-class requests through dynamic resource allocation, whilst work in [2] proposed an approach for the dynamic allocation of re-sources from a common pool. The issue of resource allocation is also addressed in research such as [12], where periodic balanced server provisioning was investigated. In contrast to experimental research, analytical approaches to dynamic resource allocation have also been explored in work such as [7], [13] and [18], where application modelling and queuing theory were applied respectively.
The issues of rack-awareness has been considered to some extent by [9], part of which is a file system, known as HDFS, that can account for rack distribution when storing data. Our work differs from [9] as our algorithm works in conjunction with a DRA system at the level of Infrastructure as a Service while Hadoop operates at the level ofPlatform as a Service.
3
Models
In this section, we present the system and fault models adopted in this paper as well as enunciating our assumptions.
3.1 System Model
We consider an environment where a set of applicationsA = {a1, a2, ..., an}are de-ployed across a set of racksR={r1, r2, ..., rm}. A rackriconsists of a set of servers
Si ={si,1, si,2, ..., si,k}. A serversi,jmay service requests from only one application at any time. We assume that (i) all serverssi,j are homogeneous in that they provide identical resources, and (ii) each server has all the resources required by an application, i.e., no communication between servers is required for application servicing. Such a system model is typical in cloud computing environment or large scale datacenters.
3.2 Fault Model
Given the described system model, failures are expected to be the norm rather than the exception [6] due to the very large number of computing hardware present. We consider crash failures to occur at a rack level, where this type of failure may be caused due to, for example, power outages or network switch failures. When such a rackri fails, all the serverssi,j ∈ Sibecome unavailable. We assume a failure mode where at most a single rack can fail at any one time.
4
A Failure-Aware Allocation Algorithm
4.1 Metric for Failure-Awareness
DRA Policy
Failure-Aware
Allocator
Robustness Metric
Racks Resource Allocation
Transformation
Workload Resource
[image:6.612.188.422.119.346.2]Augmented Resource Allocation Transformations
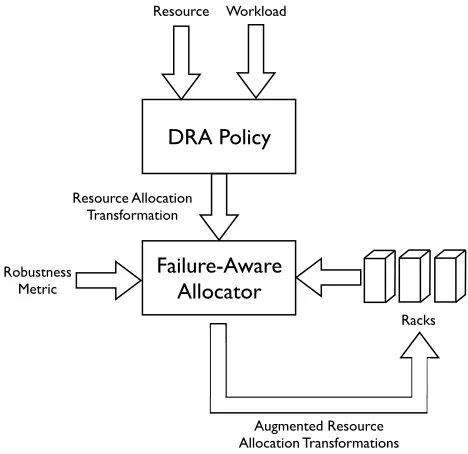
Fig. 1.A Modular Architecture for Failure-Aware Resource Allocation
will be lost due to the failure of the rackrito measure the loss of application capacity foraj, and base reallocation decisions on that proportion.
The metric we propose, calledcapacity loss, is shown as equation 1, whereriis the rack,aj is an application andsji is the number of servers in rackrihosting application
aj, and Saj is the number of servers hosting application across all racks, is used to
capture the impact the failure of rackri will have on the application aj in terms of capacity.
CapacityLossri,aj =
sji Saj
(1)
It is clear for Equation 1 that aCapacity Lossof 1 is undesirable, as it would means that all servers hosting applicationaj are located in rackri. In an ideal situation, the
Capacity Lossvalue would be 0. Thus, an objective is to minimiseCapacity Lossfor all applications across all racks.
4.2 A Modular Architecture for Failure-Aware Resource Allocation
In this section, we present a modular architecture, in Figure 1, for failure-aware resource allocation in the presence of rack failures.
transfor-mation for performance reasons. For example, such an output will be of the following type:
– Take 4 servers from application 4 to host application 2.
– Take 2 servers from application 1 to host application 3.
However, such DRAs are not rack-aware. Specifically, DRA outputs do not specify the racks where the resource transformation is to take place. In this paper, one of our con-tributions is to develop a component, namely theAllocator(see Figure 1), that performs the rack-aware resource transformation in that it augments the resource transformation needed with rack information, i.e., it specified the racks where the transformations are to occur. For example, with an allocator module, our previous example would be like:
– Take 4 servers from application 4 to host application 2 (2 servers from rack 1 and 2 servers from rack 3).
– Take 2 servers from application 1 to host application 3 (1 server from rack 2 and 1 server from rack 2).
However, with the non-zero probability of rack failures, the allocator needs to be failure-aware in that it needs to perform these resource transformation in such a way to min-imise theCapacity Loss(see Equation 1) for each application. The algorithm for the failure-aware allocator is shown in Algorithm 1. In a nutshell, Algorithm 1 searches for all racks where applicationafis being hosted. Then, the failure-aware allocator chooses the a set of racks, denotedRt
f, where the capacity loss for applicationaf on a rackri, whereri ∈ Rft is maximum, and capacity loss for applicationat onri is minimum. Practically, this implies that it is better to remove servers for applicationaffrom a rack
riwhere the capacity loss foraf is already high. Further, it also means that it is better to allocate servers to host applicationaton rackri where applicationatalready has minimum capacity loss. Once these racksRft are identified, one of them is picked at random.
In the next sections, we describe and present the results of experiments designed to evaluated the efficiency of our architecture and failure-aware allocator algorithm.
5
Experimental Setup
In this section we detail the experimental approach used to derive the results presented in Section 6.
5.1 Failure Scenario
Algorithm 1Balanced migration algorithm
Input: atThe application to be migrated to
Input: afThe application to be migrated from
Input: Rthe set of all racks
Output: The optimal rack for migration
1: Letc1=∅
2: Letc2=∅
3: Letc3=∅
4: Letobe an optimal rack
5: Letmtrepresent the best value forat
6: Letmf represent the best value foraf
7: Initialisemt= +∞
8: Initialisemf =−∞
9: for allr∈Rdo
10: ifrcontainsaf then
11: c1←r
12: end if
13: end for
14: for allr∈c1do
15: vt=CapacityLossr,at
16: ifvt≤mtthen
17: ifvt< mtthen
18: c2=∅
19: end if
20: c2←r
21: mt=vt
22: end if
23: end for
24: for allr∈c2do
25: vf =CapacityLossr,af
26: ifvf ≥mf then
27: ifvf > mf then
28: c3=∅
29: end if
30: c3←r
31: mf =vf
32: end if
33: end for
34: return Random member ofc3
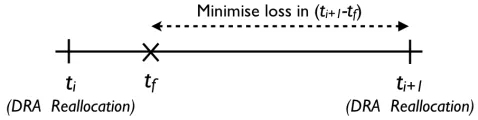
failure-aware resource allocator module augments the resource transformations with rack location information. A rack failure tf occurs such thatti < tf < ti+1, where
ti+1is the period for the next DRA decision.
the system performance loss incurred in the period betweentf andti+1through rack-awareness in the resource allocation mechanism.
Fig. 2.Timeline depicting a typical event ordering
5.2 Resource Allocation
Much current research in DRA policies does not explicitly consider resource failure. In such works, each application is viewed as a logical collection of servers which are equal. In this case, servers may be migrated between applications arbitrarily. We use this na¨ıve approach as our benchmark, selecting servers to be migrated as required with no regard for their location. We refer to this allocation mechanism as therandom allocator. Under the balanced resource allocator, which uses theCapacity Lossmetric shown in Equation 1 to assign applications, we attempted to minimise the potential capacity loss in the event of a rack failure. In Section 4, we decoupled the failure-aware allo-cation mechanism, in the allocator, from an abstract DRA policy. For our experiments we employed this approach and used the resource allocation algorithm shown in Algo-rithm 2. The algoAlgo-rithm uses workload prediction and applications which are ranked by criticality (this may be governed by SLA or a business metric) to partition resources.
To reduce experimental uncertainty we used 10 identical applications. Each appli-cation processes a single type of request with a fixed service duration of 100ms.
The simulated datacenter is comprised of 400 homogeneous servers that are housed in racks. Each rack contained 40 servers, giving a total of 10 racks. Initially the servers were allocated evenly between applications, i.e., 40 servers per application, with 4 servers per application per rack. The initial allocation of servers to racks was done such that the minimum capacity loss for each application, i.e., maximum robustness for each application, was achieved. When a server was reallocated, it first had to complete the servicing of current and queued requests, before migrating to the newly assigned application. The process of server migration was fixed at 30 seconds.
As the number of applications is high, we use synthetic sine-based workloads of var-ious frequencies and amplitudes. In all cases the total workload of the system is greater than 75% of total system capacity. The individual workloads are shown in Figure 3.
0 500 1000 1500 2000 2500 3000
0 300 600 900 1200 1500 1800 2100 2400 2700 3000 3300 3600
Requests per second
Time (s) Application 1
Application 2 Application 3Application 4 Application 5Application 6 Application 7Application 8 Application 10Application 9
76 78 80 82 84 86
0 300 600 900 1200 1500 1800 2100 2400 2700 3000 3300 3600
Total System Utilisation (%)
[image:10.612.144.476.117.398.2]Time (s)
Fig. 3.Experiment workloads
sources to applications in order of priority. This algorithm allocates all server resources to applications. The complete allocation algorithm can be seen in Algorithm 2.
We selected five timings for rack failures. Each rack was then failed at each of the timings in a separate simulation. The times selected for the failures are 645, 1245,1845, 2445, 3045 seconds. The total simulation time was 3600 seconds.
5.3 Expected Results
Based on our proposed framework, we expect the following result from our experi-ments, which we will verify in the results section (Section 6):
- We generally expect the balanced resource allocator (Algorithm 1) to have less failed requests due to the fact that it creates allocation which minimises the capacity loss for each application across each rack.
- We anticipate that the random allocator may yield better performance in rare situ-ations, where a rack is lightly leaded with respect to a single application, though this is expected to be offset by a higher application exposure, i.e, a high value of
Algorithm 2Improved scalability algorithm
1: LetNbe the number of applications
2: Leta1, ..., anbe ranked applications
3: Letm1, ..., mnbe minimum resource ofai
4: Lettabe the throughout of a server ofa
5: Letnabe number of servers allocated toa
6: LetIbe idle servers
7: fori= 1;i < N;i+ +do
8: p= predictedDemand(ai)
9: Si0=tpa
10: ifSi0< Sithen
11: AppendSi−Si0servers toI
0
12: Si0→Si
13: end if
14: end for
15: fori= 1;i < N;i+ +do
16: ifSi6=S0ithen
17: ifI0>0then
18: ifI0> Si0−Sithen
19: MoveS0i−SifromI0toSi
20: break
21: else
22: Move all servers inI0toSi
23: end if
24: end if
25: forj=N;j > i+ 1;j− −do
26: ifSi0−Si≤Sj−mjthen
27: Move(Si0−Si)fromSjtoSi
28: Break
29: else
30: Move(Sj−mj)fromSjtoSi
31: end if
32: end for
33: end if
34: end for
35: LetI=I0
6
Results
Table 1.Maximum total request failure percentage for each failure
Allocator Failure 1 Failure 2 Failure 3 Failure 4 Failure 5
Random 3.20 2.83 2.42 1.87 1.60
Balanced 3.16 2.75 2.27 1.85 1.60
% Imp. 1.12 2.87 5.95 1.09 0.02
Table 2.Standard deviation of failures across all racks
Allocator Failure 1 Failure 2 Failure 3 Failure 4 Failure 5
Random 0.0588 0.0373 0.0710 0.0433 0.0105
Balanced 0.0475 0.0309 0.0358 0.0237 0.0096
% Imp. 19.1851 17.1305 49.4922 45.2765 7.9847
6.1 Overall Results
We now present the overall impact of a rack failure on the total failure rate over the duration of the experiment. Firstly, we consider the impact of the allocation technique on the maximum percentage of failed requests for each failure. Each value shown in Table 1 reflects the percentage of failed requests over the duration of a simulation. The results demonstrate that the balanced allocator reduced the maximum impact of a rack failure on the overall failure rate, as compared with the random allocator, as it consistency yields an improvements in the percentage of failed requests. The maximum observed improvement is nearly 6%. This is a considerable improvement, given that it was measured over the full duration of a simulation.
The standard deviation of the overall failure percentage for each rack and failure is shown in Table 2. The nature of the balanced allocator caused a consistent reduction in the standard deviation of the failure rates. This can be explained by the fact that the balanced allocator algorithm (Algorithm 1) attempts to reduce each application’s
Capacity Loss, thereby reducing the deviation in terms of failed requests. The most significant improvement can be seen in Failure3, though it should be noted that the lowest percentage improvement is nearly 8%.
6.2 Failure Results
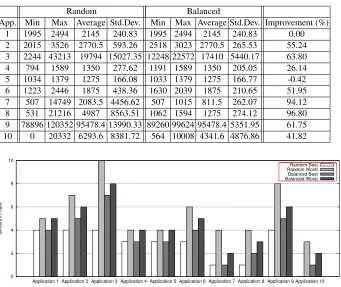
Failure 1 in our experimentation occurs at 645 seconds, after two migration intervals. Table 3 contains the failures observed for each application, under both the random and balanced allocators. As mentioned before, we crashed all 10 racks at the 645 seconds marks. The minimum/maximum columns represent the minimum/maximum number of failed requests across all the 10 failures. The rightmost column of Table 3 presents the percentage improvement in standard deviation of the balanced allocator over the random allocator.
Table 3.Application results for Failure 1
Random Balanced
App. Min Max Average Std.Dev. Min Max Average Std.Dev. Improvement (%)
1 1995 2494 2145 240.83 1995 2494 2145 240.83 0.00
2 2015 3526 2770.5 593.26 2518 3023 2770.5 265.53 55.24
3 2244 43213 19794 15027.35 12248 22572 17410 5440.17 63.80
4 794 1589 1350 277.62 1191 1589 1350 205.05 26.14
5 1034 1379 1275 166.08 1033 1379 1275 166.77 -0.42
6 1223 2446 1875 438.36 1630 2039 1875 210.65 51.95
7 507 14749 2083.5 4456.62 507 1015 811.5 262.07 94.12
8 531 21216 4987 8563.51 1062 1594 1275 274.12 96.80
9 78896 120352 95478.4 13990.33 89260 99624 95478.4 5351.95 61.75
10 0 20332 6293.6 8381.72 564 10008 4341.6 4876.86 41.82
0 2 4 6 8 10
Application 1 Application 2 Application 3 Application 4 Application 5 Application 6 Application 7 Application 8 Application 9 Application 10
Servers in Rack
Random Best Random Worst Balanced Best Balanced Worst
Fig. 4.Range of allocations giving best and worst results for Failure1
allocator can place fewer instances of an application on a rack, i.e., an application can have a capacity of 0 on a rack, which never happens in the balanced algorithm (unless an application has a 0 workload), than the balanced allocator. On the other hand, for the maximum values, the random allocator may allocate servers in a rack to applications in such a way that theCapacity Lossis very high, resulting in very high number of failed requests.
Table 3 shows the difference in standard deviation between the two allocators. The result for Application 5 is due to a minor difference in the round robin scheduling of requests across servers. Application 1 has an identical failure rate under both allocators. The best and worst rack configurations for each application under both allocators are shown in Figure 4. The maximum difference in allocations for the random policy is 6, while the balanced policy achieves a maximum difference of 1, which shows that Algorithm 1 of the balanced allocator achieves better “robustness” balancing than the random allocator.
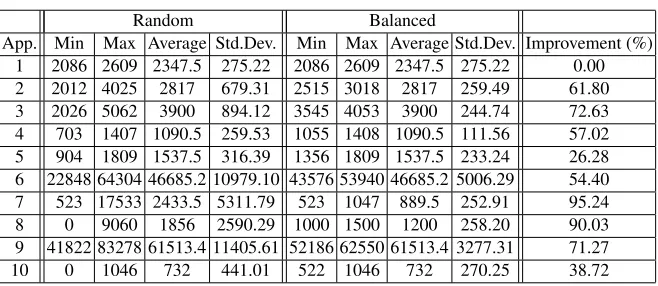
Table 4.Application results for Failure 2
Random Balanced
App. Min Max Average Std.Dev. Min Max Average Std.Dev. Improvement (%)
1 2086 2609 2347.5 275.22 2086 2609 2347.5 275.22 0.00
2 2012 4025 2817 679.31 2515 3018 2817 259.49 61.80
3 2026 5062 3900 894.12 3545 4053 3900 244.74 72.63
4 703 1407 1090.5 259.53 1055 1408 1090.5 111.56 57.02
5 904 1809 1537.5 316.39 1356 1809 1537.5 233.24 26.28
6 22848 64304 46685.2 10979.10 43576 53940 46685.2 5006.29 54.40
7 523 17533 2433.5 5311.79 523 1047 889.5 252.91 95.24
8 0 9060 1856 2590.29 1000 1500 1200 258.20 90.03
9 41822 83278 61513.4 11405.61 52186 62550 61513.4 3277.31 71.27
10 0 1046 732 441.01 522 1046 732 270.25 38.72
Table 5.Application results for Failure 3
Random Balanced
App. Min Max Average Std.Dev. Min Max Average Std.Dev. Improvement (%)
1 2095 3143 2514 331.34 2095 2619 2514 220.83 33.35
2 2044 4088 2862 689.52 2555 3067 2862 264.01 61.71
3 1784 4459 3300 703.31 2675 3568 3300 311.94 55.65
4 1073 5906 2361.5 1880.91 1073 5907 1985.5 1388.15 26.20
5 31948 52676 45421.2 8532.40 42312 52676 45421.2 5006.29 41.33
6 852 2556 1875 500.00 1704 2131 1875 219.90 56.02
7 494 17911 2433.5 5443.78 494 989 889.5 208.45 96.17
8 437 1751 1050 422.90 874 1313 1050 226.35 46.48
9 2064 3615 3045 513.64 2580 3098 3045 163.39 68.19
10 0 1326 619.5 427.38 442 885 619.5 228.51 46.53
6.3 Application Results
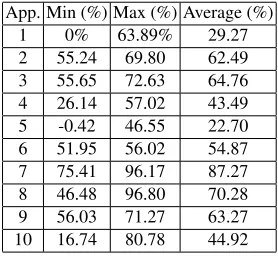
Table 8 gives the range of improvement provided by the balanced allocator across all failures and across all racks. The benefit of the balanced allocator varies between -0.42% and 96.80% across each application.
In two cases Application 1 gains no benefit form the allocator, due to identical allocations from both policies. The balanced allocator improves the deviation of Appli-cation 1 by an average of 29.27%.
When using the balanced allocator Application 5 has a marginally worse variance (-0.42% and -0.25%) than the random allocator. This is due to the round-robin scheduling of requests to servers causing a slightly higher load at the point of failure.
7
Discussion
Table 6.Application results for Failure 4
Random Balanced
App. Min Max Average Std.Dev. Min Max Average Std.Dev. Improvement (%)
1 2064 3611 2631 451.50 2579 3095 2631 163.03 63.89
2 2037 4075 2904 681.62 2547 3058 2904 246.12 63.89
3 1688 4226 3000 703.48 2535 3381 3000 240.17 65.86
4 843 2110 1350 387.89 1265 1688 1350 177.88 54.14
5 32968 64060 51623.2 8175.23 43332 53696 51623.2 4369.85 46.55
6 11282 52721 36145.6 12160.21 32001 42362 36145.6 5349.79 56.01
7 427 2135 811.5 549.43 427 855 811.5 135.10 75.41
8 443 1773 975 407.36 886 1329 975 186.57 54.20
9 1308 3055 2355 512.30 2180 2617 2355 225.28 56.03
10 0 3567 778.5 1028.41 468 938 562.5 197.64 80.78
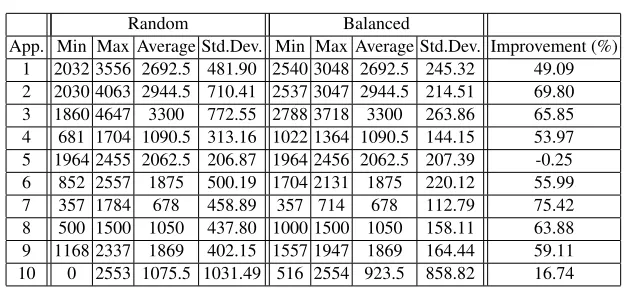
Table 7.Application results for Failure 5
Random Balanced
App. Min Max Average Std.Dev. Min Max Average Std.Dev. Improvement (%)
1 2032 3556 2692.5 481.90 2540 3048 2692.5 245.32 49.09
2 2030 4063 2944.5 710.41 2537 3047 2944.5 214.51 69.80
3 1860 4647 3300 772.55 2788 3718 3300 263.86 65.85
4 681 1704 1090.5 313.16 1022 1364 1090.5 144.15 53.97
5 1964 2455 2062.5 206.87 1964 2456 2062.5 207.39 -0.25
6 852 2557 1875 500.19 1704 2131 1875 220.12 55.99
7 357 1784 678 458.89 357 714 678 112.79 75.42
8 500 1500 1050 437.80 1000 1500 1050 158.11 63.88
9 1168 2337 1869 402.15 1557 1947 1869 164.44 59.11
10 0 2553 1075.5 1031.49 516 2554 923.5 858.82 16.74
in use, i.e., the most desirable approach would be composing the DRA policy itself with a failure-aware allocator component. The modular architecture proposed in this paper has shown that, by decoupling the allocation mechanism from for DRA policy, the performance-oriented goals of the DRA can be separated from the conflicting aim of improving application robustness.
Once the decoupling of the DRA policy and allocation mechanism has been achieved, the focus turns to the function of the allocation mechanism itself. The metric proposed in this paper,capacityLoss, serves to quantify the exposure of an application, e.g., wherecapacityLoss = 1for a given application, that application is completely ex-posed to a failure of the rack on which it is hosted. This focus on application exposure is motivated by the fact that, while it is reasonable to balance applications across racks in the context of static allocation, this is not possible under existing DRA policies, which assume the existence of a common, un-partitioned resource pool.
[image:15.612.151.465.300.446.2]Table 8.Application Results Across Failures and Racks (% Improvment In Standard Deviation)
App. Min (%) Max (%) Average (%)
1 0% 63.89% 29.27
2 55.24 69.80 62.49
3 55.65 72.63 64.76
4 26.14 57.02 43.49
5 -0.42 46.55 22.70
6 51.95 56.02 54.87
7 75.41 96.17 87.27
8 46.48 96.80 70.28
9 56.03 71.27 63.27
10 16.74 80.78 44.92
impact for any single application; when the failed rack was lightly loaded with respect to the application, i.e., when the capacity loss of that application on a rack was mini-mal. However, this is not necessarily positive, as for this light loading to occur, another rack may be heavily loaded. Results averaged across all racks demonstrate significant improvements in the mean number of failed requests for the balanced allocator. In ad-dition to the average case, the balanced allocator exhibited lower deviations than the random allocator. Since rack failures are inherently unpredictable, minimising the aver-age case is clearly of great benefit when operating at large-scale. In turn, this represents lesser exposure to loss of income due to unforeseen unavailability of applications.
As the magnitude of the systems operating under DRA policies increases, the scale and frequency of the problems addressed in this paper will similarly increase. Hence, as failures become the expectation rather than the exception for large-scale systems, effective resource allocation and modular architectures that facilitate a separation of concerns will become increasingly important for cloud providers offering Infrastructure as a Service.
8
Conclusion and Further Work
In this section, we provide a contribution summary and discussion of future work relat-ing to the results presented.
8.1 Summary
The results presented demonstrate the effectiveness of our architecture and mech-anisms, with consistent improvement being observed in almost all situations. Indeed, when the average case is considered, the proposed approach exhibits a minimum im-provement of more than 22% and a maximum of more than 87% across all failure situations.
The novelty of our modular, failure-aware architecture for resource allocation is that it is applicable to, and will work in tandem with, any DRA policy. Practically, this implies that organisations need not modify their DRA policy, rather they can just integrate the failure-aware resource allocator to reduce the exposure of applications to rack failures.
8.2 Future Work
As virtualisation technologies continue to improve and service providers look to con-solidate their servers, it is inevitable that application densities will increase. In future work we intend to consider the effects that such consolidation will have on the issues explored in this paper. For example, as application densities and further complexity is incorporated in to the software of resources, it may be necessary to reconsider how application exposure can be measured.
Additionally, in this paper we have demonstrated the ability of a modular archi-tecture and a balanced allocator to reduce the average number of failed requests in a large-scale system. This exploration could be expanded through the development of a, still decoupled, allocation mechanism that can account for rack failures in an active manner, thus reducing the need to reallocate.
References
1. M. Al-Ghamdi, A. Chester, and S. Jarvis. Predictive and dynamic resource application for
enterprise applications. InProceedings of the 10th IEEE International Conference on
Scal-able Computing and Communications, pages 2776–2783, June 2010.
2. J. S. Chase, D. E. Irwin, L. E. Grit, J. D. Moore, and S. E. Sprenkle. Dynamic virtual
clusters in a grid site manager. InProceedings of the 12th International Symposium on High
Performance Distributed Computing, pages 90–100, June 2003.
3. A. P. Chester, J. W. J. Xue, L. He, and S. A. Jarvis. A system for dynamic server allocation in
application server clusters. InProceedings of the International Symposium on Parallel and
Distributed Processing with Applications, pages 130–139, December 2008.
4. L. He, W. J. Xue, and S. A. Jarvis. Partition-based profit optimisation for multi-class
re-quests in clusters of servers. InProceedings of the International Conference on e-Business
Engineering, pages 131–138, October 2007.
5. J. Idziorek. Discrete event simulation model for analysis of horizontal scaling in the cloud
computing model. InProceedings of the Winter Simulation Conference, pages 3004–3014,
December 2010.
6. P. Joshi, H. S. Gunawi, and K. Sen. Prefail: Programmable and efficient failure testing framework. Ucb/eecs-2011-3, University of California at Berkeley, 2011.
7. X. Liu, J. Heo, and L.Sha. Modeling 3-tiered web applications. InProc. International
8. D. A. Patterson. A simple way to estimate the cost of downtime. InProceedings of the 16th USENIX Systems Administration Conference, pages 185–188, November 2002.
9. K. Shvachko, H. Kuang, S. Radia, and R. Chansler. The hadoop distributed file system. In
Proceedings of the 26th IEEE Symposium on Mass Storage Systems and Technologies, pages 1–10, May 2010.
10. J. Slegers, I. Mitriani, and N. Thomas. Evaluating the optimal server allocation policy for
clusters with on/off sources. Journal of Performance Evaluation, 66(8):453–467, August
2009.
11. G. Tian and D. Meng. Failure rules based node resource provisioning policy for cloud
com-puting. InProceedings of the International Symposium on Parallel and Distributed
Process-ing with Applications, pages 397–404, December 2010.
12. B. Urgaonkar and A. Chandra. Dynamic provisioning of multi-tier internet applications. In
Proceedings of the 2nd International Conference on Autonomic Computing, pages 217–228, September 2005.
13. B. Urgaonkar, G. Pacifi, P. Shenoy, M. Spreitzer, and A. Tantawi. An analytical model for
multi-tier internet services and its applications. InProceedings of the ACM SIGMETRICS
International Conference on Measurement and Modelling of Computer Systems, June 2005. 14. L. M. Vaquero, L. Rodero-Merino, J. Caceres, and M. Lindner. A break in the clouds:
towards a cloud definition. ACM SIGCOMM Computer Communication Review, 39(1):50–
55, January 2008.
15. K. V. Vishwanath and N. Nagappan. Characterizing cloud computing hardware reliability. InProceedings of the 1st ACM Symposium on Cloud Computing, pages 193–204, June 2010.
16. M. Wiboonrat. An empirical study on data center system failure diagnosis. InProceedings
of the 3rd International Conference on Internet Monitoring and Protection, pages 103–108, June 2008.
17. J. Xue, A. Chester, L. He, and S. Jarvis. Dynamic resource allocation in enterprise systems. InProceedings of the 14th International Conference on Parallel and Distributed Systems, pages 203–212, December 2008.
18. Q. Zhang, L. Cherkasova, and E. Smirni. A regression-based analytical model for dynamic
resource provisioning of multi-tier applications. InProceedings of the 4th International