Master Thesis
Author: L.J. Bolte
Student number: s1623435
Supervisor: Dr. X. Huang
MSc Business
Administration
Financial Management
Track
Abstract
In this thesis the static trade off theory of the capital structure for German listed firms will be
researched. These determinants are obtained from literature on static trade off theory and are tested in the German market with all its particularities. The research consists of an analysis of a time frame that spans ten years, concerning the determinants of the capital structure derived from previous research on both the static trade off theory and the agency theory.
Colophon
Document: Master thesis Version: 2
Date: January 16, 2017
Author: L.J. Bolte Student number: s1623435
Student E-mail: [email protected]
University: University of Twente
Address: Drienerlolaan 5, 7522 NB Enschede Program: MSc Business Administration Track: Financial Management
Supervisor: Dr. X. Huang
E-mail: [email protected]
Preface
In front of you lies the master’s thesis which I wrote in order to complete the master of business administration at the University of Twente. I liked the course and discipline of corporate finance, and in order to complete the course I have written a thesis within this topic. I have written my thesis both at home and at the University of Twente, this enabled me to choose the topic which spoke to me the most.
This topic concerns static trade off theory for German firms. Firstly I wanted to write my master’s thesis on firms that had done an IPO in the Netherlands, however I found that there would be a problem regarding the amount of data present. So in order to stick to the topic I moved my topic of research to Germany, which has a larger stock market. However as the determinants for capital structure post IPO are unclear and in larger number, I decided to change the topic to the current static trade off theory research for German firms. In order to do this I have first studied theory about capital structure. I have done this by reading books, academic journals and by consolation of the internet.
I would like to use this opportunity to thank several people who , to a greater or lesser extent, contributed to this study. Firstly, I would like to thank my supervisors at the University of Twente, in particular Xiaohong Huang and Henry van Beusichem. Finally, I would like to thank everybody who I didn’t name personally, but who did have a supportive role. I wish you a lot of fun reading my thesis.
Leonarjo Bolte
Table of contents
Preface ... iii
Table of contents ... iv
1. Introduction ... 1
2. Literature review ... 3
2.1 German economy ... 3
2.2 Capital structure theories ... 3
2.3 Static trade off theory ... 3
2.4 Agency costs ... 6
2.5 Pecking order theory ... 7
3. Methodology and dataset ... 8
3.1 Research question ... 8
3.2 Hypotheses ... 8
3.3 Model ... 10
3.4 Dependent variable ... 10
3.5 Independent variables ... 12
3.6 Data ... 15
4. Results ... 20
4.1 Robustness test ... 26
5. Summary and conclusions ... 27
Appendix A Homo/Heteroscedasticity ... 30
Appendix B Robustness test ... 32
1.
Introduction
This study tests whether the static trade off theory can explain the capital structure of German firms. As the static trade off theory along with the pecking order theory are currently the leading, and competing, models in finance literature (Fama & French, 2002). This study researches the static trade off theory, this theory states that firms will balance their capital structure on the basis of the benefits of debt which is: the tax shield from interest payments (Myers, 1984). And the cost of debt which consists of: bankruptcy costs (Myers, 1984). The opposing capital structure theory is the pecking order theory, which states that due to adverse selection managers will choose the financing policy with the least amount of risk, thus favouring internal financing over external financing (Myers, 1984). Complementary to both the static trade off- and the pecking order-theory, the agency theory is often used to explain deviations from the main theory. In accordance with recent literature on the subject, the current research will also include both static trade off theory and agency theory. Agency theory predicts differences in the goals of shareholders and bondholders, in defining these differences three forms of agency costs a distinction between three forms of agency costs are made: risk shifting, the underinvestment problem and the free cash flow hypothesis.
In current capital structure research the emphasis lies on international data and cross country analysis, examples come from Rajan and Zingales (2007), who perform a study on the G-7 countries and Wald (1999) who does a cross country analysis between five countries. Further much research has been done on the USA, for instance by Frank and Goyal (2007) and Titman and Wessels (1988). Although, a little more scarce, country specific researches are also available for instance by Drobetz and Fix (2005) and Gaud et al. (2005)for Switzerland and Chen and Strange (2005) and Huang (2006) for China. However I haven’t been able to find research specifically concerning Germany’s capital structure in relation to the static trade of theory. An important note however must be made as the search for this research has been limited to papers written in the English language and only the better known Anglo-Saxon databases have been searched.
Germany's economy being a bank based economy comes from the fact that banks supply the larger part of the capital needed. This is a result of the fact that banks and lenders have a longer and more intensive relationship and are thus able to impose lending conditions specifically tailored for the lender. Further banks can exploit their economies of scale to mobilize capital faster and cheaper. However opponents of bank based economies argue that in a liquid-, market-based market investors will invest smaller sums of money in order to achieve a diversified portfolio, this will lead to a better valuation compared to large corporate sums being loaned by bankers. Further, the faster and more accurate valuation that typifies a market-based economy should clarify managerial compensation, further the thread of a hostile takeover also motivates managers to exercise great caution in decision making (Levine, 2002).
produce the expected results in the German sample, as both theories predict a negative relationship the results show a positive relationship. Firm size however does influence the debt ratio positively, which is in accordance with predictions from both static trade off- and agency- theory. Volatility is the only variable on which both theories predict opposite effect. The variable shows a positive relationship between leverage and volatility of earnings1, this relationship was expected by the agency theory, however static trade off theory predicts a negative relationship. Lastly a negative relationship was found for tax and leverage, contradicting the static trade off theory.
The remainder of the paper is structured as follows: section 2 will address the relevant literature on the German market, the static trade off theory the agency theory and the pecking order theory. Section 3 discusses the hypotheses and the variables used. Section 4 discusses the results, and section 5 concludes. Lastly at the end of the paper the appendix and references can be found.
1
2.
Literature review
2.1
German economy
Germany's economy being a bank based economy comes from the fact that banks supply the larger part of the capital needed. This is a result of the fact that banks and lenders have a longer and more intensive relationship and are thus able to impose lending conditions specifically tailored for the lender. Further banks can exploit their economies of scale to mobilize capital faster and cheaper. However opponents of bank based economies argue that in a liquid-, market-based market investors will invest smaller sums of money in order to achieve a diversified portfolio, this will lead to a better valuation compared to large corporate sums being loaned by bankers. Further, the faster and more accurate valuation that typifies a market-based economy should clarify managerial compensation, also the thread of a hostile takeover motivates managers to exercise great caution in decision making (Levine, 2002).
The increasing growth of the market-based economy in Germany, deriving from a growing stock market, results in more options to companies to address their financing needs. The share index is measured by the DAX index (Boerse-Frankfurt, 2016). The recent growth is in a great part the result of the founding of the Neuer Market in 1997. This Neuer Market or New Market is part of the Frankfurt stock exchange and is focused on providing capital for young and high-tech companies which also entails a higher risk for investors. This Neuer Market was a huge success and resulted in an explosion of IPO's in Germany (Vitols, 2001). The Neuer Market is expected to have co-accounted to a large part to the increase of publicly traded German companies in the time frame 1989 to 753 in 2001 (Nowak, 2001).
2.2
Capital structure theories
Since the early work of Modigliani & Miller (1958) ,who stated that the value of a firm is equal between levered and unlevered firms, thus implying capital structure does not affect the value of a firm. Much has changed since the publication of this work, as the original work of Modigliani and Miller did not include; taxes, transaction costs, bankruptcy costs, agency costs, information asymmetries and differences in interest rates. After a follow up on the original work in the form of a publication in 1963 by Modigliani & Miller (1963) several researches have been published for instance by Jensen and Meckling (1976), Myers, (1977), DeAngelo & Masulis, (1980), Myers (1984), Myers and Majluf (1984) Rajan and Zingales (1995) and Frank and Goyal (2007). Deriving from this research the current financial literature offers two main models which try to explain the capital structure of firms. These two models are the static trade of theory and the pecking order theory, both try to explain the capital structure but do so coming from different angles.
2.3
Static trade off theory
The starting point in capital structure literature by Modigliani and Miller (1958) is a model that does not include personal taxes, differences in borrowing rates and transaction costs. Modigliani and Miller (1958) state that firstly, the value of a firm is indifferent of its capital structure. And secondly the cost of capital increases as the capital structure of the firm contains more debt (Modigliani & Miller, 1958). However the researchers also assumed a perfect capital market in addition to the absence of personal tax,
Recent literature on static trade off theory suggests that there is a benefit to debt; the tax deductibility of interest. However most theories also include agency benefits of debt such as the reduction of free cash flow available to managers, the agency theory will be discussed in the next paragraph. There are also costs of debt which are presented in literature as bankruptcy costs, these are a function of the cost of bankruptcy and the chance the firm will go bankrupt (Fama & French, 2002). The expected capital structure under the static trade off theory is a trade off between the tax shields available to the firm and the costs of financial distress, as shown in figure 1.
Figure 1 Static trade off theory (Myers, 1984: p.577).
German taxes
German corporate tax accounts for most part of the benefit of debt and thus is a significant factor in the static trade off theory for Germany. German corporate tax or “Körperschaftsteuer” is the German corporate income tax and is currently rated at 15%. Secondly a local tax is imposed called the Hebesatz or Solidaritätszuschlag, which is translated at solidarity surcharge, this tax is calculated at a rate of 5.5% of the paid Körperschaftsteuer. Combining the two corporate taxes, a tax rate of 15.825% is found. Lastly the Steuermesszahl or Gewerbesteuer is added. Until 2008 this last factor of German corporate tax was to be determined by municipalities, from 2009 onwards however the Steuermesszahl or Gewerbesteuer is unambiguous throughout the country (Bundesministerium der Finanzen, 2016). Currently the
Steuermesszahl or Gewerbesteuer is a progressive tax system that uses the following rates;
Untill 12.000 Euro 1% Untill 24.000 Euro 2% Untill 36.000 Euro 3% Untill 48.000 Euro 4% Over 48.000 Euro 5%
(Bundesministerium der Finanzen, 2016)
In 2016 the average corporate tax rate is found to be 29,72% 2. (KPMG, 2016)(PriceWaterhouseCoopers, 2016).
Bankruptcy costs
Costs of debt measured as bankruptcy costs can be split into two forms, which are: direct costs, these consist of costs directly linked to the bankruptcy, such as legal costs and management time. Indirect costs consist of changes in the firm’s investment behaviour, given the increased possibility of a default and foregone business as a result of a loss of trust from business relations (Drobetz & Fix, 2005). Further agency conflicts between stock- and bondholders are also reckoned among the costs of debt, these conflict will be set forth in the next paragraph. Trade of theory suggests that the optimal capital structure will be a trade-off between the benefits and the costs of debt and that the optimal capital structure will be in equilibrium (Fama & French, 2002).
Mean reversion
A result of an optimal capital level for a firm would mean that every firm would constantly try to reach this optimal capital level, despite random events that disturb the adjustment to this optimal capital level (Shyam-Sunder & Myers (1999). This would imply that mean reversion is taking place constantly for the capital level. De Miguel and Pindado,(2001)prove that bank based economies, like Germany, bear smaller transaction costs in contrast to their market based economy counterparts. This phenomenon can be explained by the fact that these firms, as a result of tighter bank firm relationships, hold more debt and a debt based capital structure proves cheaper to alter than an equity based one. However in testing the theory by Shyam-Sunder and Myers (1999) the findings conclude that capital structure does revert to the mean very slowly, but the researchers conclude that this amount of mean reversion can’t be ascribed merely to mean reverting, and thus reject the hypothesis that mean reversion is in order. A possible explanation for this slow adjustment is given by Frank and Goyal (2007) who argue that contrary to what one might expect, the adjustment costs would increase with the size of the adjustment and thus large and fast adjustments would be very costly. Further Frank and Goyal (2007) find mean reversion to be applicable in their research, along with a series of other researchers. Frank and Goyal (2007, p.51) conclude that “the rate of mean reversion is not a settled issue”. This could possibly be explained by a
2
trade off on mean reversion, advocating a target leverage ratio, and the incremental adjustment costs advocating a slow adjustment.
Dynamic models
The latest addition to capital structure research has been in the field of dynamic models. Researchers such as Leary and Roberts (2007), Hennessy and Whited (2005) have presented dynamic trade-off models, these models differ from the known static models because they not only reflect taxes, bankruptcy-, and agency-costs but may also imply other factors such as the adjustment speed to the target capital structure, retained earnings and mean reversion (Frank & Goyal, 2007).
2.4
Agency costs
“An agency relationship is defined as a contract under which one or more persons engage another person to perform some service on their behalf which involves delegating some decision making authority to the agent. If both parties to the relationship are utility maximizers there is good reason to believe that the agent will not always act in the best interests of the principal” (Jensen & Meckling, 1976, p.308). In the article published by Drobetz and Fix (2005) the researchers conclude that current literature distinguishes between three forms of agency costs which are: risk shifting, the underinvestment problem and the free cash flow hypothesis. These three forms of agency costs are discussed in the following paragraphs. The agency theory is often included in both static trade off- as well as pecking order-theory research, to account for deviations from the theory.
Free cash flow
“Free cash flow is cash flow in excess of that required to fund all projects with positive net present values” (Drobetz & Fix, 2005, p.77). The free cash flow hypothesis states that managers will spend the money they are promised no matter the net present value of the projects. This potentially means that firm money is spend by managers on projects that have low or negative net present values, while better alternatives might be available for other managers. This phenomenon is in conflict with the interest of shareholders who demand the firms money to be distributed among projects as efficiently as possible and with the highest return. Further Fama and French (2002) ad that, as a result of this hypothesis firms with more profitable assets and thus a more positive net present value “commit a larger fraction of their pre-interest earnings to debt payment and dividends”(Fama & French, 2002, p.7). This also means that firms with many positive net present value projects will have higher capital needs and are less likely to distribute cash flow by means of dividends or share repurchases (Fama & French, 2002). The solution suggested to this problem in current literature such as Drobetz and Fix (2005) and Fama and French (2002), points in the direction of using debt rather than equity. The reason for favouring debt over equity in this occasion comes from the fact that debt requires contractually obliged interest payments, as opposed to equity that will only pay out dividend or repurchase shares in the event of excess cash flow after managers’ spending (Drobetz & Fix, 2005). And as a result will set a lower limit for the return that needs to be made by the manager, this will be an incentive to invest merely in projects with returns above this limit.
Risk shifting
research. For instance Barnea, Haugen, and Senbet (1980)find that short-term debt is used more when the potential costs of risk shifting is high. This comes from the fact that the shorter duration of the contract will reflect the true risk of the company (including risk shifting) better and thus this will be reflected in a higher (lower) interest level (Barnea et al, 1980). Leland (1998) however proves that risk shifting costs are low in comparison to tax benefits thus favouring long term debt over short term debt. The study by Eisdorfer (2008) concludes that risk shifting behaviour is affected by the ability and
incentive of shareholders to shift additional risk to bondholders. “These characteristics consist of the type of debt (secured or not), growth options, regulation and managerial incentives”( Eisdorfer, 2008, p.634).
Underinvestment
The underinvestment problem posits that managers, in following stockholders preferences, will forgo safe positive net present value projects. The rationale behind this behaviour comes from the fact that bondholders will profit most from these projects as their proceeds are a fixed amount written down in a contract. According to Myers (1977) stockholders pay the full cost of investment because the value of the stock will decrease given the reduction in cash flow following the investment. The benefits of the investment however have to be shared with the debt holders who still require their interest payments (Myers, 1977). Thus stockholders will pressure managers to under invest in order to maximize profits, which will reflect in growing stock returns. Drobetz and Fix (2005) argue that the underinvestment problem will be larger for highly leveraged firms in financial distress, as the interest costs are already very high and thus the hurdle for shareholders to benefit is very high.
2.5
Pecking order theory
The pecking order theory was introduced by Myers (1984), and it predicts a hierarchical order in the preference of attracting certain types of capital. Pecking order theory predicts that firms will prefer using internal financing before external financing. Lopez-Garcia and Sogorb-Mira (2008) state that thus the capital structure will reflect the need for external financing, deriving from a positive influence from the amount of positive net value projects available and a negative influence on the external capital needs by the internal funds available for the firm (Lopez-Garcia & Sogorb-Mira, 2008). As internal financing consists of cash and short term investments, all firms keep these forms of internal financing. Frank and Goyal (2007) argue that the reason these funds are held are outside of the pecking order theory and are much more likely to appear on balance sheets for daily business purposes.
3.
Methodology and dataset
3.1
Research question
The main objective of the research is to test whether the leverage level in Germany can best be explained by using either the static trade off theory, or the agency theory. To research these theories several hypotheses will be stated in the following paragraph. In order to study the main objective however the main research question has to be answered. The main research question will be formulated as:
Is the capital structure for listed German firms best explained by the static trade off theory or by the agency theory?
3.2
Hypotheses
In order to test the main research question for the German market, several hypotheses need to be tested. The hypotheses will be drafted according to the six factor model. This model is derived from previous literature and it describes the variables used in this study, a more extensive description of the six factors can be found in paragraph 3.4.
Tangibility
Static trade off theory suggest tangibility to have a positive effect on the debt level. The rationale behind this suggestion is that the collateral needed for debt is mostly presented in the form of tangible fixed assets. Agency theory agrees on the positive effect of tangibility on debt for a fairly similar reason. Tangibility is thought of as a guarantee to bondholders, the more tangible the firm’s assets the more likely the bondholder is to receive his share in the case of liquidation. Thus following both the agency theory and the static trade off theory, the first hypothesis is stated:
H1: Tangibility has a positive effect on leverage.
Firm size
Firm size is expected to have a positive relationship on leverage according to the static trade off theory. This comes from the fact that large firms are more diversified and have economies of scale, which enable them to better attract debt. However research has shown that for Germany this might in reality not be the case given the tight relations between firms and debt holders. Following the agency theory one would expect a positive relationship given the free cash flow problem resulting in a preference towards debt as it has a disciplining role on managers. Following both the static trade off theory and the agency theory the second hypothesis is stated as:
H2: Firm size has a positive effect on leverage.
Growth opportunities
bankruptcy costs increase. Agency theory expects a negative relationship between growth and leverage as leverage would increase agency conflicts. As growth is often closely related to risk, the problem of risk shifting is present. This would mean the firm accepting a high risk problem which net present value however is not sufficiently high to cover the risk. Thus, following the static trade off theory and the agency theory the third hypothesis is stated as:
H3: Growth has a negative effect on leverage.
Profitability
Static trade off theory predicts a positive relationship between profitability and leverage because of the tax deductibility of interest payments. As profits are high or increase, firms will become increasingly interested in the tax deductibility of interest payments. Agency theory also predicts a positive
relationship, however the limiting function of the free cash flow theory might limit managers to much in a highly profitable firm. Complementary to the free cash flow hypothesis, the risk shifting problem is also applicable. Managers might accept high risk positive net present value projects whose net present value is not in line with the projects risk, the free cash flow hypothesis would then favour debt. Following the static trade off theory and the agency theory profitability is expected to positively affect leverage. Thus the fourth hypothesis is stated as:
H4: Profitability has a positive effect on leverage.
Volatility
The variable volatility is expected to negatively affect leverage following the static trade off theory. The reason for this negative effect is the increased risk. Similar to this increased risk bankruptcy costs also increase, which makes it both harder and more costly to obtain debt. Agency theory predicts a positive relationship as the risk of underinvestment and risk shifting are present in the search for a more
continuous result by managers. Managers might resort to underinvestment to keep cash flow at a more positive level by not investing in a positive net present value project. Further risk shifting might occur at the other end, when the demand for positive net present value projects is high the firm might accept positive net present value projects whose risk to high. A higher level of debt will increase the controlling role of debt holders and thus discourage underinvestment and risk shifting. Following static trade off theory volatility is expected to negatively affect leverage. However following the agency theory volatility is expected to positively affect leverage. Thus the fifth hypothesis is stated as:
H5a: Volatility has a negative effect on leverage.
H5b: Volatility has a positive effect on leverage.
Taxes
advantage of interest-tax deductibility. Agency theory is rather indifferent on taxes. Thus the sixth hypothesis is stated as:
H6: Tax has a positive effect on leverage.
3.3
Model
In order to test the static trade off- and agency-theory for German firms the hypotheses stated in chapter three will be tested. This will be done by an ordinary least square regression (OLS) where the dependant variable will be leverage as described in chapter 3.3. This research will follow traditional research on the subject of both the static trade off theory and the agency theory, by using a six factor model widely used in previous research for instance by Wald (1999), Fama and French (2002), Gaud et al. (2005), Drobetz and Fix (2005). The regression will be analyzed with the use of the program SPSS. This research aims to test the following regression model:
Leverage= α + 1 * TANGIBILITY₋₁ + 2 * FIRM SIZE₋₁+ 3 * GROWTH₋₁+ 4 * PROFITABILITY₋₁ + 5VOLATILLITY₋₁ + 6TAXES₋₁+ 7DUMMY INDUSTRY₋₁+ε
The dependent variable leverage is measured in four ways. For the independent variables the relationship between leverage and the dependent variable T-1 year will be measured. The lagged variable is implemented in order to better predict the dependent variable. The dependent variable is measured at time zero. The main leverage measure however will be total debt to total assets. The other leverage variables will serve as an advanced analysis and as a robustness test.
3.4
Dependent variable
[image:14.612.99.512.147.348.2]The dependent variable leverage will be measured in four ways, following research by Rajan and Zingales (1995) and Drobetz and Fix (2005). This decision has been made because measuring the dependent variable leverage in four ways is far more complete than is being done in other comparable researches
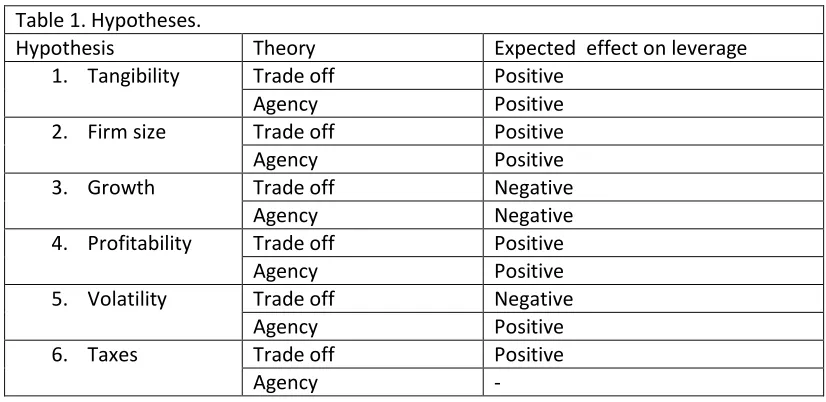
Table 1. Hypotheses.
Hypothesis Theory Expected effect on leverage 1. Tangibility Trade off Positive
Agency Positive 2. Firm size Trade off Positive Agency Positive 3. Growth Trade off Negative
Agency Negative 4. Profitability Trade off Positive
Agency Positive 5. Volatility Trade off Negative
Agency Positive 6. Taxes Trade off Positive
such as research by Lopez-Garcia and Sogorb-Mira (2008) and by De Jong (2002), who only use one parameter for measuring debt. Further Gaud and Joni (2005) use two measures as well as Wald (1999). Ampenberger, Schmid, Achleitner & Kaserer (2013) use three parameters. However De Jong, Verbeek and Verwijmeren (2011), use four parameters for measuring leverage however they divide their leverage parameter between static and two target adjustment models. Thus the four parameter model used by both Rajan and Zingales (1995) and Drobetz and Fix (2005) is both the most extensive and the best fit. Further given the similarities between the research by Drobetz and Fix (2005), who investigate a sample of 124 Swiss firms on both the static trade off theory as well as the pecking order theory, the leverage measures are expected to fit best to the current research. Lastly, differentiating between long- and short-term debt is expected to make a larger difference because according to Wald (1999) “German accounting standards define long term as being over four years, while other countries define “long term as being over one year only” (Wald, 1999, p.177). As a result debt with a longer duration is expected to be less frequently issued and consequently will be more stable.
The first, and most broadly used measure, of leverage in literature is total debt in relation to total assets. This measure is used to measure the ratio of debt in relation to the total book value of the firm.
“However, this measure does not provide a good indication of whether the firm is at risk of default in the near future. In addition, since total liabilities also include items like accounts payable, which are used for transaction purposes rather than for financing, it is likely to overstate the amount of leverage. In
addition, this measure of leverage is potentially affected by provisions and reserves, such as pension liabilities”(Drobetz & Fix, 2005, p.79). Total debt will be measured by combining the measures of both short- and long-term debt.
Secondly the short term debt to total assets will be measured. However as short term debt is unavailable in the data the current liabilities will be used, these consist of provisions & postponed taxes + debts payable after 1 year (Orbis, 2011,p.421). This measure is not a perfect measure for short term debt as stated by Drobetz and Fix (2005), who state that provisions and postponed taxes will overstate the measure.
Thirdly the long term debt to total assets will be measured. Long term debt is defined as the sum of: Long term debt + Long term liabilities from financial leasing + Long term liabilities at fair value through profit and loss (Orbis, 2011,p.422). The objective of measuring long term debt is measuring the company’s current state of adjustment towards its optimal capital structure, as long term debt is expected to be less frequently altered.
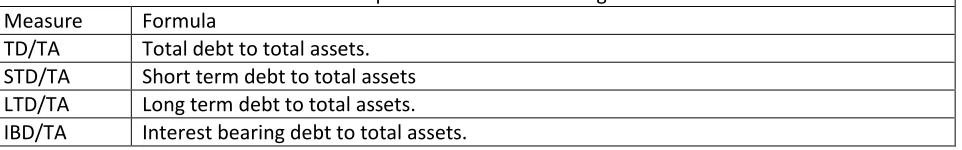
Table 2. Measures and formulas of the dependent variable “leverage”. Measure Formula
TD/TA Total debt to total assets. STD/TA Short term debt to total assets LTD/TA Long term debt to total assets. IBD/TA Interest bearing debt to total assets.
3.5
Independent variables
In order to test whether the dependent variable leverage can be explained by either the static trade off theory or the agency theory, a six factor model is composed. These independent variables are expected to explain the dependent variable leverage for the selected German sample. In line with the method that is practiced by most researchers, the research will be done by using book values. Only growth will be measured as the ratio of the market to book value. The rationale for using book value instead of market value is described by Wald (1999), as being the more stable measure. Lastly the relationship between the independent variables will be tested with the dependent variable of the following year, resulting in a T-1 design for each independent variable. An exception to this rule is the volatility measure, which will measure volatility in a time frame of three, four or five years in the past.
Tangibility
Tangibility, or gearing level, is expected to influence the capital structure to a large extend. The presence of tangible assets in a firm are the best known collateral for firm’s to attract debt. Especially in a bank based economy like Germany with tight relationships between lenders and banks, tangible assets are of vital essence to attract capital. This is particularly true for smaller companies who are not yet able to access to enter the public equity market (Levine, 2002). However Rajan and Zingales (1995) do not find large differences in their cross country research between book leverage for the different market and bank based countries. This finding contradicts common rationale which states that firms in market based countries are better able to attract debt given the tighter bank firm relationships (Levine, 2002).
Following agency theory, in order to manage agency problems firms are expected to attract debt in order to discipline the financial behaviour of managers. Also Jensen and Meckling (1976) and Myers (1977) mention the shareholder bondholder conflict (see paragraph 2.4), this might be possible however when debt is secured against tangible assets bondholders are better off in case of a liquidation (Drobetz & Fix, 2005). Thus tangible assets might be a way for bondholders to control for this possible conflict. This phenomenon where tangibility is very similar to collateral will however be stronger in the case of fixed non financial tangible assets. However due to data constraints the effects of eliminating financial tangible assets from the equation can’t be measured. Tangibility will be measured following the most commonly used measurement in literature; the ratio of fixed tangible assets to total assets (Tang).
Firm size
smaller informational asymmetries and thus are better able to issue informational sensitive securities, thus should be less reluctant to issue equity and should have lower debt levels(Rajan & Zingales, 1995). Agency theory also expects a positive relationship given the free cash flow problem, debt could help tackle this problem given its disciplining role on managers. However Rajan & Zingales (1995) conclude that they find a positive relation between size and leverage for most countries. For Germany both Rajan and Zingales (1995),Kremp, Stöss and Gerdesmeier (1999), find a negative relationship between firm size and leverage. Kremp et al. (1999) states that this finding is due to “characteristics of the Hausbank system which offers better protection to creditors than other countries” (p.644). Firm size will be measured following the most commonly used measurements in literature; natural logarithm of total sales (Size1) and the natural logarithm of total assets (Size2). Where both total sales and total assets are denoted in thousands of Euro’s. Further the natural logarithm divides the amount depicted in thousands of Euro’s by 10.000.000.
Firm growth
Growth of the firm is expected to be negatively related to the leverage ratio contradicting the outcome of the research by Rajan and Zingales (1995). However several other researchers like Titman and Wessels (1988) and Wald (1999) have found a negative relation between growth of the firm and leverage. This would be in agreement with the agency theory as the stockholder-bondholder agency conflict predicts that the costs of debt include underinvestment and asset substitution (Drobetz & Fix, 2005). Contrary to this stockholder-bondholder conflicts however Wald (1999) states that “German and Japanese banks own both debt and equity” (Wald, 1999, p.182) thus in Germany this effect is expected to be irrelevant. Furthermore a high growth firm is expected to have more positive net value investments and thus the disciplining role of leverage by reducing cash flow is unnecessary (Drobetz & Fix, 2005). Arguments against a negative correlation between growth and leverage can also be made, Rajan & Zingales (1995) for instance argue that firms tend to issue equity as the stock is priced relatively high, also after testing this hypothesis they find it to be true however the tests are not significant. Further Rajan & Zingales (1995) give the possibility that debt is more expensive to high growth firms given their increased
probability of failure, and thus would scare the risk averse debt holder. Growth will be measured by the market value of equity and the book value of debt, divided by the book value of total assets (Growth).
Profitability
research. Wald (1999) finds a small negative correlation for Germany, contrasting other countries far more negative relationship. As an explanation Wald (1999) argues the informational asymmetries to be smaller in bank based economies. Profitability will be measured following the most commonly used measurements in literature; ratio of net profitability and preferred dividends to total assets (Prof1) and the ratio of EBITDA over sales (Prof2) (Titman & Wessels, 1988) (Drobetz & Fix, 2005).
Volatility
The risk of financial distress will be measured as volatility following Drobetz & Fix (2005), Gaud et al (2005),Titman and Wessels (1988), De Jong et al (2011) and Kremp et al (1999). Volatility is expected to be negatively related to leverage as the volatility goes up the Alpha of the firm’s stock will rise giving the firm a more risky perspective towards bondholders. This increase in risk and in Alpha will also be noticed by debt holders resulting in a higher cost of debt (Drobetz & Fix, 2005). Agency theory predicts a positive relationship as the risk of underinvestment and risk shifting are present in the search for a more
continuous result by managers. Managers might resort to underinvestment to keep cash flow at a more positive level by not investing in a positive net present value project. Further risk shifting might occur at the other end, when the demand for positive net present value projects is high the firm might accept positive net present value projects whose risk to high in respect to their benefits. A higher level of debt will increase the controlling role of debt holders and thus discourage underinvestment and risk shifting. Risk of financial distress, or volatility, will be measured by a lagged average of the standard deviations of the differences in earnings for the last three, four, and five years, divided by the average total assets during the period. Where earnings are measured as EBITDA. The variable to be used for the regression model will be determined by the best fit in the regression analysis.
Taxes
Among other factors the static trade off theory ascribes a benefitting role to tax deductions. There are two ways for firms to achieve higher tax deductions, firstly by taking on more debt and paying more interest. Secondly by making use of non debt tax-shields, usage of the non debt tax-shield comes in the form of lowering net profits in order to pay less taxes. Static trade off theory suggests a positive relation between tax-shields and leverage, as firms can benefit from taking on debt. Agency theory is rather indifferent on taxes. Examples of items that are mostly subject to the non debt tax-shield are; increased depreciation, depletion allowances and investments (DeAngelo & Masulis, 1980). By inflating these items the net profit will be minimized thus minimizing the tax bill. The static trade off theory suggest maximum usage of the tax shield that is available, however when a firm uses a non debt tax-shield this would imply the tax shield from debt does not suffice (Drobetz & Fix, 2005). Non debt tax-shields will be measured following the measurements used by Drobetz and Fix (2005); total depreciation divided by total assets(TAX1). And the ratio of depreciation over EBITDA(TAX2) (Drobetz & Fix, 2005).
Dummy variables
industries acknowledged in SIC coding. The only industry not present in this dataset is the financial sector which is excluded actively and therefore doesn’t need a dummy variable.
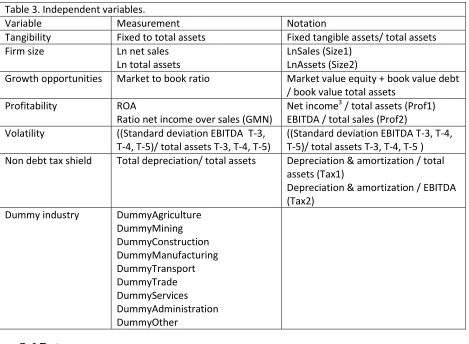
Table 3. Independent variables.
Variable Measurement Notation
Tangibility Fixed to total assets Fixed tangible assets/ total assets Firm size Ln net sales
Ln total assets
LnSales (Size1) LnAssets (Size2)
Growth opportunities Market to book ratio Market value equity + book value debt / book value total assets
Profitability ROA
Ratio net income over sales (GMN)
Net income3 / total assets (Prof1) EBITDA / total sales (Prof2) Volatility ((Standard deviation EBITDA T-3,
T-4, T-5)/ total assets T-3, T-4, T-5)
((Standard deviation EBITDA T-3, T-4, T-5)/ total assets T-3, T-4, T-5 ) Non debt tax shield Total depreciation/ total assets Depreciation & amortization / total
assets (Tax1)
Depreciation & amortization / EBITDA (Tax2)
Dummy industry DummyAgriculture DummyMining DummyConstruction DummyManufacturing DummyTransport DummyTrade DummyServices DummyAdministration DummyOther
3.6
Data
The dataset contains information on 646 companies which are subject to the research of the effect of static trade off- and agency-theory in the German market. Measurements for the variables come from annual reports of the most recent years available. Further because of the differences in capital structure, following from factors specific to the sector, financial companies are left out of the sample 4.
For data collection the program ORBIS is used, provided by Bureau van Dijk. This program has all annual reports from every company around the world that publishes annual reports listed in a unified
framework. The data that is exported for the purpose of research meets the criteria of being listed at one of the following stock exchanges: Boerse Berlin, Boerse Duesseldorf, Boerse Frankfurt, Boerse Hamburg, Boerse Munchen, Boerse Stuttgart, XETRA Stock Exchange (ORBIS, 2016). This yields a result of 982 companies that are listed at the pre mentioned exchanges. Secondly in order to focus only on German firm a country filter on Germany is set excluding 158 companies, leading to a result of 824 companies. Lastly the pre mentioned filter on SIC codes is set in order to leave out financial firms. With this filter another 178 companies are excluded, leading to a sample of 646 companies. This sample of
3 Due to data constraints Net income is measured as net profitability + preferred dividends 4
646 companies is in agreement with the site of the German stock exchange (Deutsche Borse Group, 2016).
The time frame chosen to measure is the last available data, this comes down to data that is available from 2003 until 2016 for the market values. This results in 14 firm year observations for 646 companies, resulting in 9044 potential observations. However as only market values yield 14 firm year observations the book values, as used in this research, yield data from 2006 until 2015. These 10 firm year
observations for 646 companies give the actual amount of observations: 6460.
Dependant variable
The dependant variable leverage is measured in four different ways as explained in paragraph 3.3. Every leverage measure will be a lagged by one year thus measuring the leverage level of the year before. The usage of a lagged model will give a better understanding of the independent variables’ correlation on the dependant variable leverage.
All dependent variables have been winsorized at the 99% level in order to correct for outliers. Extreme values such as zero or one are still found in the current dataset. However, in theory, these values are not impossible. However values of zero, meaning that there is no debt present in the company. Or one, meaning there is no equity present in the company, will only be possible in extreme cases such as for a example a (near) bankruptcy case.
Independent variable
Table 4. Summary statistics variables.
Summary statistics for the dependant variable leverage as measured by the four measures depicted below. Data comes from German firms listed at the German stock exchange. The sample period is 2006-2015. Financial companies are excluded on the basis of SIC codes. All measures have been calculated by using measures denominated in thousands of Euros extracted from annual reports. Tangibility is measured as: fixed tangible assets to total assets. Firm size1 is the natural logarithm of sales. Firm size2 is the natural logarithm of assets. Growth opportunities is Market value of equity + book value of debt to book value of total assets. Profitability1 Net profitability + preferred dividends to total assets. Profitability2 is EBITDA to total sales. Volatility is standard deviation of earnings for 3,4 and 5 years. Non debt tax1 is depreciation and amortization to total assets. Non debt tax2 is depreciation and amortization to EBITDA.
N
N in
regression Mean Median
Std.
Deviation Minimum Maximum Independent
variables
Tangibility 5241 1789 0.2078 0.1409 0.2212 0.0000 0.9991 Size1 4858 1789 0.7151 0.7136 0.1760 0.0000 1.1899
Size2 5241 1789 0.7216 0.7134 0.1619 .1591 1.2260 Growth 5170 1789 0.5140 0.5456 0.2559 0.0000 1.2495 Profitability1 4565 1789 0.0447 0.0331 0.0822 -.1197 0.9554 Profitability2 4614 1789 0.1136 0.1016 0.1953 -.9903 .9958 Volatility 3Y 4670 1789 0.1768 0.0761 0.2955 0.0000 2.1899 Volatility 4Y 4187 1789 0.2080 0.0920 0.3478 0.0000 3.0614 Volatility 5Y 2690 1789 0.1943 0.0913 0.3424 0.0000 3.6435 Tax1 9040 1789 0.0269 0.0036 0.0531 0.0000 1.4016 Tax2 4711 1789 0.2384 0.2771 0.5361 -4.9351 1.5201 Dependent
variables
Totaldebttotalassets 5241 1789 0.5183 0.5483 0.2581 0.0000 1.0000 Std/total assets 5241 1789 0.2951 0.2643 0.1986 0.0000 1.0000 Ltd/total assets 5241 1789 0.1406 0.0745 0.1812 0.0000 1.0000 Interest Bearing
Control variables
Several researchers have studied the subject of capital structure and the relation with static trade off theory and agency theory. Most studies however are cross country studies rather than studies focused on one country. In the current research the research of Lopez-Garcia and Sogorb-Mira (2008) and Chen and Strange (2005) will be followed, these researchers also study merely one country (respectively Spain and China) countries that are similar to Germany given their bank based economies. Both studies control for size and for industry. As size is an independent variable in current research, only industry will be controlled. This will be done by using the pre-mentioned dummy variable for industry.
Multicollinearity
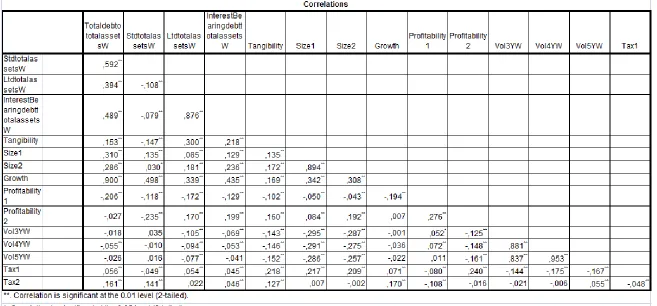
Multicollinearity should be addressed as it could decrease the ability to predict the dependent variable, which in this case is the capital structure. Multicollinearity will be measured with the use of the Pearson correlations matrix, which tests for multicollinearity at the 95% and 99% significance level. The
significance level indicates whether the correlation measure will hold in either 95- or 99% of the cases. The measure however is the most important, indicating a perfect positive relationship between the measure when it is one, and a perfect negative relationship when it is minus one.
The Pearson correlation matrix, which can be seen in table 5, shows some correlation between the measures over time. Mostly between the two size measures, natural logarithm of sales and the natural logarithm of total assets. This is however expected as these measures are meant to measure the same variable. The same can be observed for the three volatility measures. More alarmingly however is the tangibility measure which is correlated with size, growth, profitability and taxes. Further profitability measures are also highly correlated with tangibility, size, growth, volatility and taxes. This should however be no problem. Though some caution should be exercised in analyzing the results derived from the interaction of these measures.
Another way to measure multicollinearity is by using the Variance Inflation Factor (from now on VIF). The VIF measures how much of the variance is increased because of collinearity, and thus measures
4.
Results
This chapter discusses the results of the regression analysis that was ran in order to test the hypotheses stated in chapter two. The results of the regression analysis are unstandardized as these values give the more distinct explanation for the relationship as opposed to standardized measurements. The multiple linear regression has been ran several times in order to find the best variables based on the main leverage variable, total debt to total assets. The findings from these regressions are that profitability will be measured as net income / total assets (Prof1), volatility will be measured by the three year measure and taxes are measured by depreciation and amortization/ total assets (Tax1). Lastly size will be
measured by the natural logarithm of sales (Size1). Choices for these measures have been made because this dataset yields the highest R square. The chosen variables represent the static trade off theory, the agency theory will not be tested in a separate model as the only difference would be the omitting of the variable tax. In order to prevent omitted variable bias, conclusions will be made on basis of the static trade off theory model only.
The total debt to total assets model, as depicted in table 6, shows a low R square for the model with only the control variables included, the static trade off model however has a high R square, implying a model that explains a large part of the variance. In the static trade off theory model the F value is large and significant at the 99% confidence interval confirming the conclusion from the R square, the model explains a large amount of the variance and very little error terms are present. To test for
multicollinearity Hair et al. (2014) suggest a VIF to be no larger than 10. Table 6 denotes the largest VIF value found, the largest value is 6.3789, thus multicollinearity is not expected to be a problem. Lastly it can be observed that the sample size drops quite dramatically from the control variable model to the other static trade off model, however the number of observations for both models is still sufficiently large.
Firm growth is expected to have a negative relationship on leverage. However table six shows a large positive beta statistic. This would be in agreement with Wald (1999) who also finds a positive
relationship, however not as large. However Rajan & Zingales (1995) find a small negative relationship for Germany. Further, research by Drobetz and Fix (2005) Gaud et al (2005) and Huang and Song (2006) who all research capital structure of bank based economies (respectively Switzerland for the first two and China for the latter) find negative relationships. Explanations for the these findings can be found in the researches by Rajan & Zingales (1995) and Wald (1999). From the information provided in paragraph 3.4 Wald (1999) concludes that deriving from the fact that German banks own both stock and bonds, the relation should be neither positive nor negative. Following the strong positive relationship found in the current data the explanation by Rajan and Zingales (1995) would be better suited to current research, Rajan and Zingales (1995) state that debt is more expensive for high growth firms given their increased probability of default.
relationships are much stronger. For China, both Chen and Strange (2005) and Huang and Song (2006) find small positive relationships comparable with the results from this research.
Firm size is expected to have a positive effect on leverage following both the trade off- and the agency-theory. It can be seen from table six that the expected positive effect of size is present in the current sample of German public firms, however the statistic is small. Contrary to this finding both Wald (1999) and Rajan and Zingales (1995) find a negative relationship in their cross country research for size and leverage in their German sample. However research by Gaud et al (2005), Drobetz and Fix (2005), Chen and Strange (2005) and Huang and Song (2006) who all conduct a country specific research on bank based economies find a small positive effect. An explanation for this finding can be found in the German Haussbank system (Kremp et al. 1999) as mentioned in paragraph 3.4.
Profitability is expected to positively affect leverage following both the static trade off- and the agency theory. Contrary to both theories the total debt to total assets leverage measure yields a negative relationship. This negative relationship would be contrary to preceding research by Lopez-Garcia and Sogorb-Mira (2008), Gaud et al. (2005) and Drobetz and Fix (2005), who all research bank based economies. A possible explanation comes from Wald (1999) who also finds a small negative correlation for Germany. As an explanation Wald (1999) states that informational asymmetries are expected to be smaller in bank based economies.
Taxes should show a positive relationship on leverage following the static trade off theory. The measured variables however measure the non debt tax shield. The non debt tax shield is expected to be a
substitute for a tax shield, this would imply that a firm using a non debt tax shield is expect to have a low leverage level. Thus non debt tax shield is expected to be negatively related with leverage. However for the total debt to total assets measure a small positive measure is found. Existing literature reports different results on tax and capital structure, Drobetz and Fix (2005) find a small positive relationship while Chen and Strange (2005) and Huang and Song (2006) find a small negative relationship.
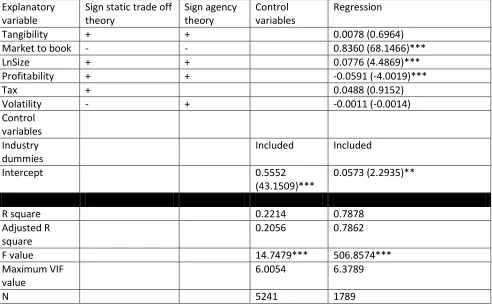
Table 6. Total debt to total assets regression.
The regression analysis table reports the regression results. Tangibility is measured as: fixed tangible assets to total assets. Growth opportunities is Market value of equity + book value of debt to book value of total assets. Profitability is EBITDA to total sales. Volatility is standard deviation of earnings for 4 years. Tax is depreciation and amortization to total assets. Firm size is the natural logarithm of sales. The regression contains eight dummy variables to control for industry (not depicted). The first number denoted is the beta value and between brackets is the T-value. *,** and *** denote two sided significance levels at respectively 10%, 5% and 1%.
Explanatory variable
Sign static trade off theory Sign agency theory Control variables Regression
Tangibility + + 0.0078 (0.6964)
Market to book - - 0.8360 (68.1466)***
LnSize + + 0.0776 (4.4869)***
Profitability + + -0.0591 (-4.0019)***
Tax + 0.0488 (0.9152)
Volatility - + -0.0011 (-0.0014)
Control variables Industry dummies
Included Included
Intercept 0.5552
(43.1509)***
0.0573 (2.2935)**
R square 0.2214 0.7878
Adjusted R square
0.2056 0.7862
F value 14.7479*** 506.8574***
Maximum VIF value
6.0054 6.3789
N 5241 1789
Table 7 shows the long term debt to total assets as well as the interest bearing debt to total assets. Because both measures are expected to give similar results the comparison between the two will be an interesting one. In line with the previous finding in the total debt to total assets model concerning the R square, the R square is low in the model with only the control variables and goes up for the regression model, however the figure is not as large as in table 6. However this outcome is an expected as the variables are chosen to best reflect the total debt. Again the F values are quite large and significant at the 99% confidence interval confirming the conclusion from the R square that is lower than the model in table 6, however still a fairly large amount can be explained by the model. VIF values do not pass the 10 threshold with a highest value of 4.7803. Lastly, again the sample size drops as the number of
Firm growth is expected to have a negative relationship on leverage. Table seven however shows a positive beta statistic, however not significant. Explanations for the these findings are handed by Rajan and Zingales (1995)they state that debt is more expensive for high growth firms given their increased probability of default.
Tangibility is expected to have a positive effect on leverage according to both the trade off-, and the agency- theory. Outcomes from both the long term debt- as well as the interest bearing debt- to total assets regressions show a positive beta statistic for tangibility that is however not significant.
Firm size is expected to have a positive effect on leverage following both the trade off- and the agency-theory. Table seven shows negative beta statistics that are all not significant. This finding could be explained by the German Haussbank system (Kremp et al. 1999) as mentioned in paragraph 3.4.
Profitability is expected to positively affect leverage following both the static trade off- and the agency theory. Table seven yields negative relationships for long term debt to total assets and interest bearing debt to total assets. This finding is similar to the finding in table six, extensive explanation on the finding can be found earlier in this paragraph.
Taxes should show a positive relationship on leverage following the static trade off theory. The measured variables however measure the non debt tax shield. The non debt tax shield is expected to be a
substitute for a tax shield, this would imply that a firm using a non debt tax shield is expect to have a low leverage level. The long term debt to total assets measure and interest bearing debt measure produce a small negative coefficient.
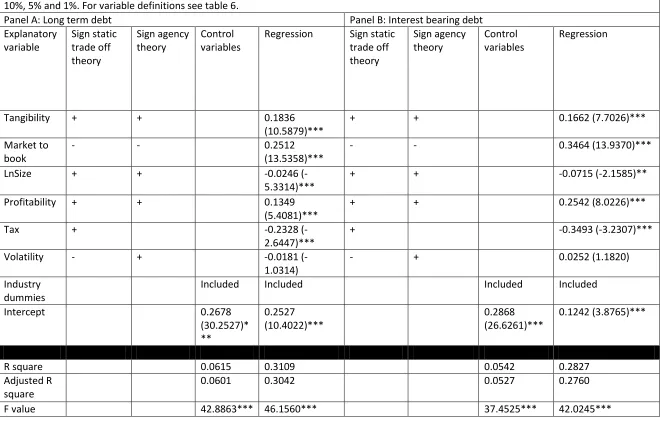
Table 7. Long term debt to total assets and interest bearing debt
The first number denoted is the beta value and between brackets is the T-value. *,** and *** denote two sided significance levels at respectively 10%, 5% and 1%. For variable definitions see table 6.
Panel A: Long term debt Panel B: Interest bearing debt Explanatory variable Sign static trade off theory Sign agency theory Control variables
Regression Sign static trade off theory Sign agency theory Control variables Regression
Tangibility + + 0.1836
(10.5879)***
+ + 0.1662 (7.7026)***
Market to book
- - 0.2512
(13.5358)***
- - 0.3464 (13.9370)***
LnSize + + -0.0246
(-5.3314)***
+ + -0.0715 (-2.1585)**
Profitability + + 0.1349 (5.4081)***
+ + 0.2542 (8.0226)***
Tax + -0.2328
(-2.6447)***
+ -0.3493 (-3.2307)***
Volatility - + -0.0181 (-1.0314)
- + 0.0252 (1.1820)
Industry dummies
Included Included Included Included
Intercept 0.2678
(30.2527)* ** 0.2527 (10.4022)*** 0.2868 (26.6261)*** 0.1242 (3.8765)***
R square 0.0615 0.3109 0.0542 0.2827
Adjusted R square
0.0601 0.3042 0.0527 0.2760
Maximum VIF value
3.8441 6.1039 3.8441 4.7803
4.1
Robustness test
Given the fact that the performed regression analysis already uses three measures for leverage one could argue that the outcome should be expected to be robust. However as these measures mostly focus on long term debt, for instance by the dependent variables long term debt or interest bearing debt. And also the total debt measure includes a large amount of long term debt. Thus as a robustness test the outcomes will be tested against the short term debt level of the sample and the differences will be highlighted. Secondly in appendix B a robustness test focused on testing with variables suited for short term debt is performed. This test uses independent variables that mostly did not perfectly fit to the total debt to total assets variable, these independent variables are tested against each independent variable.
[image:30.612.68.582.360.699.2]In summary table 8 shows that there are no differences in the outcomes for each independent variable in relation to short term debt. Table 9 does show differences, however as the independent variables differ this outcome is expected. Thus the results are robust.
Table 8. Short term debt to total assets.
The first number denoted is the beta value and between brackets is the T-value. *,** and *** denote two sided significance levels at respectively 10%, 5% and 1%. For variable definitions see table 6.
Explanatory variable
Sign static trade off theory
Sign agency theory Control variables Regression
Tangibility + + -0.1896 (-12.1241)***
Market to book - - 0.3554 (22.1066)***
LnSize + + 0.0593 (2.4177)**
Profitability + + -0.2126 (-10.1479)***
Tax + 0.1897 (2.4924)**
Volatility - + 0.0050 (0.3887)
Industry dummies Included Included
Intercept 0.2428
(24.4544)***
0.1028 (4.8910)***
R square 0.0171 0.3395
Adjusted R square 0.0156 0.3344
F value 11.3666*** 66.8969***
Maximum VIF value
3.8441 4.7803
5.
Summary and conclusions
In this study the static trade off theory and the agency theory have been tested in the German market by using a German sample. This sample consists of publicly traded firms, traded on one of the following exchanges Boerse Berlin, Boerse Duesseldorf, Boerse Frankfurt, Boerse Hamburg, Boerse Munchen, Boerse Stuttgart, XETRA Stock Exchange. Secondly, in order to allow for good comparison the dataset contains only German firms, thus foreign firms that are traded on either of the pre mentioned exchanges are excluded. The selected time frame is the most recent and most extensive time frame possible, which results in a time frame of 2006 until 2015.
In order to properly test the static trade off theory and the agency theory for the capital structure in the German market, six variables are selected from previous literature on static trade off theory and agency theory, which are likely to either have a positive or negative effect on leverage. These six variables, consisting of: tangibility, firm size, growth, profitability, volatility and taxes, are all hypothesized to have a significant effect on the dependent variable leverage, which is measured in four ways. In order to control for differences in industries the dummy variable industry is created. The six independent variables are then fitted to a model to best predict the main dependent variable total debt to total assets. This model is regressed against all four dependent measures by using an ordinary least squares linear regression model.
The outcome of the research, as described in chapter 4 results, is divided in: the main leverage variable total debt to total assets, a comparison between long term debt to total assets and interest bearing debt. And lastly the variable short term debt to total assets is included only as a robustness test, and thus will not be included in conclusions about the regression. Heteroscedasticity has been checked, the plots belonging to this test can be found in appendix A. From these plots can be concluded that the observations are rather homoscedastic. However this is not expected to be problematic as current research uses OLS, which gives equal weight to each observation. Thus homoscedastic observations that result in similar standard errors for each variable are desirable.
Firstly tangibility is expected to have a positive effect on leverage according to the static trade off theory. The rationale behind this expectation is the larger expected amount of collateral, and thus more
favourable conditions for a loan. Agency theory also predicts a positive effect as tangibility will
increasingly protect the bondholder from excess losses in the case of liquidation. These expectations are confirmed by the results from the regression, which show a positive relation for the total debt to total assets leverage measure. The other leverage measures produce a positive relationship. Thus a larger amount of tangible assets reported in the balance sheet of a German, listed firm implies a larger amount of debt.
total debt, however a negative effect for long term debt and interest bearing debt. An explanation can be found in the previously mentioned Haussbank system and the relationship between the bank and the lender deriving from this system. As bank loans are expected to be long term and interest bearing, firm size is negatively related to these loans given the relatively good relationship between bank and lender in Germany. However, following the main leverage measure, firm size is negatively related to debt. Thus if the size of the German publicly traded firm increases debt ratio’s will decrease.
Thirdly growth is expected to have a negative relationship with leverage following both the static trade off theory and agency theory. This comes from the expectation that growth will imply extra risk, thus debt will be priced at a higher rate. As the risk increases the equity financing will become a better fit for both the firm and the financer. Agency theory expects a negative relationship between growth and leverage as leverage would increase agency conflicts. As growth is often closely related to risk, the problem of risk shifting is present. However the results show growth to be largely positively related with all dependent variables. A possible explanation for this finding is the statement by Rajan and Zinagles (1995), they state that debt is more expensive for high growth firms given their increased probability of failure (Rajan & Zingales, 1995). An explanation can be found by the longstanding bank and lender relationship in Germany, which would favour debt. Thus growth of the firm is implied as a positive predictor for the debt ratio, at a slope of approximately 84%. Implying that as the total debt increases, the market to book rate will increase at a 84% rate and vice versa.
Profitability is expected to have a positive effect on leverage following both the static trade off theory and the agency theory. The reason for this positive effect is the tax deductibility of interest. As the profitability increases firms will be increasingly interested in lowering the increasing tax costs. Agency theory is less clear on the effect, on the one hand the free cash flow hypothesis with its limiting function of debt could work counterproductive. However the risk shifting problem would favour debt. The results show a negative relationship for profitability on all leverage variables. This negative relationship would be contrary to preceding research by Lopez-Garcia and Sogorb-Mira (2008), Gaud et al. (2005) and Drobetz and Fix (2005), who all research bank based economies. A possible explanation comes from Wald (1999) who also finds a small negative relation for Germany. Further Wald (1999) states, as an explanation, that informational asymmetries are expected to be smaller in bank based economies. Thus, as profitability increases the amount of debt is expected to decrease for German listed companies.
Volatility is expected to have a negative effect on leverage following the static trade off theory. The reason behind this expectation is the perceived increased risk as the volatility increases. This increased risk not only drives up interest rates but it also shifts the best fit for firm and funds toward equity
financing. Agency theory however predicts a positive relationship because managers might feel the need to control cash flow and as a result either reject or accept projects which in other cases would not have been accepted/rejected. Results show a negative relationship between volatility and total debt to total assets. The interest bearing debt to total assets measure and the long term debt to total assets measure produce negative results. Following the negative relationship the static trade off theory will be
Taxes are expected to have a positive relationship on leverage following the static trade off theory, while agency theory is indifferent on the subject. This expectation comes from the fact that the deductibility of interest costs lowers tax costs, thus debt would be used by firms to profit from this advantage. However the variable measured in this research is the non debt tax shield, this variable measures how much the firm lowers its taxes by other methods. Thus the non debt tax shield is a substitute for the interest deductibility, and thus non debt tax shield and leverage are expected to be negatively related as firms would not need to apply a non debt tax shield in the presence of a tax shield. However for the total debt to total assets measure a positive measure is found. Further the long term debt to total assets measure and the interest bearing debt measure both produce a small negative coefficient. Following the main leverage variable however there is a positive relation with leverage and non debt tax shield, thus implying a negative relationship between tax and leverage. Thus as the non debt tax shield increases leverage is also expected to increase for German listed companies.
This research does have some limitations. First due to data constraints it was not possible to measure the non financial tangible assets in the first profitability measure, thus the more general tangible assets has been used. This will reflect in outcomes that are less clear as the measure is probably distorted by fluctuations in financial tangible assets. Further for the first profitability measure, net income has been measured as net profitability + preferred dividends because of absence of the net income parameter in the data. However this is not expected to influence results as the outcome of measure in use should be equal to net income.
Current research contributes to the existing literature as single country research into capital structure for Germany are not found in the known Anglo-Saxon databases, that are written in English. As it is very well possible that comparable literature does exist, be it in other databases or in other languages than English (likely German). The time frame of current research will be an addition to this unknown research as the latest data has been used (2006-2015).