Improving
interoperability
between electric mobility and
the electricity system
Towards a reference architecture for charging electrical vehicles
Allard Brand
18 September 2013
Improving interoperability between electric
mobility and the electricity system
Towards a reference architecture for charging electric vehicles
MASTER THESIS
Author
Name: Allard Brand
Programme: MSc Business Information Technology Institute: University of Twente
School of Management and Governance
Enschede, The Netherlands
Student number: s0162744
E-mail: [email protected]
Graduation Committee
University of TwenteFirst Supervisor: dr. Maria-Eugenia Iacob Second Supervisor: dr. ir. Marten van Sinderen
Alliander
Formal supervisor: Jeroen Scheer, Manager TF ET-IT
Daily supervisors: Frank Geerts, IT Strategy Consultant, TF ET-IT Auke Hoekstra, IT Strategy Consultant, TF ET-IT
Acknowledgements
The past six months have been an exciting journey, dedicated to the last step in finishing my master ‗Business Information Technology‘ at the University of Twente: writing this thesis. I would like to express my sincere gratitude to those who helped me during this period.
First of all, I would like to thank Jeroen Scheer for giving me the opportunity to perform my master assignment at the taskforce ET-IT within Alliander. It was a great experience to be part of the taskforce, attend team meetings and participate in the many interesting discussions that were held on the fourth floor of Bellevue. I have met a lot of remarkable people who taught me valuable knowledge about electricity and the energy transition.
I would like to thank my supervisors from the University of Twente, Maria Iacob and Marten van Sinderen, for their guidance throughout the research project. Their feedback, whether it was enthusiastic or critical, helped me to structure and improve this thesis and to continue the project at tough points.
Likewise, I would like to thank my supervisors from Alliander for their invaluable feedback and support. I would like to thank Frank for introducing me into the field of electric mobility and providing me with valuable sources of information. I would like to thank Auke, in addition to his time and ideas, for challenging me to think outside the paved ways.
My gratitude also goes to my colleagues and fellow interns at Alliander, making my internship an enjoyable time. Eamonn, Frederique and Tjalle, thanks for sharing the journey. Next to our projects, I am grateful for our numerous discussions about life, work, and religion.
Finally I would like to express my gratitude to the people dearest to me. I would like to thank my parents and family for their love, support and wisdom throughout my life. Last, but not least, I would like to thank my girlfriend Mireille. Thank you for being part of this journey, even when being at a distance.
I hope that you will enjoy reading the current research. If you have any questions or comments, please do not hesitate to contact me.
Abstract
The current ways of energy provision will change dramatically in the coming decades. The European Union has committed to drastically reduce Europe's greenhouse gas emissions to 80-95% below 1990 levels in 2050. At the same time, electric mobility is getting significant attention in the Netherlands and many other countries.
The emergence of electric mobility introduces new threats and opportunities in relation to the electricity system, which require an increased degree of integration between the markets of electric mobility and the electricity system. The current architecture for electric mobility is inadequate, since there is no possibility to influence the charge process based on information from market parties such as the distribution system operator and/or the energy market. Charging can neither be influenced based on grid constraints nor the amount of (renewable) energy supply available. The main reason is that in the current situation, there is an absence of integration between the markets of electric mobility and the electricity system. In addition, the lack of a profitable business model can be identified. Because of the potential threats and opportunities and the impact that this could have on the business model, there is a need for further integration between the two markets.
The aim of the current research is to define a reference architecture based on the current developments and concepts from literature to help market players, such as Alliander, in making the right steps forward. The research is focused on the charging infrastructure in the public and semi-public space, concerning charge points for
customers that cannot charge at home or need to charge during their travel. To structure the research, the Design Science Research Methodology (DSRM) is applied. In addition, we apply the enterprise architecture approach as proposed by Iacob et al. (2012). This approach is based on open standards; using the `Architecture Development Method' (ADM) from TOGAF, and ArchiMate as the modeling language and framework.
As main objectives, the reference architecture needs to (1) optimally integrate with the electricity system, (2) accommodate the adoption of renewable energy sources, (3) be aligned with European standardization developments and (4) have a positive impact on the current business model.
Based on a literature study, design choices and their consequences are described which form the basis of the reference architecture. The main design choices involve the concept of ‗smart charging‘ and its implementations, and the shift of the energy contract by changing the formal end-user of electricity. Based on the literature study, a reference architecture is defined for electric mobility. To provide a path for implementation and migration, a migration architecture is established.
Table of contents
Acknowledgements ... I Abstract ... II Table of contents... III List of Figures ... VI List of Tables ... VII Acronyms ... IX
1 Introduction ... 1
1.1 Context ... 1
1.2 Research setting ... 2
1.3 Objectives ... 3
1.4 Research questions ... 4
1.5 Research methodology ... 5
1.6 Thesis structure and reading guide ... 6
1.7 Practical and scientific relevance ... 7
1.8 Modeling language and notation ... 7
2 Introducing electric mobility ... 10
2.1 Introducing the Electric Vehicle ... 10
2.2 Market overview ... 12
2.3 Charging infrastructure ... 15
2.4 Conclusions ... 16
3 Introducing the electricity system ... 17
3.1 The electricity system and its subsystems ... 17
3.2 Market overview ... 19
3.3 The changing nature of electricity generation ... 22
3.4 Conclusions ... 23
4 Problem analysis ... 24
4.1 Introduction ... 24
4.2 Threats and opportunities ... 24
4.3 Related problems ... 26
4.4 Conclusions ... 27
5 Approach ... 28
5.1 Approach to enterprise architecture ... 28
5.2 Objectives ... 29
5.4 Conclusions ... 32
6 Current architecture ... 33
6.1 Market roles ... 33
6.2 Processes ... 33
6.3 Business layer ... 36
6.4 Application layer ... 38
6.5 Infrastructure layer ... 38
6.6 Overview ... 39
6.7 Conclusions ... 39
7 Solution analysis ... 41
7.1 Introduction ... 41
7.2 The need for ‗smart charging‘... 41
7.3 Options for smart charging ... 42
7.4 The traffic light concept ... 48
7.5 Shift of the energy contract... 49
7.6 Consequences ... 50
7.7 Design choices... 54
7.8 Conclusions ... 55
8 Reference architecture ... 56
8.1 Introduction ... 56
8.2 Business layer ... 56
8.3 Application layer ... 57
8.4 Infrastructure layer ... 58
8.5 Overview ... 58
9 Migration architecture ... 60
9.1 Introduction ... 60
9.2 Business layer ... 60
9.3 Application layer ... 61
9.4 Infrastructure layer ... 61
9.5 Overview ... 62
10 Validation ... 64
10.1 Validation approach ... 64
10.2 Results ... 64
10.3 Interview reports ... 66
10.4 Economic impact ... 66
11 Improved architectures ... 69
11.1 Introduction ... 69
11.2 Overview ... 69
11.3 Gap analysis ... 72
12 Conclusions ... 75
12.1 Research questions ... 75
12.2 Limitations ... 77
12.3 Further research ... 78
12.4 Recommendations ... 78
Appendix... 79
A. Market roles for electric mobility ... 79
B. Market roles in the electricity system ... 81
C. Full list of roles in the energy market (ENTSO-E) ... 86
D. Charge Detail Record (CDR) ... 88
E. History of the market for electric mobility ... 89
F. Validation interview ... 92
G. Interview reports... 101
List of Figures
Figure 1: Public charging of electric vehicles spreads through the Netherlands (E-laad, 2013) ... 2
Figure 2: Overview of the DSRM (Peffers, Tuunamen, Rothenberger, & Chatterjee, 2007) ... 5
Figure 3: Research structure ... 7
Figure 4: Applied concepts from ArchiMate ® and their meanings (The Open Group, 2012) ... 8
Figure 5: Types of EV (ICU, 2011) ... 11
Figure 6: Concepts and services, adapted from TNO & Innopay (2010) ... 12
Figure 7: Network model (TNO & Innopay, 2010) ... 13
Figure 8: Provider model (TNO & Innopay, 2010) ... 13
Figure 9: Overview of market roles for electric mobility ... 14
Figure 10: Overview of the current charging infrastructure (Geerts & Groosman, 2013) ... 16
Figure 11: High-level overview of the electricity system (De Vries, 2004) ... 17
Figure 12: Physical layer of the technical subsystem; based on Kleiwegt (2011) ... 17
Figure 13: Market and transactions within the electricity system; based on Van Werven & Scheepers (2005) ... 18
Figure 14: Overview of market roles in the electricity system ... 20
Figure 15: Sources for electricity in 2009 (De Energiezaak, Energie-Nederland & Netbeheer Nederland, 2011) ... 22
Figure 16: TOGAF ADM and ArchiMate (Iacob, Jonkers, Quartel, Franken, & Van den Berg, 2012) ... 29
Figure 17: Roles in the current architecture ... 33
Figure 18: Processes in the current architecture ... 34
Figure 19: Overview of the customer registration process ... 34
Figure 20: Overview of the customer authentication process; based on (E-laad, 2012) ... 34
Figure 21: Overview of the charging process; based on (E-laad, 2010) ... 35
Figure 22: Overview of the settlement process; based on (P2, 2012) ... 35
Figure 23: Overview of the metering process ... 36
Figure 24: Overview of the balancing process; based on (TenneT, 2013) ... 36
Figure 25: Business layer of the current architecture ... 37
Figure 26: Value exchange in the current architecture ... 37
Figure 27: Application view of the current architecture ... 38
Figure 28: Infrastructure view of the current architecture ... 39
Figure 29: Overview of the current architecture ... 40
Figure 30: Use cases for charging electric vehicles (CEN, CENELEC & ETSI, 2012) ... 41
Figure 31: Example of a charging schedule (IEC, 2011) ... 43
Figure 32: EDF's Tempo Program (S = Saturday, D = Sunday) (EDF, 2012) ... 45
Figure 33: Aggregator influencing the charge process ... 46
Figure 34: Energy management system influencing the charge process ... 47
Figure 35: Traffic light concept; adapted from CEN, CENELEC & ETSI (2012) ... 49
Figure 36: Separate scenario paths for energy and service ... 49
Figure 37: Value exchange when the charge service provider (CSP) owns the energy contract... 50
Figure 38: Revenue streams with energy supplier as charge service provider (CSP)... 50
Figure 39: European conceptual model of Smart Grids (CEN, CENELEC & ETSI, 2012) ... 51
Figure 41: Metering at charge point (current scenario) ... 53
Figure 42: Scenario with a trusted party for sharing metering data. ... 53
Figure 43: Business layer of the reference architecture ... 56
Figure 44: Data flows for metering data in reference architecture ... 57
Figure 45: Application layer of the reference architecture ... 57
Figure 46: Infrastructure layer of the reference architecture ... 58
Figure 47: Overview of the reference architecture ... 59
Figure 48: Supply chain for charging electric vehicles (CEN, CENELEC & ETSI, 2012) ... 60
Figure 49: Business layer of the migration architecture ... 61
Figure 50: Application layer of the migration architecture ... 61
Figure 51: Infrastructure layer for the migration architecture ... 62
Figure 52: Overview of the migration architecture ... 63
Figure 53: Business layer of the improved reference architecture ... 69
Figure 54: Improved reference architecture ... 70
Figure 55: Improved migration architecture ... 71
Figure 56: Gap analysis for the reference architecture ... 73
Figure 57: Gap analysis for the migration architecture ... 74
Figure 58: Network model (TNO & Innopay, 2010) ... 89
Figure 59: Provider model (TNO & Innopay, 2010) ... 89
Figure 60: Use cases for charging electric vehicles (CEN, CENELEC & ETSI, 2012) ... 93
Figure 61: Flexibility operator gathering flexibilities; adapted from (CEN, CENELEC & ETSI, 2012) ... 93
Figure 62: Control from a secondary actor ... 94
Figure 63: Revenue streams in the current situation ... 94
Figure 64: Revenue streams with energy supplier as CSP ... 95
Figure 65: Revenue streams in the ‗DSO model‘ (complies with the current household situation) ... 95
Figure 66: Revenue streams in the 'ATM model' ... 96
Figure 67: Metering at charge point (current scenario) ... 96
Figure 68: Scenario with a trusted party for sharing metering data ... 97
Figure 69: Data flows for metering data in reference architecture ... 98
Figure 70: Contract structure and revenue streams according to Arjan Wargers ... 103
List of Tables
Table 1: Thesis structure and traceability matrix ... 6Table 2: Structural relationships in ArchiMate ® (The Open Group, 2012) ... 8
Table 3: Dynamic relationships in ArchiMate ® (The Open Group, 2012) ... 8
Table 4: Definition of relevant e3-value concepts (Gordijn & Akkermans, 2003) ... 9
Table 5: Growth objectives for electric vehicles in the Netherlands (Tweede Kamer der Staten-Generaal, 2009) ... 10
Table 6: International electric mobility targets (Foley, Winning, & Gallachóir, 2010) ... 10
Table 7: Overview of grid impacts in the Netherlands (Verzijlbergh, Lukszo, Slootweg, & Ilic, 2011) ... 24
Table 8: Advantages and disadvantages for each of the smart charging scenarios ... 48
Table 10: Advantages and disadvantages concerning metering location ... 54
Table 11: Main choices that motivate the reference and migration architecture ... 55
Table 12: List of experts and their experience (in years) ... 64
Table 13: Charging characteristics (obtained from Wikipedia) ... 67
Table 14: Imbalance adjustments over 2011 (Hagemans, Fens, Bollen, Schoot Uiterkamp, & Venekamp, 2013) ... 67
Acronyms
ADM Architecture Development Method
BPM Car and motor(ised) vehicle taxes(Dutch: ‘Belasting voor personenauto's en motorvoertuigen‘) BRP Balance Responsible Party
CiMS Chargepoint Interactive Management System CDR Charge Detail Record
CIR Central Registry for Interoperability (Dutch: ‗Centraal Interoperabiliteits Register‘) CSO Charge Spot Operator
CSP Charge Service Provider DG Distributed Generation DSO Distribution System Operator DSM Demand Side Management
DSRM Design Science Research Methodology eCHS European Clearing House System E-REV Extended-Range Electric Vehicle EDF Electricité de France
ENS Energy Name Service
EV Electric Vehicle
EVCOID Electric Vehicle Contract ID EVSE Electric Vehicle Supply Equipment
EVSEID Electric Vehicle Supply Equipment ID FCEV Fuel Cell Electric Vehicle
FEV Full Electric Vehicle (also known as Battery Electric Vehicle) HEV Hybrid Electric Vehicle
IEC International Electrotechnical Commission M (Electricity) Meter
NFC Near Field Communication OCHP Open Clearing House Protocol OCPP Open Charge Point Protocol PHEV Plug-in Hybrid Electric Vehicle RES Renewable Energy Source RFID Radio Frequency Identification SG-CG Smart Grid Coordination Group
SM Smart Meter (or ‗Sub Meter‘ in Figure 10)
SO System Operator
TFET-IT Taskforce Energy Transition IT TO Transmission Operator TSO Transmission System Operator V2G Vehicle-2-Grid
1
Introduction
Electric mobility is getting significant attention in the Netherlands and many other countries. Car manufacturers, consumers and grid operators show an increasing interest in the transition towards electric vehicles. Up to now, the transition has mainly focused on the development of electric vehicles and the realization of accessible charging infrastructure. However, the emergence of electric mobility introduces new threats and opportunities in relation to the electricity system, which require an increased degree of integration between the markets of electric mobility and the electricity system. The current research has as its goal to definea reference architecture with the purpose of facilitating interoperability between involved parties from the markets of electric mobility and the electricity system. In the current chapter an overview of the context and motivation behind the research will be given, as well as the adopted research method and approach. Also, an outline of the overall structure of the thesis will be given.
1.1
Context
The current ways of energy provision will change dramatically in the coming decades. The European Union has committed to reducing Europe's greenhouse gas emissions to 20% below 1990 levels in 2020, and by 80-95% in 2050 (European Commission, 2013). Eurelectric, the association of the electricity industry in Europe, even aims for carbon-neutral power in Europe by 2050 (Eurelectric, 2011). In order to make this happen, it is expected that renewable and sustainable energy sources will replace non-renewable energy sources such as coal. This process is widely regarded as the energy transition. Some visionaries even argue that we are at the beginning of the third industrial revolution, where internet technology and renewable energy will merge into a powerful ―internet of energy‖, and people produce their own green energy in their homes, offices, and factories, and share it with each other just like we now create and share information online (Rifkin, 2011). Whether or not this revolution will occur, the general consent is that the increasing amount of distributed generation will relatively reduce the volume of demand for centralized production (Netbeheer Nederland, 2011).
Another development that is clearly evident is the increase of information flows within the energy market. Intelligent sensors are deployed in various parts of the energy distribution architecture (Enexis, 2010), and smart meters to digitally measure and communicate energy consumption are deployed to replace the current meters (Rijksoverheid, 2012). Worldwide, the concept of smart grids gets a lot of attention, both from the leading market players and academic community. According to the European Technology Platform Smart Grids, a smart grid is an electricity network that can intelligently integrate the actions of all users connected to it - generators, consumers and those that do both – in order to efficiently deliver sustainable, economic and secure electricity supplies (European Technology Platform Smart Grids, 2010). The European Commission acknowledged the essential role of smart grids in achieving Europe‘s objectives of reducing greenhouse gas emissions, and laid down a standardization mandate in 2011 to support the smart grid deployment througout Europe (European Commission, 2011).
To support the transition towards electric mobility, the requisite infrastructure for charging electric vehicles is being realized throughout the Netherlands (E-laad, 2013). Figure 1 shows the travel movements associated with the use of public charging stations of December (left) and over the full year (right). A ‗dot‘ represents a charge transaction of a specific car, and a ‗line between dots‘ is the movement of the car between two consecutive charge transactions.
Figure 1: Public charging of electric vehicles spreads through the Netherlands (E-laad, 2013)
Although there is a widespread interest in electric mobility, many uncertainties are still present. The market for electric mobility is still immature and the allocation of market roles unclear. The (expected) developments in the electricity system increase this uncertainty. The aim of this research is therefore to clarify and propose structure for the market for electric mobility, with the purpose of facilitating interoperability between involved parties and a smart integration with the electricity grid. Based on the current developments and concepts from literature, a reference architecture will be defined in order to help market players in making the right steps forward.
1.2
Research setting
The current research is undertaken at the taskforce ‗Energy Transition IT‘ within Alliander, an unlisted public limited utility company operating the electricity and gas networks in a large part of the Netherlands. Alliander transports electricity and gas to 3.3 million customers in the Netherlands (Alliander N.V., 2013).
The mission and vision of Alliander is to create a better society by creating sustainable energy systems. Alliander has a significant interest in the energy transition and is actively participating in order to realize this transition by
conducting pilot projects. In order to shape the business and operational technology that is needed to enable the transition, the taskforce ‗Energy Transition IT‘ (TF ET-IT) has been established. The taskforce has four strategic themes, which can be defined as follows:
1. Electric Vehicles
2. Local Demand/Supply in Energy Management
The traditional energy system generation is characterized by large-scale, one-way flows of energy and demand management. In contrast, the energy system of the future is characterized by volatile decentralized input and therefore bi-directional energy flow. These are difficult to predict, causing the balancing to become more difficult, which in turn can decrease reliability of supply. By deploying local demand/supply concepts, (near) real-time balancing within the lowest level in the network is possible. Based on information from multiple points in the network, demand and supply can be controlled through incentives, such as price (Hagemans, Fens, Bollen, Schoot Uiterkamp, & Venekamp, 2013).
3. Smart Buildings and Home Energy Management
In the energy system of the future, increased flexibility is needed in order to cope with fluctuations in energy supply. Household appliances will play a significant role in this by acting as buffer or offering the possibility to shift its use in time. Other goals are to help customers with the understanding of their energy consumption and encourage the (market) development of cleaner, more affordable energy applications (Schoot Uiterkamp, Venekamp, Geerts, Groosman, & Bollen, 2012)
4. Dynamic Asset and Grid Management
Assets are all tangible operating equipment with a former, actual or planned deployment in the electricity, gas or telecommunications network owned or managed by Liander. The main focus is twofold: increasing reliability and availability of the assets and grid on one side, and reducing its costs and risks on the other side (Giesberts, Hagemans, Klein, Boon, Roling, & Bakker, 2012).
The current research focuses on the theme of electric vehicles, but has significant overlap with the theme of local demand/supply in energy management as well. The taskforce is interested in the development of a reference architecture because of the potential impact of electric mobility on its core business; operating the electricity grid.
1.3
Objectives
As explained in the introduction, the aim of this research is to clarify and propose structure for the market for electric mobility, with the purpose of achieving interoperability between involved parties from the markets of electric mobility and the electricity system. Based on actual developments and concepts from literature, a reference architecture will be defined in order to help market players, such as Alliander, in making the right steps forward.
1.3.1 The concept of a reference architecture
The concept of architecture has been defined as the fundamental organization of a system embodied in its components, their relationships to each other, and to the environment, and the principles guiding its design and evolution (IEEE, 2000). A reference architecture captures the essence of existing architectures, and the vision of future needs and evolution to provide guidance to assist in developing new system architectures (Cloutier, Muller, Verma, Nilchiani, Hole, & Bone, 2010).
1.3.2 The concept of interoperability
Generally speaking, interoperability is the ability of two systems to understand one another and/or use one another‘s functionality. In the context of networked enterprises, interoperability refers to the ability of interactions (exchange of information and services) between enterprise systems (Chen, Doumeingts, & Vernadat, 2008).
1.3.3 Main objective
The main objective of the current research can be translated into:
―To define a reference architecture for electric mobility with the purpose of facilitating
interoperability between involved parties from the markets of electric mobility and the electricity
We define a ―smart integration of electric vehicles within the electricity system‖ as the ability of controlling the charging process of electric vehicles by intelligence, influencing the transfer of electricity based on customer preferences, (near) real-time information on electricity demand and supply, and capacity constraints from the electricity grid.
1.4
Research questions
In order to achieve the main research objective that is presented in the previous section, the following central research question is defined:
―How to define a reference architecture for electric mobility that facilitates interoperability
between involved parties from the markets of electric mobility and the electricity system, and
realizes a smart integration of electric vehicles in the electricity system?‖
In order to answer the central research question, a decomposition of the main problem is applied. This decomposition identifies the components or sub questions that assist towards answering the central research question. The following sub questions are defined:
1. What is electric mobility?
In order to understand the current architecture for electric mobility, a clear definition of electric mobility is desirable. In this sub question electric mobility will be defined and its history and background reviewed.
a. What is the definition of electric mobility?
b. What is the history and background in the developments of electric mobility? c. What is the state of the art in the infrastructure for charging electric vehicles?
2. What is the current architecture for electric mobility?
In order to work towards a reference architecture, the first step is a thorough analysis of the current situation. Therefore, the markets of both electric mobility and electricity will be analyzed and synthesized into an architectural overview.
a. What must be stated in a model of the electric mobility market? b. What must be stated in a model of the electricity market?
c. How do the market roles of the electricity and electric mobility markets relate to each other? d. What are the main concepts and processes in the current architecture?
3. What is the motivation behind a reference architecture for electric mobility?
In this sub question the objectives for the reference architecture will be defined on basis of the main problems and limitations in the current situation.
a. What are the main problems and limitations of the current situation?
b. Which objectives can be defined to serve as a basis for the reference architecture?
c. What are possible solutions to the problems and limitations, taking the objectives into account?
4. What must be stated in a reference architecture for electric mobility?
This sub question will result in a reference architecture for electric mobility, based on the objectives and motivation as identified in the previous research question.
a. What is a reference architecture and what is its use?
c. What are the gaps between the reference architecture and the current situation?
5. What is the evaluation of the reference architecture?
We want to evaluate whether the proposed reference architecture fulfills the goals stated as part of the main objective (facilitate interoperability and realize smart integration). For the evaluation we want to draw on the expertise of external stakeholders.
a. How can we evaluate and validate the reference architecture? b. What is the evaluation of the reference architecture?
1.5
Research methodology
To structure the current research, the Design Science Research Methodology (DSRM) as defined by Peffers, Tuunamen, Rothenberger, & Chatterjee (2007) will be applied. Figure 2 shows a general overview of the DSRM:
Figure 2: Overview of the DSRM (Peffers, Tuunamen, Rothenberger, & Chatterjee, 2007)
Based on the DSRM, the following phases have been distinguished in the current research:
1. Problem identification and motivation
During this initial phase, the specific research problem is identified and defined, and the research is motivated by showing its importance.
2. Defining the objectives for a solution
In the second phase the objectives for the solution will be defined; which includes a definition of how the reference architecture is expected to support solutions to the problems addressed in the previous phase. Resources include knowledge of state of problems and current solutions.
3. Design and development
This phase involves the design and development of the reference architecture, describing the to-be situation of the market for electric mobility.
4. Demonstration and evaluation
this phase, the reference architecture is presented to experts and validated by means of a structured interview in order to measure how well the reference architecture has been defined and helps in further developments.
5. Communication
The current research will be presented in a colloquium that is part of the examination of the master project. In addition, the main results of the current research will be processed into a scholarly publication.
1.6
Thesis structure and reading guide
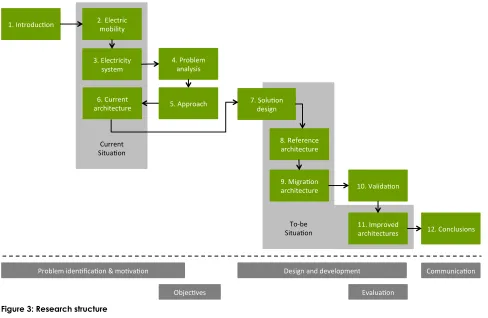
The current research has been structured as follows. In the first chapter the research is introduced and motivated. The second chapter introduces the reader into the field of electric mobility, covers its history and background and describes the state of the art in charging infrastructure. In this chapter we will work towards a model for electric mobility. Chapter three introduces the reader to the electricity system. In the fourth chapter a problem analysis is performed, based on the information from the previous chapters. In chapter five, our approach towards enterprise architecture is described and the objectives for the reference architecture are defined. In chapter six, the models for electric mobility and the electricity market are synthesized into a model reflecting the current architecture. Based on the objectives for the reference architecture, it will be made clear that the current architecture is insufficient. In chapter seven the first steps towards the design of the reference architecture will be made; on basis of a literature study the various choices to be made are analyzed. Chapter eight will introduce the reference architecture. In chapter nine, a migration architecture will be presented as a migration path towards the reference architecture. What follows in chapter ten is the validation of the reference architecture. Based on the feedback during from the validation with experts, an improved reference architecture is presented in chapter eleven. Chapter twelve is the final chapter of the current research, and presents the conclusions and answers to the research questions. In this chapter, a reflection is given on the work done and possibilities for future work are proposed.
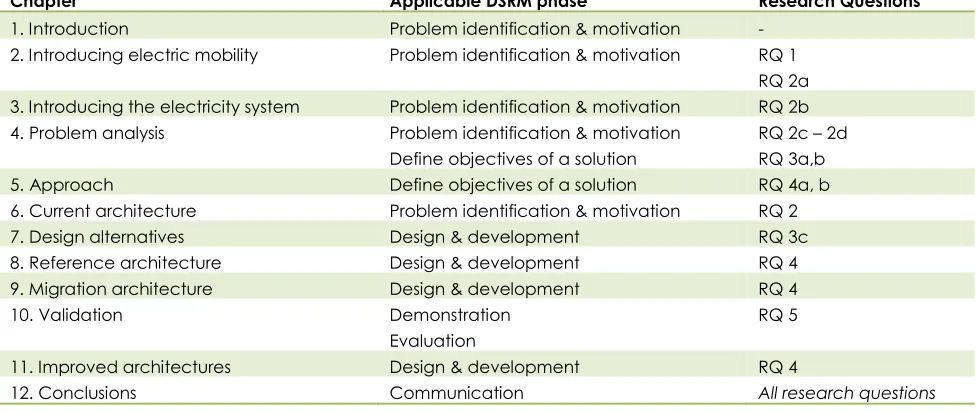
The following table gives an overview of the research structure, and maps each of the chapters to the applicable phase of the DSRM methodology and research question(s) that are covered:
Chapter Applicable DSRM phase Research Questions
1. Introduction Problem identification & motivation -
2. Introducing electric mobility Problem identification & motivation RQ 1 RQ 2a 3. Introducing the electricity system Problem identification & motivation RQ 2b 4. Problem analysis Problem identification & motivation
Define objectives of a solution
RQ 2c – 2d RQ 3a,b
5. Approach Define objectives of a solution RQ 4a, b
6. Current architecture Problem identification & motivation RQ 2
7. Design alternatives Design & development RQ 3c
8. Reference architecture Design & development RQ 4
9. Migration architecture Design & development RQ 4
10. Validation Demonstration
Evaluation
RQ 5
11. Improved architectures Design & development RQ 4
[image:19.612.46.534.432.638.2]12. Conclusions Communication All research questions
Table 1: Thesis structure and traceability matrix
Figure 3: Research structure
1.7
Practical and scientific relevance
The current research is relevant in two ways:1. Practical relevance
As mentioned in the previous sections, the market for electric mobility is still immature and in full motion. The reference architecture as defined in the current research aims to help market players, such as Alliander, in making the right steps forward by providing a solid and comprehensive framework for further work. Insight is given into the current and desirable situation for electric mobility.
2. Scientific relevance
The current research works towards a reference architecture and is built upon concepts from enterprise architecture (TOGAF, ArchiMate) and business modeling (e3value). The concepts of these fields are applied in a concrete case, showing its relevance and validating its use. The main results of the current research will be processed into a scholarly publication, disclosing the acquired knowledge during this research.
1.8
Modeling language and notation
In the current research, various models are presented. For these models, two modeling languages are used: the ArchiMate ® language and notation for architectural models, and e3value for business modeling.
1.8.1 ArchiMate
The ArchiMate language and notation consists of various types of concepts and relationships. Figure 4 gives an overview of the relevant concepts from the ArchiMate language and notation that are applied in the current research, including their meaning.
[image:21.612.47.548.265.508.2]Figure 4: Applied concepts from ArchiMate ® and their meanings (The Open Group, 2012)
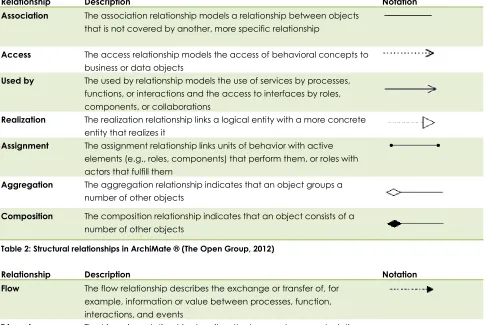
Table 2 and Table 3 give an overview of the structural and dynamic relationships within ArchiMate.
Relationship Description Notation
Association The association relationship models a relationship between objects that is not covered by another, more specific relationship
Access The access relationship models the access of behavioral concepts to business or data objects
Used by The used by relationship models the use of services by processes, functions, or interactions and the access to interfaces by roles, components, or collaborations
Realization The realization relationship links a logical entity with a more concrete entity that realizes it
Assignment The assignment relationship links units of behavior with active elements (e.g., roles, components) that perform them, or roles with actors that fulfill them
Aggregation The aggregation relationship indicates that an object groups a number of other objects
Composition The composition relationship indicates that an object consists of a number of other objects
Table 2: Structural relationships in ArchiMate ® (The Open Group, 2012)
Relationship Description Notation
Flow The flow relationship describes the exchange or transfer of, for example, information or value between processes, function, interactions, and events
Triggering The triggering relationship describes the temporal or causal relations between processes, functions, interactions, and events
Table 3: Dynamic relationships in ArchiMate ® (The Open Group, 2012)
1.8.2 e3value
[image:21.612.50.535.268.593.2]requirements engineering and conceptual modeling (Gordijn, 2003). The following table gives an overview of the relevant concepts and their notation used within e3-value:
Concept Description Notation
Actor An actor is (perceived by its environment as) an independent economic (and often also legal) entity
Value Object Actors exchange value objects, which are services, goods, money, or even consumer experiences. The important point here is that a value object is of value for one or more actors
e.g. ‗money‘
Value Port An actor uses a value port to show to its environment that it wants to provide or request value objects. The concept of ports enables us to abstract away from the internal business processes, and to focus only on how external actors and other components of the value model can be ‗plugged in‘
Value Interface Actors have one or more value interfaces. In its simplest form, a value interface consists of one offering, but in many cases, a value interface groups one or more in- and outgoing value offerings
Value Exchange A value exchange is used to connect two value ports with each other. It represents that two actors owning the connected ports are willing to exchange value objects with each other
Market Segment A market segment is a concept that breaks a market (consisting of actors) into segments that share common properties.
Accordingly, our concept market segment shows a set of actors that for one or more of their value interfaces, value objects equally from an economic perspective
[image:22.612.72.537.103.483.2]Scenario Paths It often occurs that, to satisfy an end-consumer need, numerous actors have to exchange objects of value with each other. Scenario paths show the value exchanges that should occur as a result of a consumer need (start stimulus). The last segment(s) of a scenario path is/are connected to a stop stimulus.
Table 4: Definition of relevant e3-value concepts (Gordijn & Akkermans, 2003)
2
Introducing electric mobility
The field of electric mobility is relatively novel. In this chapter the history and background of developments in the area of electric mobility are reviewed, with the purpose of introducing the reader to the field.
2.1
Introducing the Electric Vehicle
Electric mobility is getting significant attention in the Netherlands and many other countries. Car manufacturers, consumers and grid operators show an increasing interest in the production of electrical vehicles. The Dutch government supports the transition to electric vehicles and promotes the use electric cars and semi-electric cars by means of an exempt from additional tax liability (fiscal surcharge), road tax and BPM. As can be seen in Table 5, one of their objectives is to have one million electric cars in the Netherlands in 2025 (Rijksoverheid, Elektrisch rijden, 2012).
Period Market development Expected number of electrical vehicles
2009 – 2011 Development 10 – 100‘s
2012 – 2015 Introduction 15.000 – 20.000
2015 – 2020 Growth 200.000
[image:23.612.46.556.378.521.2]> 2020 Maturity 1.000.000 in 2025
Table 5: Objectives for growth of electric vehicles in the Netherlands (Tweede Kamer der Staten-Generaal, 2009)
On an international level, the same trend can be seen: various governments establish EV targets, policies and plans for the deployment of EVs. One of the main reasons is the commitment of the European Union to drastically reduce Europe's greenhouse gas emissions (European Commission, 2013). The following table is obtained from a study by Foley, Winning & Gallachóir (2010):
Country Target
Austria 2020: 100,000 EVs deployed
Australia 2050: up to 65% of car stock
Canada 2018: 500.000 EVs deployed
Denmark 2020: 200.000 EVs
France 2020: 2.000.000 EVs
Germany 2020: 1.000.000 EVs
Ireland 2020: 10% EV market share
New Zealand 2040: 60% market share
Spain 2014: 1.000.000 EVs deployed
USA 2015: 1.000.000 PHEV stock
Table 6: International electric mobility targets (Foley, Winning, & Gallachóir, 2010)
2.1.1 Definition of electric mobility
Before continuing the current research, it is important to establish an unambiguous definition of electric mobility. Based on the definition from Gartner (2012), we define electric mobility as follows:
Electric mobility (or e-mobility) represents the concept of using electric technologies, in-vehicle
information, and communication technologies and connected infrastructures to enable the
electric propulsion of vehicles and fleets.
2.1.2 Definition of electric vehicles
―Any vehicle propelled by an electric motor drawing current from a rechargeable storage battery
or from other portable energy storage devices (rechargeable, using energy from a source off the
vehicle such as a residential or public electric service), which is manufactured primarily for use on
public streets, roads or highways.‖ (International Electronical Commission, 2012)
2.1.3 Classification
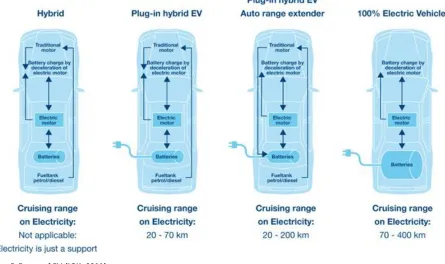
[image:24.612.67.512.204.468.2]According to the Tennessee Valley Authority, an electricity corporation owned by the U.S. government, four main types of electric vehicles can be distinguished (Tennessee Valley Authority, 2013). The four types that are identified are displayed in Figure 5. This figure itself is obtained from ICU, part of Alfen, the market leader in the Netherlands in the area of transformer substations (ICU, 2011).
Figure 5: Types of EV (ICU, 2011)
Geerts & Groosman (2013) use the same classification, but mention a fifth type: the Fuel Cell Electric Vehicle (FCEV). This type is also an electric vehicle, but uses hydrogen instead of a battery as an energy source. The hydrogen is converted into electricity and water in a fuel cell by means of a chemical reaction. Because this type of vehicle has no electric engine we will disregard it in the remainder of this research. An example FCEV is the Audi Q5-FCEV.
Based on the sources mentioned above, we will use the following classification in the current research:
I. Hybrid Electric Vehicle (HEV)
This type of EV uses two or more distinct power sources in order to move. Electricity is just a support, not the main engine. The battery is charged by the deceleration of the electric engine. An example HEV is the Toyota Prius.
II. Plug-in Hybrid Electric Vehicle (PHEV)
III. Extended-Range Electric Vehicle (E-REV)
This type of EV has a full electric engine, supported with an auxiliary fuel engine that can charge the battery and subsequently extend the range. An example E-REV is the Opel Ampera.
IV. Battery Electric Vehicle or Full Electric Vehicle (FEV)
This type of EV merely has a full electric engine; no fuel engine is present. Examples of FEVs are the Nissan Leaf or the Tesla Model S.
2.2
Market overview
The market model for charging electric vehicles shows the properties of a two-sided market (TNO & Innopay, 2010). In a two-sided market there are two types of parties that interact with each other, which can be supported by one or more intermediary actors. A characteristic of a two-sided market is that each of the types of parties has its own needs. Another important characteristic is that there are network effects: the growth of one of the two types of parties has a positive effect on the growth of the other type of parties. Examples of two-sided markets can be found in the telecommunication & banking sector. When looking at the banking sector, example market models are found in electronic payment networks such as MasterCard, Visa and the Dutch iDeal model. In each of these market models, agreements are established between suppliers (banks) and buyers and sellers, which allow buyers and sellers to experience a uniform service, whilst still having competition and innovation.
Within electric mobility, the two sides of the market can be defined as follows:
1. Customer; the user of EV charge services
2. Charge Provider; providing the EV charge services
2.2.1 Concepts and services
[image:25.612.57.542.424.693.2]The two sides of the electric mobility market introduced above interact with each other in various ways. Figure 6 shows the main concepts and services on a high level of abstraction.
In the high level overview presented in Figure 6, the two sides of the market are represented as actors. The customer is related to the electric vehicle, and is responsible for charging the vehicle. The charge provider is related to the charge infrastructure, which he makes available to the customer in order to provide charge services. By means of the charge provider, energy is delivered to the electric vehicle. The delivery of energy is an element of the charge transaction. However, before this part of the charge transaction can start, the customer needs to be authenticated and arrangements about the payment need to be made. The supply contract can be fulfilled by different roles, and is therefore drawn as a separate concept (TNO & Innopay, 2010).
Another essential concept that has not been identified above is roaming. A cellular customer is roaming whenever it automatically uses mobile services in a visited network, when travelling outside the geographical coverage area of its home network. Lutz & Fluhr define e-mobility roaming as the seamless experience of an e-mobility customer to use a charging station that its standard e-mobility provider is not responsible for. Also, a roaming agreement typically contains arrangements on the financial settlement of provided services (Lutz & Fluhr, 2010).
2.2.2 The market for electric mobility
The history of the EV charging infrastructure in the Netherlands started in 2008, when Eneco introduced the first public charge point, the NRGSPOT. This charge point was part of a demonstration project in Rotterdam, and allowed customers to charge their electric vehicle for a small charge (Eneco, 2008). As the number of electric vehicles in the Netherlands increased, the Dutch network operators realized that a large-scale introduction of electric vehicles would significantly influence their electricity grids. To be able to predict and cope with these effects, cooperating network operators started the foundation ‗E-laad‘. One of its main goals was to realize 10.000 public charging points in the Netherlands. In October 2009, E-laad commissioned its first public charging point, located at the parking lot of the University of Tilburg (Technisch Weekblad, 2009).
In July 2009, the Dutch government published a plan of action for the development of electric mobility in the Netherlands. In this document, electric vehicles are considered as a highly promising option in order to increase sustainability, strengthen the energy position and structurally boost the economy. One of the contributions from the government was the establishment of the so-called ―Formule E-team‖, with members from sectors regarded as essential for a successful introduction and deployment of EV. The primary task of the team was to promote the market development and removal of barriers in EV developments (Tweede Kamer der Staten-Generaal, 2009).
In the year that followed, EnergieNed and Netbeheer Nederland commissioned Accenture to conduct an initial study to work towards a market model for electric vehicles. In this study, market models from the telecom & banking sector have been analyzed to serve as an example. The intention of the study was to open up the dialogue
between relevant market parties. The results, made public in April 2010, presents three market models and agrees on the "provider model‖ as the preferred model. In this model, a service provider acts as an intermediary between customer and charge point operator (EnergieNed & Netbeheer Nederland, 2010).
In a subsequent study by TNO & Innopay (2010), the provider model is further analyzed, and another model, the ―network model‖, is introduced. In this model, the service provider is split into two service providers: one for the customer and one for the charge point operator. In the longer term, this network model is desirable to realize the most freedom of choice, innovation and a dynamic market. Following on the study by TNO & Innopay, Innopay proposed the necessary processes needed for the further development of a market model for EV charging services. Based on a consultation process in which 25 parties participated, this has led to a roadmap action for the
implementation of a market model for EV charging services (Innopay, 2011). In the current situation, the market is (still) structured accordingly to the provider model.
For the purpose of readability, only a selection of developments has been described in the current section. For a complete overview of these historic developments in electric mobility, please refer to appendix E.
2.2.3 Market roles
A lot of sources define their view on the market roles that are present in the market of electric mobility. In this section the results of a literature study on market roles for electric mobility are presented; relevant market roles are identified and definitions for each of the roles are given. Various sources have been analyzed. Relevant sources include the European standardization organizations CEN, CENELEC & ETSI, the International Electrotechnical Commission (IEC), and the Green eMotion project.
In the current market for electric mobility, five main roles are evident. These roles are displayed in Figure 9. The charge spot operator (CSO) is responsible for managing and operating several charge points. The charge service provider (CSP) is the central point of contact for the customer, and provides its customers with the ability to charge at public charge points, irrespective of the charge spot operator. In order to realize this, the role of a clearing house exists, which unburdens both charge spot operators and charge service providers, making it possible to provide roaming functionality to their customers. The original equipment manufacturer (OEM) is the producer of electric vehicles and/or charge points, and provides EV related services. The remaining role is the role of electric vehicle owner and/or driver. Theoretically, this role aggregates several sub roles: the owner of the electric vehicle, the person driving the electric vehicle and influencing its charging needs, and the charge service customer, who has a contract with the charge service provider for the use of its services.
Figure 9: Overview of market roles for electric mobility
Based on the literature study, we define the market roles as follows:
Electric Vehicle Owner / Driver
Person or legal entity using the vehicle and providing information about driving needs and consequently influences charging patterns (IEC, 2012)
Identified in: (Green eMotion, 2013), (IEC, 2012), (TNO & Innopay, 2010) and (E-clearing.net, 2012)
Charge Service Provider (CSP)
Operates as a contract party for the customer, and takes care of the end user authentication and billing processes (E-clearing.net, 2012)
Identified in: (Green eMotion, 2013), (IEC, 2012), (TNO & Innopay, 2010), (E-clearing.net, 2012) and (CEN, CENELEC & ETSI, 2012)
Other abbreviations: EVSP = Electronic Vehicle Service Provider, ESP / MSP = e-Mobility Service Provider
Charge Spot Operator (CSO)
Has a contract with energy supplier and offers access and charging services at charge points. The CSO purchases electricity from the energy supplier and will send the charge service provider an invoice for the delivered electricity (E-clearing.net, 2012) (TNO & Innopay, 2010)
Identified in: (Green eMotion, 2013), (IEC, 2012), (TNO & Innopay, 2010), (E-clearing.net, 2012) and (CEN, CENELEC & ETSI, 2012)
Other abbreviations: EIOP = e-Mobility Infrastructure Operator, EVSE Operator = Electric Vehicle Supply Equipment Operator
Original Equipment Manufacturer (OEM)
An entity that produces electric vehicles and provides EV services related to their own build electric vehicles (Green eMotion, 2013). Can also refer to the manufacturer of charge points.
Identified in: (Green eMotion, 2013) and (IEC, 2012)
Clearing House
The clearing house acts as a roaming enabler. It can collect contractual data either from the marketplace, ask the involved parties by itself, or stores a subset of contract information in its own database. It forwards CDRs to the corresponding EVSP of a customer who has charged at a foreign location. The clearing house does the authentication of charging requests when it is asked by the EVSE operator (Green eMotion, 2013)
Identified in: (Green eMotion, 2013), (IEC, 2012) and (E-clearing.net, 2012)
For a comprehensive overview of the literature study, please refer to appendix A.
2.3
Charging infrastructure
The current infrastructure for charging electric vehicles can be divided into three areas. For the municipality of Uithoorn, De Haas & Idema (2013) classified the various types and their associated costs:
1. Loading on private property
This type of charge point is connected to an existing electrical installation; charging is executed ‗behind the meter‘. Costs related to the installation and the design on average € 1,000. The New Motion has a business model where owners of private charge points can offer their charge point to others (The New Motion, 2013).
2. Loading in semi-public space
Examples are charge points at car parks of businesses and/or shopping centers. Owners of these locations often choose to offer charge services for free. This allows all electric vehicles to visit, and no complex settlement of costs is needed. For the electrical connection, existing network connections are generally used. Charge points for the semi-public space are available from approximately € 1,500.
3. Loading in public space
The current research focuses on charging infrastructure in the public and semi-public space. The main reason behind this decision is that most citizens do not have a private driveway and depend on public charging infrastructure.
Roughly speaking, there are two different approaches to the installation, operation and management of the charging infrastructure. In the first approach, these responsibilities are an extension of the regulated distribution system operator (DSO). This approach is often referred to as the ―DSO model‖, where the DSO owns and operates the public charging infrastructure. In the second approach, the responsibilities are performed by public bodies or private undertakings, and managed within a competitive market (EDSO, 2012). In 2012, the minister of EL&I indicated that the placement and operation of the public charging infrastructure should be considered as a market task, and not as part of the public electricity grid. The second approach therefore reflects the chosen and current situation in the Netherlands, where the DSO is responsible for providing the connection towards a charging station, including the meter provided in conformance with its statutory duties. The realization, operation and management of the
charging infrastructure itself are outside the scope of the DSO. For these responsibilities, a separate role of charge spot operator (CSO) is introduced, as described in section 2.2.3.
Figure 10: Overview of the current charging infrastructure (Geerts & Groosman, 2013)
In Figure 10, an overview of the current charging infrastructure is given. In this overview, the following abbreviations are used: ‗CS‘ refers to charge socket, ‗SM‘ to sub meter and ‗M‘ to meter. Since the current regulation does not provide any specific directives for the realization of charge points, the connection for a charge point is currently treated in the same manner as a domestic connection. Therefore, a smart meter and safety fuse must be located on a meter board that is originally designed for households, taking up a lot of space within the charging
infrastructure. In addition to the required smart meter that registers the aggregated usage of both outlets (‗charge socket‘ in the figure), two individual meters are located to register meter readings per charge session. Also, separate safety fuses are located for each of the outlets. In essence, the smart meter and safety features are therefore redundant, taking up unnecessary space and costs (Geerts & Groosman, 2013).
In the current architecture, a public charge point has its own grid connection, and therefore needs an associated electricity contract. This situation implies that for customers, there is no possibility to choose between electricity suppliers. The energy supplier has to be the same for all users of the charging services (EDSO, 2012)
2.4
Conclusions
3
Introducing the electricity system
Electric vehicles need to be charged with electricity in order to function. For this reason, an important relationship exists between electric mobility and the electricity system. In the current chapter, the main concepts within the current electricity system are explored.
3.1
The electricity system and its subsystems
The electricity system can be defined as the combination of systems that produce, transport and deliver power and provide related services, including the actors and institutions that control the physical components of the system (De Vries, 2004). As illustrated in Figure 11, the electricity system consists of a technical and an economic subsystem.
Figure 11: High-level overview of the electricity system (De Vries, 2004)
3.1.1 The technical subsystem
The technical subsystem is defined as the physical part of the electricity system, consisting of the hardware that physically produces and transports electric energy to customers, as well as the devices that use the electricity (De Vries, 2004). The purpose of the technical subsystem is to physically connect producers and consumers of electricity. The system consists of high voltage, medium voltage and low voltage networks, where high voltage is used for longer distance electricity transmission and lower voltage networks for regional distribution of electricity (Kleiwegt, 2011). Figure 12 shows an overview of the physical layer of the technical subsystem. As can be seen, electricity is
transported through the national transmission network, which - in the Netherlands - mainly consists of overhead lines. Subsequently, the electricity is transported through underground cables and transformers, which convert electricity to a different voltage level with a very high efficiency (Kleiwegt, 2011).
Figure 12: Physical layer of the technical subsystem; based on Kleiwegt (2011)
electricity, namely the Transmission System Operator (TSO) and the Distribution System Operator (DSO). The TSO fulfills two roles in order to manage the transmission grid: the role of transmission operator (TO), which manages the transmission system, and system operator (SO), which maintains system stability and manages the energy balance, as the network itself cannot store electricity. Since the tasks of TO and SO are joined in one agency throughout Europe, we will refer to this role as TSO (De Vries, 2004). The DSO has a similar function, but is responsible for the regional distribution networks (Van Werven & Scheepers, 2005).
3.1.2 The economic subsystem
De Vries defines the economic subsystem as the actors that are involved in the production, trade or consumption of electricity, in supporting activities or their regulation, and their mutual relations. Two groups of actors can be distinguished: Actors operating in the economic subsystem only, and actors that also operate in the technical system. The reason for this is that the main actors in the technical system are also important actors in the economic system, although they have a different role (De Vries, 2004).
3.1.3 Synthesis of the technical and economic subsystem
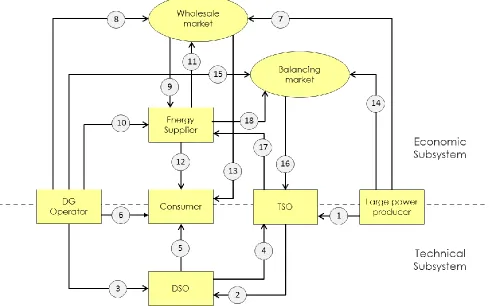
[image:31.612.53.542.304.610.2]In order to further comprehend the electricity system, both subsystems can be synthesized into a complete overview of the electricity system. Figure 13, which is largely based on Van Werven & Scheepers (2005), gives this overview:
Figure 13: Overview of market and transactions within the electricity system; based on Van Werven & Scheepers (2005)
Based on this overview we will now analyze the various transactions1 that exist between market parties within both
the economic and technical subsystems. The description below refers to the transactions by using numbers that correspond with the numbers used in Figure 13. The transactions can be divided into three groups: the exchange of electricity, the transactions within the wholesale market and the transactions within the balancing market.
1. Transactions concerning the exchange of electricity
The TSO has (regulated) agreements with large power producers, who feed their electricity directly into the transmission grid (1). The electricity is then transported from TSO to DSO (2), from where it is distributed to (small) customers (5). Electricity from distributed generation (DG), such as solar panels or windmills, is either instantly consumed on-site by a customer (6) or gets fed into the distribution network (3). Since the amount of DG is growing, the supply of energy may exceed demand, in which case the surplus electricity is fed backwards into the transmission grid (4).
2. Transactions concerning the wholesale market
On the wholesale market electricity gets traded. Large power producers offer their electricity on this market (7), as well as some DG operators (8). Energy suppliers buy commodity on the wholesale market in order to serve their customers (9). In some cases, energy suppliers extract extra electricity directly via (small) DG operators (11). The energy supplier sells electricity to its customers (12). Very large electricity consumers can buy electricity directly on the wholesale market (13).
3. Transactions concerning the balancing market
The liberalization of the energy market has led to the establishment of a separate balancing market in the Netherlands. This market is controlled by the TSO, who is the single buyer on this market. Since the system operator is responsible for maintaining the balance in the system, market players have to submit forecasts (or ‗energy programs‘) in order to match supply and demand. When there is imbalance in the network, the TSO corrects this by buying the lowest priced offer in the balancing market (16). Most of the offers come from large power producers (14), however, sometimes DG operators (15) or energy suppliers (18) offer electricity as well. The TSO charges the energy supplier(s) that caused the imbalance on basis of the price that it has paid on the balancing market (17). The mechanism works the other way as well: in case of a surplus of produced electricity, the TSO accepts and receives the highest bid in the balancing market for adjusting generating units downwards.
As mentioned before, it is interesting to see that the main actors in the technical system are also important actors in the economic system, but fulfill a different role. Consider for example the case of a large power producer: in the technical subsystem its role is to provide the physical generation of electricity. Activities are expressed in terms of quality and quantity of electricity generated, transported or used. In the economic subsystem, the generating company can act as a supplier: selling electricity for a certain price (De Vries, 2004).
3.2
Market overview
As introduced in the previous section, the economic subsystem within the electricity system is focused around energy markets in which various actors‘ trade electricity in a variety of ways and timescales. In the current section, markets for trading electricity are identified, followed by a market role analysis in order to identify and describe the relevant market roles for the current research.
3.2.1 Power exchange
In the Netherlands, APX Power NL, part of the APX GROUP, provides the market place or power exchange. APX Power NL has been established in 1999, and provides an independent fully electronic exchange for anonymous trading of electricity. It offers its platform and services to distributors, producers, traders, brokers and industrial end-users (APX Group, 2013). This is done by the organization of two markets:
1. Day-ahead auction
2. Continuous markets: intraday & strips
The intraday market offers members the opportunity to continuously trade power products in hourly intervals as well as freely definably block orders up to 5 minutes prior to delivery. On the strips market, members can continuously trade standardized blocks of hours.
3.2.2 Market roles
Based on the electricity system as identified in the previous section, we will now describe the relevant market roles for the current research. In addition to the literature that has been covered in the previous section, literature from various other sources have been analyzed, including documentation from the European Network of Transmission System Operators for Electricity (ENTSO-E), the European standardization organizations CEN, CENELEC & ETSI, the Expert Group for Regulatory Recommendations (EG3) and the International Electrotechnical Commission (IEC). Based on these sources, an overview of the market roles in the electricity system is given in Figure 14.
Figure 14: Overview of market roles in the electricity system
For each of the roles, the following definitions are used:
Transmission System Operator (TSO)
A party that is responsible for a stable power system operation, including the organization of physical balance, through a transmission grid in a geographical area (ENTSO-E, 2011)
Identified in: (CEN, CENELEC & ETSI, 2012), (ENTSO-E, 2011), (EG3, 2013), (European Parliament and Council, 2003)
and (De Vries, 2004)
Distribution System Operator (DSO)
Responsible for regional grid access and grid stability, integration of renewables at the distribution level and regional load balancing (EG3, 2013)
Identified in: (Green eMotion, 2013), (IEC, 2012), (EG3, 2013) and (European Parliament and Council, 2003)
Energy Consumer
Entity or person that consumes electricity (EG3, 2013) (ENTSO-E, 2011).
Identified in: (CEN, CENELEC & ETSI, 2012), (ENTSO-E, 2011) and (EG3, 2013)
Energy Producer
A party that produces electricity; a type of party connected to the grid (ENTSO-E, 2011)
Identified in: (ENTSO-E, 2011), (EG3, 2013), (CEN, CENELEC & ETSI, 2012) and (European Parliament and Council, 2003)
Energy Supplier
Has a contractual agreement with end customer relating to the supply of electricity (EG3, 2013)
Identified in: (ENTSO-E, 2011), (Green eMotion, 2013), (IEC, 2012), (CEN, CENELEC & ETSI, 2012), (EG3, 2013),
(E-clearing.net, 2012), (De Vries, 2004) and (Van Werven & Scheepers, 2005)
Balance Responsible Party (BRP)
A party that has a contract proving financial security and identifying balance responsibility with the imbalance settlement responsible of the market balance area entitling the party to operate in the market; the only role allowing a party to buy or sell energy on a wholesale level (ENTSO-E, 2011)
Identified in: (ENTSO-E, 2011), (EG3, 2013) and (CEN, CENELEC & ETSI, 2012)
Metering Responsible
The ENTSO-E identifies four separate roles concerning electricity metering: Meter Operator, Metered Data Collector, Metered Data Responsible and Metered Data Aggregator. In our role model, this separation is not relevant; therefore these roles are aggregated into the role of ‗Metering Responsible‘, which we define as a party responsible for installing, maintaining, testing, certifying and decommissioning physical meters, as well as performing meter reading services and the quality control of these readings (ENTSO-E, 2011).
Identified in: (EG3, 2013), (ENTSO-E, 2011), (CEN, CENELEC & ETSI, 2012) and (IEC, 2012)
Market Operator
The unique power exchange of trades for the actual delivery of energy that receives the bids from the Balance Responsible Parties that have a contract to bid. The Market Operator determines the market energy price after applying technical constraints from the System Operator (ENTSO-E, 2011).
Identified in: (EG3, 2013), (ENTSO-E, 2011), (CEN, CENELEC & ETSI, 2012), (IEC, 2012), (Green eMotion, 2013) and (De Vries, 2004)