ORIGINAL RESEARCH
BRAIN
Modeling the Relationship among Gray Matter Atrophy,
Abnormalities in Connecting White Matter, and Cognitive
Performance in Early Multiple Sclerosis
X A.F. Kuceyeski, W. Vargas, M. Dayan, E. Monohan, C. Blackwell, A. Raj, K. Fujimoto, and S.A. Gauthier
ABSTRACT
BACKGROUND AND PURPOSE: Quantitative assessment of clinical and pathologic consequences of white matter abnormalities in multiple sclerosis is critical in understanding the pathways of disease. This study aimed to test whether gray matter atrophy was related to abnormalities in connecting white matter and to identify patterns of imaging biomarker abnormalities that were related to patient processing speed.
MATERIALS AND METHODS: Image data and Symbol Digit Modalities Test scores were collected from a cohort of patients with early multiple sclerosis. The Network Modification Tool was used to estimate connectivity irregularities by projecting white matter abnormal-ities onto connecting gray matter regions. Partial least-squares regression quantified the relationship between imaging biomarkers and processing speed as measured by the Symbol Digit Modalities Test.
RESULTS:Atrophy in deep gray matter structures of the thalami and putamen had moderate and significant correlations with abnormal-ities in connecting white matter (r⫽0.39 – 0.41,P⬍.05 corrected). The 2 models of processing speed, 1 for each of the WM imaging biomarkers, had goodness-of-fit (R2) values of 0.42 and 0.30. A measure of the impact of white matter lesions on the connectivity of occipital and parietal areas had significant nonzero regression coefficients.
CONCLUSIONS: We concluded that deep gray matter regions may be susceptible to inflammation and/or demyelination in white matter, possibly having a higher sensitivity to remote degeneration, and that lesions affecting visual processing pathways were related to processing speed. The Network Modification Tool may be used to quantify the impact of early white matter abnormalities on both connecting gray matter structures and processing speed.
ABBREVIATIONS:ChaCo⫽Change in Connectivity; NeMo⫽Network Modification Tool; PLSR⫽partial least-squares regression; RD⫽radial diffusivity; SDMT⫽ Symbol Digit Modalities Test
O
ne of the most pressing questions in multiple sclerosis is understanding the relationship between white matter le-sions and subsequent atrophy, physical disability, and cognitive impairment. MS is a neurologic disorder that has pathologic man-ifestations in both WM and gray matter, some of which can be detected via in vivo MR imaging. WM changes have beenexten-sively studied in MS, by using diffusion imaging and tractogra-phy1,2and structural imaging.3Classically, MS has been seen as
primarily a disease of the WM, but recent developments have identified clinically relevant GM pathologies.4,5The underlying
cause of GM abnormalities is unclear,6but some have
hypothe-sized that it may be a result of retrograde or anterograde Wallerian degeneration.7
There are many studies of WM pathology and networks in MS8,9and studies of WM/GM pathologies in tandem.10,11
How-ever, one must incorporate topologic information2 to test
whether connectivity plays a role in MS. Recent studies12,13
pro-vide epro-vidence that networks may propro-vide a basis for the spread of pathology in a variety of neurologic disorders; the understanding
Received June 27, 2014; accepted after revision September 2.
From the Departments of Radiology (A.F.K., M.D., A.R.) and Neurology (W.V., E.M., C.B., K.F., S.A.G.), and The Brain and Mind Research Institute (A.F.K., A.R., S.A.G.), Weill Cornell Medical College, New York, New York.
This work was supported by EMD Serono, a Leon Levy Foundation Neuroscience Fellowship, and the following National Institutes of Health grants: P41 RR023953-02, P41 RR023953-02S1, and R01 NS075425.
Paper previously presented in part at: Conference for the European Committee for Treatment and Research in Multiple Sclerosis, October 2–5, 2013; Copenhagen, Denmark; and Conference for the Organization for Human Brain Mapping, June 8 –12, 2014; Hamburg, Germany.
Please address correspondence to Amy F. Kuceyeski, PhD, Weill Cornell Medical Col-lege, 515 East 71st St, S-114, New York, NY 10065; e-mail: [email protected]
Indicates open access to non-subscribers at www.ajnr.org
Indicates article with supplemental on-line appendix.
Indicates article with supplemental on-line photos.
of this process may result in prediction of disease progression and patient disability. Tractography methods used to infer structural connectivity networks have been applied in MS14,15; however,
practical implementation of tractography is laborious and time-consuming and requires expertise. Applying it in disease is espe-cially challenging16due to increased pathology-related noise in
the diffusion signal.1,17,18To circumvent these issues, we used the
recently developed Network Modification Tool (NeMo; https:// github.com/jimmyshen007/NeMo),19which can infer structural
connectivity losses from WM abnormalities without having to perform tractography in subjects with tissue pathology.
We hypothesize that the patterns of tissue abnormalities in individuals with MS impact neurologic outcomes, due to their specific neuroanatomic locations and subsequent disruption of the relevant functional pathways within the structural network. To test this hypothesis, we used the NeMo Tool to estimate, for each patient, the impact of his or her specific WM abnormality map on the fiber connectivity network and relate this to one of the most commonly used measures of end-stage CNS injury: regional brain atrophy. Furthermore, we used partial least-squares regres-sion (PLSR), a commonly used approach in neuroimaging,20to
relate imaging biomarkers to processing speed. Our goal was to identify which WM imaging technique best captures physiologi-cally relevant changes and to identify which regional imaging bio-markers are significant contributors to processing speed. To our knowledge, this study is the first to apply PLSR to structural con-nectivity and GM atrophy biomarkers to predict subtle cognitive changes in early MS.
MATERIALS AND METHODS
DataData were collected from 121 patients with early relapsing-remit-ting MS (Table); consent was obtained from all subjects in this institutional review board–approved retrospective study. All ex-cept 6 patients were on disease-modifying therapies for MS at the time of MR imaging, with an average treatment duration of 1.76⫾1.78 years. All patient MRIs were acquired within 5 years of their first neurologic symptom, which is our definition of “early” MS. The following four sets of images were acquired on a 3T scanner (HDxt 16.0; GE Healthcare, Milwaukee, Wisconsin) us-ing an 8-channel phased array coil: T1-weighted sagittal 3D-brain volume imaging (1.2⫻1.2⫻1.2 mm), T2 (0.5⫻0.5⫻3 mm), T2 FLAIR (1.2⫻0.6⫻0.6 mm), and 34-direction diffusion imaging (b⫽1000, 0.8⫻0.8⫻2.5 mm). All subjects that had the required imaging within 5 years of their first symptom were included; no other exclusion criterion was imposed. The same images were
collected on an age- and sex-matched group of 15 healthy con-trols. The written version of the Symbol Digit Modalities Test (SDMT) was performed on a subgroup of 66 patients. The SDMT measures processing speed, which is known to be one of the ear-liest affected cognitive domains in MS, and is particularly sensitive to MS-associated impairment.21
GM Atrophy and T2 FLAIR Hyperintensity Lesion Masks
FreeSurfer (http://surfer.nmr.mgh.harvard.edu)22was used on
the T1 images to produce subcortical segmentation, cortical par-cellation, and tissue-type masks (WM, GM, and other tissue), which were checked and manually edited for misclassification due to WM hyperintensities and common temporal region errors. T2 images were linearly coregistered to the T1 and FreeSurfer parcel-lations. The T2 FLAIR images were masked with the WM segmen-tation and subcortical mask and thresholded to create the WM abnormality masks. The resulting WM hyperintensity masks were then overlaid on T2 and T2 FLAIR images and manually edited (W.V., S.A.G., and E.M.), after which a trained neurologist (W.V.) gave a final approval. T1 images were also acquired on 15 age-matched healthy volunteers and processed with the same pipeline for calculating atrophy (Table).
Diffusion Image Processing
Each subject’s T1 was normalized via a nonlinear transformation into Montreal Neurological Institute space and segmented (GM, WM, CSF, and bone) by using the new segment toolbox (SPM8 software; http://www.fil.ion.ucl.ac.uk/spm/software/spm8).23 A
binary brain mask in T1 space was created by combining GM and WM maps and dilating and binarizing the resulting volume and subtracting the bone map (thresholded at 5%). For the diffusion data, a similar brain mask was obtained by applying the Brain Extraction Tool utility24to the b0 image. Diffusion tensor
coeffi-cients were computed via weighted linear least-squares regression with the fMRI of the Brain Software Library DTIFit (http://fsl. fmrib.ox.ac.uk/fsl/fsl-4.1.9/fdt/fdt_dtifit.html) utility. Maps of diffusion summary statistics, namely fractional anisotropy, axial diffusivity, mean diffusivity, and radial diffusivity (RD), were then calculated and mapped to Montreal Neurological Institute space via linear and nonlinear transforms in FSL (http://www. fmrib.ox.ac.uk/fsl). The Crawford modifiedttest,25designed for
individual subject voxelwise significance testing, was imple-mented for each individual’s diffusion measures in SPM8. A mask was applied to restrict the testing to WM voxels only (as defined by the SPM8 WM mask), and family-wise error correction was imposed, with no minimum threshold for cluster size.
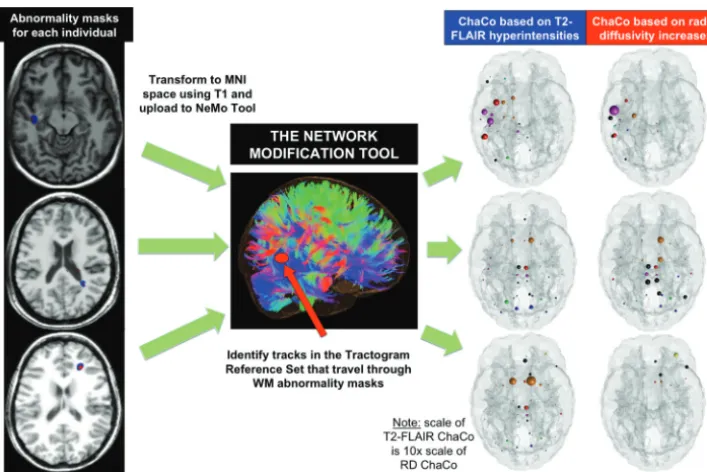
The NeMo Tool
The NeMo Tool (Fig 1) infers changes to the structural connectivity network that may result from a given mask of WM alterations by referencing a data base of 73 healthy control tractograms in a common space (Montreal Neurological Institute space). The WM abnormality masks of subjects with MS were normalized to com-mon space by using first a linear coregistration followed by non-linear normalization in SPM8. The Change in Connectivity (ChaCo) score, defined for each GM region, is the percentage of tracts connecting to that region that pass through the WM abnor-Demographics (meanⴞstandard deviation) for the early MS
cohort and the healthy control group
All Subjects with MS
Subgroup of Subjects with MS with SDMT
Healthy Controls
Total No. 121 66 15
Female 77 44 9
Age (yr) 37.5⫾9.8 36.5⫾9.3 36.3⫾13.2 Disease duration 2.1⫾1.5 1.6⫾1.5 NA
SDMT N/A 49.8⫾10.5 NA
EDSS 1.2⫾1.4 1.04⫾1.06 NA
mality mask. For example, if a GM region had 1000 connecting WM tracts and 50 passed through any voxel in the WM abnor-mality mask, the ChaCo score for that region would be 50/1000⫽ 5%, or⫺0.05 (the negative indicating a loss of connections). The identification of tracts that go through a lesion was a binary pro-cess: Tracts that went through 1 lesion were not considered dif-ferent from those that went through⬎1.
Statistical Analysis
Atrophy for each of 121 subjects with MS was measured by calcu-lating standardzscores of thickness for 68 cortical regions and volume for 18 subcortical regions from the FreeSurfer atlas, com-pared against the group of 15 healthy controls who had the same scans and processing. Partial Spearman correlations (controlling for age) were calculated on a region-by-region basis (after averag-ing left and right hemispheres to increase signal-to-noise) to iden-tify regions with stronger associations between the burden of WM abnormality (measured ChaCo scores) and GM loss (measured with atrophy).Pvalues were false discovery rate– corrected for multiple comparisons.26
Partial Least-Squares Regression
PLSR27was used in the subgroup of 66 subjects with MS to predict
SDMT on the basis of their age, ChaCo scores, and GM atrophy profiles for each of the 86 GM regions. One PLSR model for each WM imaging technique (T2 FLAIR lesions and diffusion abnor-mality masks) was constructed to compare their respective per-formances. PLSR reduces the dimensionality of the input data by finding new combinations of the input variables that have maxi-mal correlation with the outcome variables. PLSR is advantageous
in situations where you have many more input variables than you do data points because the data get reduced to a parsimonious set of statistically relevant components. PLSR is also useful when in-put variables may be collinear because each of the constructed components on which the subsequent regression is based is mu-tually independent. The final number of components was chosen via jackknife cross-validation to minimize data overfitting, and the stability of the model was assessed by using bootstrapping.20
Confidence intervals for the regression coefficients were calcu-lated by using the bias-corrected and accelerated percentile method.28If the confidence interval did not include zero, that
region’s ChaCo score was considered a significant predictor after correcting for multiple comparisons by using the Sˇida´k method.29
Further details are given in On-line Appendix A.
RESULTS
[image:3.594.116.470.45.281.2].05), as were their ChaCo scores (Spearmanr⫽0.51,P⬍.05). T2 FLAIR lesion masks generally encompassed at least an order of magnitude larger volume; therefore, ChaCo was generally an or-der of magnitude larger. RD abnormalities were at times con-tained within T2 FLAIR lesions; however, 48 of 121 subjects had no overlapping voxels. Figure 1 displays the masks of T2 FLAIR hyperintensities (blue) and RD increases (red) for 3 different in-dividuals along with the corresponding ChaCo scores via a “glass brain” display. The glass brain display has a sphere located at the center of each of the 86 GM regions, whose size is proportional to the ChaCo score of that region (larger indicates more connectivity abnormalities) and whose color indicates its functional network membership. The intersubject variability across these patients with early MS can be appreciated, as can the correspondence of the abnormality masks from the 2 imaging modalities. We did observe that the RD abnormalities in these subjects are often cir-cumscribed by or in close proximity to the T2 FLAIR lesion masks. These locations gave us confidence that the image process-ing steps, includprocess-ing normalization of both image modalities, were adequate (On-line Fig 3 has more examples).
ChaCo Scores and Atrophy
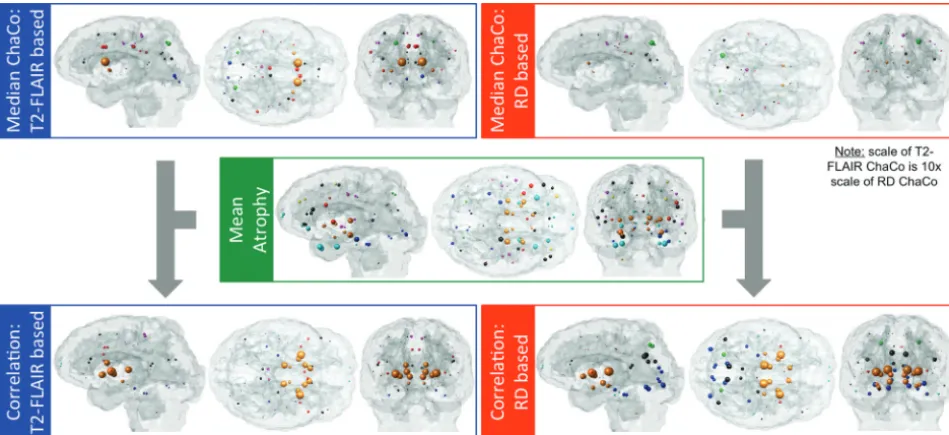
Glass brain displays in Fig 2 show the median of the ChaCo scores across the population for the 2 abnormality masks (larger sphere indicates more connectivity abnormalities), with the mean of the atrophy in the middle row (larger sphere indicates more atrophy) and correlations between the two measures in the bottom row (larger sphere indicates higher correlation). Areas with the high-est median ChaCo scores (⬎1.5% disconnected) for the T2 FLAIR– based masks were the bilateral caudate, caudal anterior cingulate, posterior cingulate, putamen, left superior and inferior parietal gyri, and right pericalcarine. Areas with highest median ChaCo scores for the RD-based masks were the bilateral caudate nucleus and parietal regions. Areas of highest atrophy were
mainly subcortical areas, including the thalamus, and temporal pole regions. For visualization of ChaCo and atrophy values over the entire population, see On-line Fig 1.
Correlations of ChaCo with Atrophy
Over all 86 regions in each of the 121 subjects with MS, regional ChaCo from both abnormality masks had weak partial Spearman correlations (controlling for age) with atrophy (T2 FLAIR ChaCo: r⫽0.01,P⬎.05; and RD ChaCo:r⫽0.042,P⬍.05). Bilateral regions with significant partial Spearman correlations (control-ling for age and multiple comparisons corrected) were observed between both sets of ChaCo scores and atrophy. Deep GM struc-tures of the thalami (r⫽0.30 andr⫽0.41) and putamen (r⫽0.38 andr⫽0.39) had significant correlations of atrophy with both T2 FLAIR– based and RD-based ChaCo scores, respectively. In addi-tion to those regions, the caudate nucleus (r⫽0.26), globus pal-lidus (r⫽0.26), and nucleus accumbens (r⫽0.28) were corre-lated for T2 FLAIR on the basis of ChaCo, and the hypothalamus (r⫽0.26) was significantly correlated for RD-based ChaCo. Fi-nally, the temporal poles had particularly high atrophy (second highest after the thalami) and had nonsignificant correlation with both ChaCo scores. However, these results could merely reflect the difficulty of FreeSurfer in handling temporal regions.
Partial Least-Squares Regression
One subject who had a very large amount of WM damage over the whole brain relative to the rest of the population (ie, thezscore of the mean T2 FLAIR lesion-based ChaCo was⬎5) was removed from this analysis. SDMT scores in our MS cohort were signifi-cantly lower (P⬍.05) when compared viattest with 2 different sets of healthy populations with similar age ranges.30,31 Both
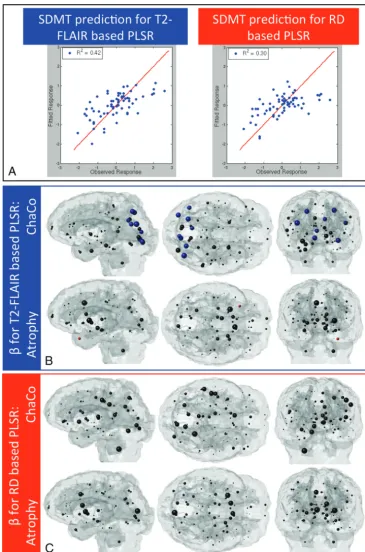
models included 2 final components based on the selection crite-ria outlined in On-line Appendix A. The T2 FLAIR lesion-based model was more accurate (R2⫽0.42) than the RD-based model
[image:4.594.57.532.47.264.2](R2⫽0.30) (Fig 3A). Figure 3B, -Cvisualizes the regression
coef-ficients for both models. Sphere size is proportional to the mean of the bootstrapped sample, and color corresponds to the signif-icance and direction of the coefficient (blue indicates positive and significant; red, negative and significant; and black, not
[image:5.594.112.477.45.597.2]regression coefficients indicate that more normal tissues corre-sponded to higher SDMT scores, as expected. Other subcortical areas such as the thalamus, nucleus accumbens, globus pallidus, hypothalamus, hippocampus, caudate nucleus, and the cerebel-lum had large positive mean regression coefficients, but none were significant. There were 2 regions whose atrophy coefficient had a significant negative relationship with SDMT; however, their values were quite small. No coefficients in the RD-based model remained significant after multiple-comparison corrections (Fig 3C).
On-line Fig 2 shows the component coefficients for ChaCo and atrophy scores for each of the 2 models. These are the direc-tions on which the data are projected before performing model fitting and can be thought of as the weights in a weighted average of the input variables. These coefficients give additional informa-tion about the relative importance of each predictor to each com-ponent. The color corresponds to the sign of the coefficient (blue indicates negative; red, positive). However, sign information is not important except for relative comparison because the PLSR components are invariant to reflection. The first component rep-resents the direction on which the data were projected to have maximal correlation with the outcome variable; the second com-ponent was the direction to achieve the next highest correlation (while maintaining independence of the first direction). The first components of both models (On-line Fig 2A,-C) emphasized the contribution of ChaCo scores over the contribution of atrophy. Their second components varied slightly: In the T2 FLAIR– based model (On-line Fig 2B), the second component seemed to em-phasize both overall atrophy and ChaCo in the occipital and pa-rietal areas, while the second component in the RD-based model (On-line Fig 2D) seemed to emphasize only overall atrophy.
DISCUSSION
Relatively weak correlations were observed between ChaCo scores and global regional atrophy, probably a result of a few factors. First, this patient population is early in the course of the disease, and there is not much appreciable atrophy in the structural MR imaging, which is only sensitive to detection of macroscopic tissue loss. Second, primary neuronal loss may also be occurring due to a mechanism independent from the one associated with WM le-sions. Future studies will follow these same subjects longitudinally to better understand these mechanisms.
Most interesting, areas with significant correlation between both types of WM abnormality masks and atrophy appeared in the subcortical areas of the thalamus and putamen. Additional regions with significant correlation between ChaCo and atrophy included the caudate nucleus, globus pallidus, nucleus accum-bens, and hypothalamus. These results largely suggest that deep GM areas are more sensitive to Wallerian degeneration, either retrograde or anterograde. Our results agree with other findings showing the following: 1) Striatal regions are susceptible to dam-age from inflammation arising in other areas32,33; 2) atrophy in
the putamen, caudate, and thalamus is related to whole-brain T1 and T2 lesions in MS34; 3) thalamic atrophy can be explained in
part by lesion volume and mean diffusivity in WM tracts connect-ing to the thalamus35; and 4) atrophy in deep GM regions of the
caudate and pulvinar are related to ipsilateral WM lesion
proba-bility maps in highly connected regions.36In this cohort, overall
observed atrophy was small (no regions showed significant group-wise atrophy after multiple-comparison corrections); however, regions with the most atrophy were the thalamus and other subcortical areas. Taken together, these findings indicate deep GM structures as areas of early injury in MS with a possible disease-duration-related WM injury gradient. Our current ap-proach cannot determine the direction of a causal relationship between atrophy and WM connectivity abnormalities; however, it does support the hypothesis that deep GM regions are more re-lated to WM abnormalities than other structures.
The PLSR results suggest that T2 FLAIR lesions in regions of the occipital and parietal lobes dealing with visual processing and integration may play an important role in subtle processing-speed dysfunction measured by the SDMT. Most interesting, our study by using similar methods in subjects with stroke, also revealed that ChaCo scores in occipital regions were significant predictors of SDMT performance (A.F.K., unpublished data, 2014). This finding, consistent across varying pathologies, populations, data acquisition techniques, and imaging parameters, provides valida-tion of the current approach and strengthens our confidence in the visual pathways/SDMT connection. The SDMT requires close visual tracking, which may be adversely affected by abnormalities in WM connecting to the primary visual cortex and associated areas. We also observed that WM abnormalities seem to be more predictive of SDMT performance than atrophy because the ChaCo scores were emphasized by the primary component of each model. However, that this effect may be due to the relatively low amount of atrophy seen in this population with early MS cannot be ruled out. Our work adds to the growing body of liter-ature suggesting that connectivity abnormalities of cognitively important cortical regions by injury to the interconnecting WM may provide a potential mechanism for cognitive dysfunction in MS.37,38
Limitations and Future Work
Tractography is a complex and error-prone process even in healthy subjects; there is currently no method that can fully cap-ture true in vivo anatomy. The NeMo Tool uses tractography in healthy controls to determine the effects of WM abnormalities in the MS cohort. WM connections vary from individual to individ-ual; therefore, the NeMo Tool may not be accurately representing a particular person’s connectivity. Calculating average ChaCo scores over a large number of healthy subjects minimizes this drawback. See On-line Appendix B for a quantitative analysis of the influence of the variability in healthy controls on the reliability of ChaCo scores. Another limitation lies in the binary nature of tract counting: A streamline was not counted differently if it went through⬎1 lesion. In the future, this process will be modified to account for such situations.
There may be other elements of cognition affected in this co-hort besides processing speed. Future studies will create a detailed picture of cognitive dysfunction in early MS. As the study expands to subjects with longer-term disease, we will also investigate func-tional areas other than cognition, for instance, motor impairment as measured by the Expanded Disability Status Scale. Another limitation is the relatively small number of healthy controls on which we based thezscores of cortical thickness, volume, and diffusion summary statistics. The size of the group is somewhat mitigated by the fact that they are age- and sex-matched to the patient population. Even so, this fact, coupled with the conserva-tive nature of the Crawfordttest, most likely contributed to the relatively low volume of abnormalities seen in the diffusion im-ages, including RD maps.
Finally, future studies will focus on more sophisticated and specific imaging of both cortical lesions and WM abnormalities. Cortical lesions, which have been shown to be prevalent even in early MS,39are most likely occurring in this population. The fact
that we are unable to detect cortical lesions with our current im-aging protocol could be a source of the weak association of GM atrophy and ChaCo scores. Future studies will address the role of cortical lesions on connecting WM by using appropriate imaging, for instance, double inversion recovery or phase-sensitive inver-sion recovery MR imaging. In addition, T2 FLAIR and diffuinver-sion imaging are not specific to the nature of WM abnormalities in MS, being demyelination, axonal loss, and so forth. Future studies will focus on more specific measures of WM, for instance, myelin water fraction imaging.
CONCLUSIONS
This work demonstrates, in a regionally unbiased manner, that abnormalities in WM arising from demyelination and/or inflam-mation in MS are intimately related to atrophy in connecting deep GM regions. In addition, it was shown that T2 FLAIR abnormal-ities in WM connecting to areas of the brain dealing with visual integration and possibly GM atrophy in subcortical areas are re-lated to subtle processing-speed changes in early MS, as captured by the SDMT. Successful application of the NeMo Tool indicates it has potential as an imaging-based biomarker to measure the impact of early inflammatory activity on behavioral changes and subsequent neuronal loss.
Disclosures: Ashish Raj—RELATED:Grant: Biogen Idec,* Novartis,*Comments: minor salary support as part of investigator-initiated research study at Weill-Cornell, which was supported by these companies; strictly academic research role. Susan A. Gauthier—
RELATED:Grant: EMD Serono,*Comments: partially supported a study from which some of these data are derived;UNRELATED:Consultancy: Genzyme;Grants/ Grants Pending: National Multiple Sclerosis Society,* Novartis,* Genzyme,* Biogen Idec.**Money paid to the institution.
REFERENCES
1. Pagani E, Bammer R, Horsfield MA, et al.Diffusion MR imaging in multiple sclerosis: technical aspects and challenges.AJNR Am J Neuroradiol2007;28:411–20
2. Gorgoraptis N, Wheeler-Kingshott CA, Jenkins TM, et al. Combin-ing tractography and cortical measures to test system-specific hy-potheses in multiple sclerosis.Mult Scler2010;16:555– 65 3. Rovaris M, Filippi M, Minicucci L, et al.Cortical/subcortical disease
burden and cognitive impairment in patients with multiple sclero-sis.AJNR Am J Neuroradiol2000;21:402– 08
4. Geurts JJ, Barkhof F.Grey matter pathology in multiple sclerosis.
Lancet Neurol2008;7:841–51
5. Calabrese M, Romualdi C, Poretto V, et al.The changing clinical course of multiple sclerosis: a matter of grey matter.Ann Neurol 2013;74:76 – 83
6. Geurts JJ, Stys PK, Minagar A, et al.Gray matter pathology in (chronic) MS: modern views on an early observation.J Neurol Sci 2009;282:12–20
7. Narayanan S, Fu L, Pioro E, et al.Imaging of axonal damage in mul-tiple sclerosis: spatial distribution of magnetic resonance imaging lesions.Ann Neurol1997;41:385–91
8. Shu N, Liu Y, Li K, et al.Diffusion tensor tractography reveals dis-rupted topological efficiency in white matter structural networks in multiple sclerosis.Cereb Cortex2011;21:2565–77
9. Rocca MA, Valsasina P, Martinelli V, et al.Large-scale neuronal net-work dysfunction in relapsing-remitting multiple sclerosis. Neurol-ogy2012;79:1449 –57
10. Bodini B, Khaleeli Z, Cercignani M, et al.Exploring the relationship between white matter and gray matter damage in early primary progressive multiple sclerosis: an in vivo study with TBSS and VBM.Hum Brain Mapp2009;30:2852– 61
11. Sbardella E, Petsas N, Tona F, et al.Assessing the correlation be-tween grey and white matter damage with motor and cognitive im-pairment in multiple sclerosis patients.PLoS One2013;8:e63250 12. Raj A, Kuceyeski A, Weiner M.A network diffusion model of disease
progression in dementia.Neuron2012;73:1204 –15
13. Zhou J, Gennatas ED, Kramer JH, et al.Predicting regional neuro-degeneration from the healthy brain functional connectome. Neu-ron2012;73:1216 –27
14. Mesaros S, Rocca MA, Kacar K, et al.Diffusion tensor MRI tractog-raphy and cognitive impairment in multiple sclerosis.Neurology 2012;78:969 –75
15. Hu B, Ye B, Yang Y, et al.Quantitative diffusion tensor determinis-tic and probabilisdeterminis-tic fiber tractography in relapsing-remitting mul-tiple sclerosis.Eur J Radiol2011;79:101– 07
16. Jones DK, Cercignani M.Twenty-five pitfalls in the analysis of dif-fusion MRI data.NMR Biomed2010;23:803–20
17. Pierpaoli C, Barnett A, Pajevic S, et al.Water diffusion changes in Wallerian degeneration and their dependence on white matter ar-chitecture.Neuroimage2001;13(6 pt 1):1174 – 85
18. Wheeler-Kingshott CA, Cercignani M.About “axial” and “radial” diffusivities.Magn Reson Med2009;61:1255– 60
19. Kuceyeski A, Maruta J, Relkin N, et al.The Network Modification (NeMo) Tool: elucidating the effect of white matter integrity changes on cortical and subcortical structural connectivity.Brain Connect2013;3:451– 63
20. Krishnan A, Williams LJ, McIntosh AR, et al.Partial least squares (PLS) methods for neuroimaging: a tutorial and review.Neuroimage 2011;56:455–75
21. Bergendal G, Fredrikson S, Almkvist O.Selective decline in informa-tion processing in subgroups of multiple sclerosis: an 8-year longi-tudinal study.Eur Neurol2007;57:193–202
22. Fischl B, Sereno MI, Dale AM.Cortical surface-based analysis. II: Inflation, flattening, and a surface-based coordinate system. Neu-roimage1999;9:195–207
23. Penny WD, Friston KJ, Ashburner JT, et al, eds.Statistical Parametric Mapping: The Analysis of Functional Brain Images.Burlington: Aca-demic Press; 2006:656
24. Smith SM.Fast robust automated brain extraction.Hum Brain Mapp2002;17:143–55
25. Crawford JR, Garthwaite PH, Ryan K.Comparing a single case to a control sample: testing for neuropsychological deficits and dissoci-ations in the presence of covariates.Cortex2011;47:1166 –78 26. Benjamini Y, Hochberg Y.Controlling the false discovery rate: a
practical and powerful approach to multiple testing.Journal of the Royal Statistical Society1995;57:289 –300
ch-emometrics.Chemometrics and Intelligent Laboratory System2001; 58:109 –30
28. Efron B, Tibshirani R.An Introduction to the Bootstrap.London: Chapman and Hall/CRC; 1994:456
29. Sˇida´k Z.Rectangular confidence regions for the means of multivar-iate normal distributions.J Amer Statist Assn1967;62:626 –33 30. Centofani CC. Selected Somatosensory and Cognitive Test
Perfor-mances as a Function of Age and Education in Normal and Neurologi-cally Impaired Adults [dissertation]. Ann Arbor: University of Michigan; 1975
31. Bate AJ, Mathias JL, Crawford JR.Performance on the Test of Every-day Attention and standard tests of attention following severe trau-matic brain injury.Clin Neuropsychol2001;15:405–22
32. Karpuk N, Burkovetskaya M, Kielian T.Neuroinflammation alters voltage-dependent conductance in striatal astrocytes. J Neuro-physiol2012;108:112–23
33. Cappellani R, Bergsland N, Weinstock-Guttman B, et al.Subcortical deep gray matter pathology in patients with multiple sclerosis is associated with white matter lesion burden and atrophy but not
with cortical atrophy: a diffusion tensor MRI study.AJNR Am J Neuroradiol2014;35:912–19
34. Tao G, Datta S, He R, et al.Deep gray matter atrophy in multiple sclerosis: a tensor based morphometry.J Neurol Sci2009;282: 39 – 46
35. Henry RG, Shieh M, Amirbekian B, et al.Connecting white matter injury and thalamic atrophy in clinically isolated syndromes.J Neu-rol Sci2009;282:61– 66
36. Mu¨hlau M, Buck D, Fo¨rschler A, et al.White-matter lesions drive deep gray-matter atrophy in early multiple sclerosis: support from structural MRI.Mult Scler2013;19:1485–92
37. Dineen RA, Vilisaar J, Hlinka J, et al.Disconnection as a mechanism for cognitive dysfunction in multiple sclerosis.Brain2009;132(pt 1): 239 – 49
38. Roosendaal SD, Geurts JJ, Vrenken H, et al.Regional DTI differences in multiple sclerosis patients.Neuroimage2009;44:1397– 403 39. Lucchinetti CF, Popescu BFG, Bunyan RF, et al.Inflammatory