ORIGINAL RESEARCH
Alteration of Human Fetal Subplate Layer and
Intermediate Zone During Normal Development on
MR and Diffusion Tensor Imaging
E. Widjaja S. Geibprasert S.Z. Mahmoodabadi S. Blaser N.E. Brown P. Shannon
BACKGROUND AND PURPOSE: The subplate layer and intermediate zone are the precursors for neo-natal white matter. The aims of this study were to evaluate 1) T1 and T2 signal intensity, and 2) FA of subplate and intermediate zone in postmortem fetuses and correlate with histology, and 3) T2 signal intensity of subplate and intermediate zone on antenatal MR imaging.
MATERIALS AND METHODS: Fourteen immersion-fixed normal brains from 18 to 25 gestational weeks underwent 1.5T MR imaging, including DTI and histologic examination. The subplate and intermediate zone were graded on a scale of 1–5 on T1 and T2, and FAs were evaluated and then correlated with age. Seventeen antenatal MR images from 20 to 26 gestational weeks with normal brain were evaluated by using the same grading.
RESULTS: On T1 postmortem MR imaging, subplate has lower signal intensity compared with inter-mediate zone; subplate signal intensity correlated positively (r ⫽ 0.66, P ⫽ .012) with age, and intermediate zone signal intensity correlated negatively (r ⫽ ⫺0.78, P ⫽ .001) with age. On T2 postmortem MR imaging, subplate has higher signal intensity compared with intermediate zone and remained persistently high in signal intensity; intermediate zone signal intensity showed moderate correlation (r⫽0.48,P⫽.086) with age. FA of subplate correlated positively (r⫽0.55,P⬍.001) with age; FA of intermediate zone correlated negatively (r⫽ ⫺0.64,P⬍.0001) with age. On histology, extracellular matrix decreased and cellularity increased in subplate layer, tangentially organized cellu-larity decreased, and projecting fibers became thicker in intermediate zone with increasing gestation. The findings on T2-weighted antenatal MR imaging were similar to T2-weighted postmortem MR imaging.
CONCLUSIONS:The changes in signal intensity and FA of subplate and intermediate zone in the second trimester reflect microstructural changes on histology.
ABBREVIATIONS:CSF ⫽ cerebrospinal fluid; DTI ⫽ diffusion tensor imaging; FA ⫽ fractional anisotropy; FOV⫽field of view; HASTE⫽half-Fourier acquired single-shot turbo spin-echo; ICC⫽ intraclass correlation coefficient; ROI⫽region of interest; TR⫽repetition time; TE⫽echo time
T
ransient laminar organization occurs during normal de-velopment of the fetal cerebrum. The 5-layer laminar compartments can be visualized consistently on postmortem MR imaging in fetuses from 15 to 26 postovulatory weeks, which corresponds to the laminar compartments as deline-ated by histochemical sections.1 These laminar compart-ments include 1) germinal matrix of high T1 signal intensity, 2) periventricular zone of low T1 signal intensity, 3) inter-mediate zone of moderately high T1 signal intensity, 4) sub-plate layer of lower T1 signal intensity, and 5) cortical sub-plate of high T1 signal intensity. The marginal zone cannot be visual-ized on MR imaging as a separate layer from the cortex. The laminar organization of the postmortem fetal brain has been described on T1-weighted images1,2 but not on T2-weighted images. Because antenatal fetal MR imaging relies predominantly on T2-weighted imaging for assessment, it isessential to understand the laminar organization of the fetal cerebrum on T2.
Apart from anatomic evaluation by using T1-weighted im-aging, laminar organization can also be visualized on DTI. Maas et al3have described the laminar organization of the human cerebrum in 24 and 25 week premature infants. On FA maps, the cortical plate has medium anisotropy, the subplate layer has low anisotropy, and the deep to subplate layer, which is composed of the intermediate zone, subventricular zone, periventricular zone, and germinal matrix, was of medium anisotropy. There are currently minimal data on diffusion changes in fetal cerebral lamination in fetuses younger than 24 weeks.4,5
The subplate layer is an important structure for neural migration and axonal guidance and has been found to be se-lectively vulnerable to hypoxic-ischemic injury in preterm in-fants.6,7The intermediate zone contains the fetal white matter. Both the subplate layer and intermediate zone are the precur-sors of neonatal white matter; therefore, it is important to understand the normal changes in the subplate layer and in-termediate zone on imaging to detect abnormal white matter development. The aims of this study were to evaluate 1) the signal intensity on T1- and T2-weighted imaging and 2) FA of the subplate layer and intermediate zone in postmortem fe-tuses in the second trimester and to correlate these findings
Received October 25, 2009; accepted after revision November 4.
From Diagnostic Imaging (E.W., S.G., S.Z.M., S.B., N.E.B), Hospital for Sick Children, Toronto, Canada; and Department of Pathology (P.S.), Mount Sinai Hospital, Toronto, Canada
This work was supported by the Ontario Foundation for Cerebral Palsy and Department of Medical Imaging, University of Toronto, Research and Development Award.
Please address correspondence to Elysa Widjaja, Diagnostic Imaging, Hospital for Sick Children, 555 University Ave, Toronto, ON, M5G 1X8, Canada; e-mail: Elysa.Widjaja @sickkids.ca
DOI 10.3174/ajnr.A1985
PEDIATRICS
ORIGINAL
with histology. Due to the potential for tissue fixation to affect T1 and/or T2 contrast,8-12we also assessed the signal intensity of the subplate layer and intermediate zone on T2-weighted imaging in antenatal fetal MR images.
Materials and Methods
The study had the approval of the institutional research ethics board, and written informed consent was obtained from parents. The inclu-sion criteria for the postmortem study were fetuses⬍30 gestational weeks and normal cerebral lamination as defined by histology. The exclusion criteria were significant tissue autolysis, brain malforma-tion, hemorrhage, or ischemia resulting in disruption of cerebral lam-inar organization. The gestational age was estimated based on mater-nal last menstrual period, sonographic assessment ⬃12 weeks gestational age, as well as sulcation and gyration pattern of the cere-bral hemispheres. Fourteen fetuses ranging from 18 to 25 weeks ges-tational age were included in the study. The fetuses were aborted due to extracranial anomalies.
Antenatal fetal MR imaging performed at our institution was retrospectively reviewed, and 17 fetuses between 20 and 26 weeks gestational age with normal antenatal MR images were recruited. The antenatal MR images were reviewed by 2 pediatric neuroradiologists independently (E.W. and S.B.) to confirm that the brain imaging was normal. The gestational age was estimated based on maternal last menstrual period and sonographic assessment⬃12 weeks gestational age. The indications for antenatal fetal MR imaging were suspected extracranial anomalies in 7 fetuses and Dandy-Walker malformation or corpus callosum agenesis in 10 fetuses.
Postmortem MR Imaging and DTI
Postmortem MR imaging was done by using a 1.5T CV/I magnet (GE Healthcare, Milwaukee, Wisconsin) with maximum gradient ampli-tude and slew rate of 40 mT/m and 150 T/m/s, respectively. Postmor-tem MR imaging was performed with an 8-channel knee coil follow-ing dissection and tissue fixation. Axial, sagittal, and coronal spin-echo T1 (TR, 500 ms; TE, 10 ms; FOV, 16 cm; section thickness, 2 mm; matrix, 320⫻256) and T2 (TR, 4115 ms; TE, 115 ms; FOV, 16 cm; section thickness, 2 mm; matrix, 320⫻256) and axial 3D T1 (TR, 23 ms; TE, 8 ms; FOV, 18 cm; section thickness, 1.0 mm; matrix, 256⫻256) were performed in all 14 cases. DTI was acquired by using single-shot echo-planar imaging (TR, 8300 ms; TE, 99 m; FOV, 160 mm; section thickness, 2 mm;b⫽700 mm/s2; NEX, 8; matrix, 128⫻
128, 25 directions) in 13 cases. Echo-planar distortion was automat-ically corrected on the scanner with Functool version 3.1.23 M4HD research mode (GE Medical Systems, Milwaukee, Wisconsin).
Autopsy
The fetal brains were removed at autopsy and immersion fixed for 14 days in formalin/5% acetic acid. Histology was performed by using standard paraffin embedding and sectioned at 6m in the coronal plane. Whole mounts were performed by using agar stabilization.13
Staining was done with hematoxylin-eosin or cresyl violet. Alcian blue stain was used to demonstrate acid mucopolysaccharide. Vimen-tin was used to identify cellular processes and radial glia, and neuro-filament was used to identify axons. Histology sections were reviewed by a neuropathologist (P.S.).
Antenatal MR Imaging
Antenatal fetal MR imaging was performed at 1.5 T (Magnetom Avanto; Siemens Medical Solutions, Erlangen, Germany) with maximum gradi-ent amplitude and maximum slew rate of 45 mT/m and 200 T/m/s, re-spectively. HASTE was performed in 3 planes with a body matrix coil by using the following parameters: TR, 1250 ms; TE, 166 ms; FOV, 31 cm; section thickness, 3.5 mm; matrix, 320⫻256.
Postmortem MR Imaging Analysis
The signal intensity of the subplate layer and intermediate zone was graded on T1- and T2-weighted imaging, by 2 raters independently (E.W. and S.G.). The intermediate zone and subplate layer were graded on a scale of 1 to 5 on T1 (1, same signal intensity as CSF; 2, slightly higher signal intensity than CSF; 3, intermediate signal intensity between CSF and cortex; 4, less hyperintense than cortex; 5, same signal intensity as cortex) and on T2 (1, same signal intensity as cortex; 2, slightly higher signal intensity than cortex; 3, intermedi-ate signal intensity between cortex and CSF; 4, less hyperintense than CSF; 5, same signal intensity as CSF).
DTI processing was performed by using DTIStudio V 2.4 (Johns Hopkins University, Baltimore, Maryland).
The DTI raw datasets were fitted to the diffusion tensor equations to yield 6 independent tensor elements14,15and subsequently 3
eigen-values (1,2, and3) and eigenvectors.16Maps of FA were then
calculated. Two assessors (E.W. and S.Z.M.) placed the ROIs manu-ally and independently onb⫽0 images and then transposed onto FA map. All ROIs measured 8 voxels in size and were placed in the sub-plate layer, which was immediately deep to the cortical ribbon. Simi-lar ROIs were also placed in the intermediate zone, adjacent to the lower signal intensity of the germinal matrix onb⫽0 images, and deep to the subplate layer (Fig 1). The ROIs were placed anteriorly at the level of frontal horn of lateral ventricles and posteriorly at the level of trigones of both hemispheres.
Antenatal MR Imaging Analysis
The signal intensity of the subplate layer and intermediate zone was graded on T2 antenatal MR imaging, by using the same grading scale as for T2 postmortem MR imaging (1, same signal intensity as cortex; 2, slightly higher signal intensity than cortex; 3, intermediate signal intensity between cortex and CSF; 4, less hyperintense than CSF; 5, same signal intensity as CSF). The grading was done by 2 raters independently (E.W. and S.G.).
Statistical Analysis
Data were analyzed by using SAS 9.2 (SAS Institute, Cary, North Carolina). The interrater agreement for grading of signal intensity of the subplate layer and intermediate zone on T1 and T2 postmortem MR imaging was assessed by usingstatistics. The interrater agree-ment on FA of the subplate layer and intermediate zone was evaluated by using ICC. The interrater agreement on T2 antenatal MR imaging was evaluated by usingstatistics. Kappa values and ICC of 0.00 – 0.20 indicated poor agreement, 0.21– 0.40 fair agreement, 0.41– 0.60 moderate agreement, 0.61– 0.8 substantial agreement, and 0.81–1.0 nearly perfect agreement. The mean grading of signal intensity and the mean FA of the 2 assessors were used for subsequent analysis.
intermediate zone, and also between FA or the subplate layer and intermediate zone with gestational age. Spearman correlation was performed between grading of the signal intensity of the subplate layer on T1 and T2, and FA of the subplate layer, as well as between grading of the signal intensity of the intermediate zone on T1 and T2 and FA of the intermediate zone on postmortem MR imaging. Spear-man correlation was also performed between grading of the subplate layer and intermediate zone on T2 antenatal MR imaging with gesta-tional age. APvalue of⬍.05 was considered statistically significant.
Results
Postmortem MR Imaging and DTI
There was substantial to nearly perfect agreement between the 2 raters for the subplate layer on T1 (ICC⫽0.73) and T2 (ICC⫽1.0), respectively, and nearly perfect agreement for the intermediate zone on T1 (ICC⫽1.0) and T2 (ICC⫽1.0). There was significant positive correlation between signal in-tensity of subplate on T1 postmortem MR imaging and gesta-tional age (r⫽0.66,P⫽.012) (Table). There was significant negative correlation between signal intensity of intermediate zone on T1 postmortem MR imaging and gestational age (r⫽
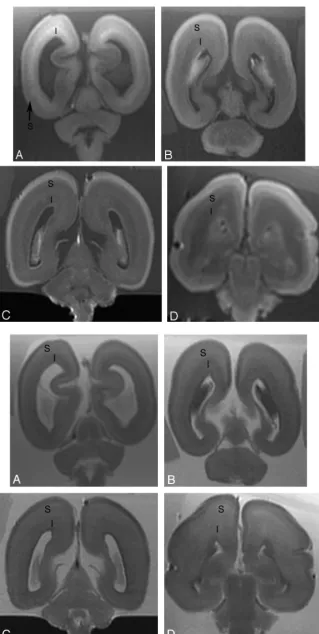
⫺0.78,P⫽.001). Below 20 weeks gestational age, the inter-mediate zone was of higher signal intensity on T1 compared with the subplate layer (Fig 2). Between 20 and 23 weeks ges-tational age, signal intensity gradually decreased in intermedi-ate zone and gradually increased in subplintermedi-ate layer on T1 post-mortem MR imaging, such that there was overlap between the signal intensity of intermediate zone and inner portion of sub-plate layer. After 23 weeks gestational age, the intermediate zone was of lower signal intensity on T1 compared with the subplate layer. There were 2 regions seen in the subplate layer: an outer zone of lower T1 signal intensity and an inner zone of higher T1 signal intensity.
There was no association between signal intensity of sub-plate on T2 postmortem MR imaging and gestational age (P⬎ .05), as signal intensity of subplate remained unchanged on T2 between 18 and 25 weeks gestational age. There was an associ-ation between signal intensity of intermediate zone on T2 postmortem MR imaging and gestational age, but this did not reach statistical significance (r⫽0.48,P⫽.086). The signal intensity of intermediate zone was lower than subplate layer on T2 postmortem MR imaging until⬃22–23 weeks (Fig 3). By 25 weeks, the signal intensity of intermediate zone was similar to subplate layer on T2 postmortem MR imaging.
There was moderate to substantial agreement between FA of the subplate layer anteriorly (ICC⫽0.49) and posteriorly (ICC⫽0.78), respectively. There was nearly perfect and sub-stantial agreement between FA of the intermediate zone ante-riorly (ICC⫽0.88) and posteriorly (ICC⫽0.70), respectively.
Fig 1.Postmortem coronal (AandC)b⫽0 images and fractional anisotropy maps (BandD) demonstrating place-ment of regions of interest in the subplate layer and inter-mediate zone anteriorly (AandB) and posteriorly (CandD). The corpus callosum has been injured during autopsy.
Spearman correlation between signal intensity and fractional anisotropy of subplate layer and intermediate zone on postmortem MR imaging with gestational age, and also between signal intensity of the subplate layer and intermediate zone on antenatal MR imaging with gestational age
Spearman Correlation with Gestational Age Postmortem MR imaging
Signal intensity on T1 Subplate layer r⫽0.66,P⫽.012 Intermediate zone r⫽ ⫺0.78,P⫽.001 Signal intensity on T2 Subplate layer No correlation,aP⬎.05
Intermediate zone r⫽0.48,P⫽.086 Fractional anisotropy Subplate layer r⫽0.55,P⬍.001
Intermediate zone r⫽ ⫺0.64,P⬍.0001 Antenatal MR imaging
Signal intensity on T2 Subplate layer No correlation,aP⬎.05 Intermediate zone r⫽0.67,P⫽.003
a
[image:3.594.54.383.45.335.2]There was no significant difference between FA of the 2 hemi-spheres (P⬎.05). FA in intermediate zone was higher than subplate layer (P⬍.0001). FA of the anterior subplate layer and intermediate zone was slightly higher compared with the
posterior subplate layer and intermediate zone, but the differ-ence did not reach statistical significance (P⫽.09). There was a positive correlation between FA of subplate layer and gesta-tional age (r⫽ 0.55,P ⬍.001) and a negative correlation
Fig 2.Postmortem coronal T1-weighted images at (A) 18 weeks, (B) 22 weeks, (C) 23 weeks, and (D) 25 weeks gestational age. At 18 gestational weeks, the intermediate zone (I) is of higher T1 signal intensity and the subplate layer (S) is of lower T1 signal intensity. With increasing gestational age, there is a reduction in the high T1 signal intensity of the intermediate zone and an increase in the signal intensity of the subplate layer. At approximately 22 weeks, the distinc-tion between the intermediate zone and subplate layer is decreased on T1.
[image:4.594.54.374.38.673.2]between FA of intermediate zone and gestational age (r ⫽
⫺0.64,P⬍.0001) (Fig 4).
There was significant correlation between FA of subplate layer and signal intensity of subplate layer on T1 (r⫽0.58, P⫽.037). There was no correlation between FA of subplate and signal intensity of subplate on T2 postmortem MR imag-ing, as the signal intensity remained unchanged on T2. There was no significant correlation between FA of intermediate zone and signal intensity of intermediate zone on T1 (r⫽0.41, P ⫽ .160) or T2 (r ⫽ ⫺0.33, P ⫽ .264) postmortem MR imaging.
Autopsy
The subplate layer was hypocellular and had abundant extra-cellular matrix at 18 weeks gestational age (Fig 5). With in-creasing gestation, the subplate layer became more cellular, and the deep subplate merged with the intermediate zone with an increase in the attenuation of stainable cell processes in both the subplate layer and intermediate zone (Fig 6). Stain-able acid mucopolysaccharide, which formed most extracellu-lar matrix in the developing brain, was abundant in the sub-plate layer but was absent in the intermediate zone at 18 weeks (Fig 7). With increasing gestation, the acid mucopolysaccha-ride increased in the intermediate zone. At 18 weeks, the in-termediate zone was highly cellular, particularly the superficial region, which formed an attenuated tangential stripe (Fig 5), separated from the deeper aspects of the intermediate zone by the developing fiber system. As development progressed, the intermediate zone became less cellular as a whole, and the deep projecting fiber system became thicker as visualized on the neurofilament stain (Fig 6). The superficial region of the in-termediate zone became harder to distinguish from the sub-plate layer with increasing gestational age.
Antenatal MR Imaging
There was nearly perfect agreement between the 2 raters for the subplate layer (ICC⫽0.88) and intermediate zone (ICC⫽ 1.0) on T2. There was no association between signal intensity of subplate on T2 antenatal MR imaging and gestational age (P⬎.05), as signal intensity of subplate remained unchanged
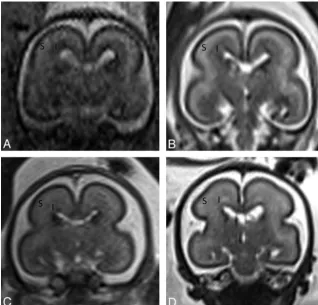
on T2 between 20 and 26 weeks gestational age. There was significant correlation between signal intensity of intermedi-ate zone on T2 antenatal MR imaging and gestational age (r⫽0.67,P⫽.003) (Table 1). The signal intensity of inter-mediate zone was lower than subplate layer on T2 antenatal MR imaging until⬃22–23 weeks (Fig 8). By⬃25 weeks, the signal intensity of intermediate zone was similar to subplate layer on T2 antenatal MR imaging.
Discussion
The subplate layer contains cells dispersed within the loose plexiform network of fibers and embedded in abundant and hydrophilic extracellular matrix.1,17-19 Kostovic et al1 de-scribed low T1 signal intensity in the subplate layer between 15 and 26 postovulatory weeks, and an increase in T1 signal in-tensity in the subplate layer between 27 and 30 postovulatory weeks in the postmortem brain. The increase in T1 signal in-tensity in the subplate layer reduced the contrast difference between the subplate layer and intermediate zone. However, the superficial aspect of subplate layer, immediately below the cortical plate, remains visible as a narrow band of low T1 signal intensity, due to the presence of growing thalamocortical fi-bers. Rados et al20found the subplate layer attained its devel-opmental peak, with respect to the thickness of the subplate layer, between 27 and 30 postovulatory weeks. However, tran-sient fetal lamination as visualized on postmortem MR imag-ing reaches prominence between 22 and 26 postovulatory weeks.20We have found the increase in T1 signal intensity of the subplate layer to have occurred earlier, from⬃22 weeks onward in the postmortem brain. The increase in T1 signal intensity of the subplate layer could be related to the reduction in extracellular matrix, increase in cellularity, and increase in stainable cell processes. The reduction in extracellular matrix in the subplate layer occurs after the thalamocortical fibers penetrate into the cortical plate,1,21which was present by 24 postovulatory week. Between 20 and 23 postovulatory weeks, the number of synapses in the subplate layer increases,22,23 which could also contribute to the altered T1 signal intensity of the subplate layer.
The intermediate zone is composed of the fetal “white
[image:5.594.52.531.44.239.2]matter,” which includes large bundles of growing axons, mi-gratory neurons, and immature glial cells.20Previously, the intermediate zone has been described as having high T1 signal intensity between 18 and 26 postovulatory weeks.1The timing of signal intensity alteration of the intermediate zone was not
clear in the literature. The changes in the lamination pattern of the human fetal cerebrum on MR imaging were considered to be predominantly due to changes in the appearance of the subplate layer.1However, we have found that alteration in the cerebral lamination from 20 to 25 gestational weeks was
[image:6.594.55.535.40.603.2]due to altered signal intensity of both the subplate layer and intermediate zone. There was a gradual reduction of the high T1 signal intensity and increase of the low T2 signal intensity of the intermediate zone from⬃22 weeks, which correlated with reduced cellularity, an increase in the thickness of deep projecting fibers, and an increase in acid mucopolysaccharide on histology.
Kostovic et al1and Chong et al2have used T1-weighted imaging, whereas we have used both T1- and T2-weighted imaging to evaluate the laminar organization of the post-mortem fetal brain. We have found altered signal intensity in the intermediate zone on both T1- and T2-weighted imag-ing with increasimag-ing gestational age. In the subplate layer, the signal intensity alteration was best appreciated on T1-weighted imaging, but remained unchanged on T2 between 18 and 25 gestational weeks. With increasing T2 signal intensity of the intermediate zone in the postmortem brain, the con-trast difference between the subplate layer and intermediate zone was minimal by 25 weeks. We have found similar find-ings on antenatal T2-weighted MR images. The subplate layer
was of persistently higher T2 signal intensity between 20 and 26 gestational weeks on antenatal MR imaging. The interme-diate zone demonstrated lower T2 signal intensity compared with the subplate layer between 20 and 22 gestational weeks, and by 25 gestational weeks there was no contrast difference between the intermediate zone and subplate layer on ante-natal MR imaging. Maas et al3also found difficulty in dis-tinguishing the subplate layer from the intermediate zone on T2 in 2 premature infants at 25 and 27 gestational weeks.
We have found that FA of the subplate layer was lower relative to the intermediate zone. Huang et al24assessed 2 post-mortem fetuses at 19 and 20 gestational weeks and found re-duced anisotropy of the subplate layer relative to the cortex. Maas et al3evaluated 2 premature infants at 25 and 27 gesta-tional weeks and demonstrated that the subplate layer was of lower anisotropy compared with the intermediate zone, find-ings similar to ours. Neil et al25also found lower anisotropy in the subplate layer in premature neonates from 31 to 41 gesta-tional weeks. The higher extracellular matrix in the subplate layer could have contributed to the lower FA. The tangential
Fig 6.Whole mounts of fetal cerebrum at (A) 18 and (B) 25 gestational weeks stained with neurofilament to demon-strate axons and vimentin to demondemon-strate cell processes and radial glia. By 25 gestational weeks, the deep subplate merged with the intermediate zone with an increase in cell processes in both the subplate layer and intermediate zone. Neurofilament stain shows increased fibers (reddish brown) within the intermediate zone.
[image:7.594.57.387.43.489.2]stripes of migratory cells and bundles of fibers in the inter-mediate zone1could have accounted for the higher anisotropy in the fetal white matter, even before the onset of myelination. We have also found a negative correlation between anisotropy of the intermediate zone and gestational age, which could be related to migration of tangential stripes of neurons away from the intermediate zone, an increase in acid mucopoly-saccharide, and evolution of radial glia into astrocytes and neuroblasts. There was a significant positive correlation be-tween FA of the subplate layer and gestational age, which could be related to a reduction in extracellular matrix, an in-crease in migratory neurons, and an inin-crease in cell processes. Gupta et al4evaluated 15 unfixed postmortem fetal brains from 15 to 37 gestational weeks and have found that FA values in the subplate layer showed an inverse correlation with ges-tational age, but this did not reach statistical significance. They did not find a significant correlation between FA in the inter-mediate zone and gestational age. Trivedi et al5evaluated 50 unfixed postmortem fetal brains from 12 to 42 weeks and demonstrated decreasing FA in the subplate layer and increas-ing FA in the intermediate zone with gestational age; however, it was not clear if these changes were statistically significant. Of the 50 fetuses in the cohort, they have assessed FA of the subplate layer and intermediate zone in 15 fetuses from 17 to 30 gestational weeks, and of these cases, approximately half were less than 24 gestational weeks. In contrast to the findings by Gupta et al4and Trivedi et al,5we have found increasing FA in the subplate layer and decreasing FA in the intermediate zone in the second trimester. In our study, we have evaluated fetuses over a narrower age range within the second trimester. In the study by Gupta et al,4the greater number of fetuses in the third trimester, which corresponded to the period of
subplate dissolution, may have accounted for the reduced anisotropy of the subplate layer. Further development, thick-ening, and organization of projecting axons may lead to in-creased FA in the intermediate zone in the third trimester.
One of the concerns of extrapolating data from postmor-tem MR imaging of fixed brain was that tissue fixation may alter the signal intensity characteristics of the brain on either T1- or T2-weighted imaging. Formaldehyde fixation of tissue promotes membrane protein cross-linking to each other and/or to adjacent proteins located in the intra- and extra-cellular spaces,26-28 and immobilization of water molecules and may lead to a reduction of T1 and T2 values.8-12We have not quantified T1 or T2 values in the postmortem fetal MR images, but we have visually assessed the relative signal inten-sity of the subplate layer and intermediate zone relative to cortex and CSF. Using the same grading system as on post-mortem MR imaging, we have assessed the subplate layer and intermediate zone on T2-weighted antenatal MR images and have found similar findings. As T1-weighted imaging is not routinely performed on antenatal MR imaging, we have not assessed the T1 signal intensity alteration of the subplate layer and intermediate zone on antenatal MR imaging. The ob-served signal intensity alteration of the subplate layer and in-termediate zone on T1-weighted postmortem MR imaging is likely to be a marker of microstructural changes that occur secondary to brain development rather than fixation artifacts, as the signal intensity alterations on postmortem T2-weighted imaging corresponded to those observed on antenatal T2-weighted imaging.
DTI studies in postmortem brains raised 2 concerns; first, the effects of death and second, the effects of tissue fixation on DTI indices. Kim et al29demonstrated that there was no
[image:8.594.53.372.43.348.2]nificant alteration in FA in mouse spinal cord white matter in vivo before death, in situ 10 hours after death, and ex vivo 15 weeks after immersion fixation. Sun et al30,31found that tissue fixation resulted in reduction in trace of 30%– 80% but no significant alteration in anisotropy level. Shepherd et al12also showed that tissue fixation resulted in increase in extracellular apparent diffusion coefficient. Sun et al32evaluated the optic nerves of mice and found that between in vivo and prefixed postmortem, axial and radial diffusivity decreased by 50%– 70%, and from prefixed postmortem to fixed postmortem, axial and radial diffusivity decreased by up to 50%. Because tissue fixation may influence trace, axial, and radial diffusivity, any observed changes in trace, axial, and radial diffusivity secondary to increasing gestation could potentially be con-founded by changes related to tissue fixation. We have therefore used FA to detect changes in the subplate layer and intermediate zone, as FA was less likely to be affected by tissue fixation.29-31However, caution is advised in directly extrapolating FA values from postmortem specimens to in vivo cases.
In summary, we have found signal intensity alteration on T1- and T2-weighted imaging as well as FA of the subplate layer and intermediate zone on postmortem MR imaging, which corresponded to changes in a variety of histologic pa-rameters, including extracellular matrix, cellularity, and axons between 18 and 25 gestational weeks. The observed sig-nal intensity alteration is unlikely to be due to fixation artifacts as we observed similar signal intensity alteration on antenatal T2-weighted imaging as on postmortem T2-weighted imag-ing. Understanding the normal changes in the subplate layer and intermediate zone is important before such knowledge can be incorporated in the antenatal assessment of normal development, white matter injury in fetuses from ischemia or infection, as well as abnormal white matter development in association with brain malformations.
References
1. Kostovic I, Judas M, Rados M, et al.Laminar organization of the human fetal cerebrum revealed by histochemical markers and magnetic resonance imag-ing.Cereb Cortex May2002;12:536 – 44
2. Chong BW, Babcook CJ, Salamat MS, et al.A magnetic resonance template for normal neuronal migration in the fetus.Neurosurgery1996;39:110 –16 3. Maas LC, Mukherjee P, Carballido-Gamio J, et al.Early laminar organization
of the human cerebrum demonstrated with diffusion tensor imaging in extremely premature infants.Neuroimage2004;22:1134 – 40
4. Gupta RK, Hasan KM, Trivedi R, et al.Diffusion tensor imaging of the devel-oping human cerebrum.J Neurosci Res2005;81:172–78
5. Trivedi R, Husain N, Rathore RK, et al.Correlation of diffusion tensor imaging with histology in the developing human frontal cerebrum.Dev Neurosci
2009;31:487–96
6. Volpe JJ.Encephalopathy of prematurity includes neuronal abnormalities.
Pediatrics2005;116:221–25
7. McQuillen PS, Ferriero DM.Perinatal subplate neuron injury: implications for cortical development and plasticity.Brain Pathol2005;15:250 – 60 8. Dawe RJ, Bennett DA, Schneider JA, et al.Postmortem MRI of human brain
hemispheres: T2 relaxation times during formaldehyde fixation.Magn Reson Med2009;61:810 –18
9. Grinberg LT, Amaro E Jr, Teipel S, et al.Assessment of factors that confound MRI and neuropathological correlation of human postmortem brain tissue.
Cell Tissue Bank2008;9:195–203
10. Tovi M, Ericsson A.Measurements of T1 and T2 over time in formalin-fixed human whole-brain specimens.Acta Radiol1992;33:400 – 04
11. Pfefferbaum A, Sullivan EV, Adalsteinsson E, et al.Postmortem MR imaging of formalin-fixed human brain.Neuroimage2004;21:1585–95
12. Shepherd TM, Thelwall PE, Stanisz GJ, et al.Aldehyde fixative solutions alter the water relaxation and diffusion properties of nervous tissue.Magn Reson Med2009;62:26 –34
13. Game M.Embedding in agar/paraffin.In: Masson P, ed.Histological Tech-niques.New York: Springer; 1976:95
14. Pierpaoli C, Basser PJ. Toward a quantitative assessment of diffusion anisotropy.Magn Reson Med1996;36:893–906
15. Pierpaoli C, Jezzard P, Basser PJ, et al.Diffusion tensor MR imaging of the human brain.Radiology1996;201:637– 48
16. Basser PJ, Mattiello J, LeBihan D.MR diffusion tensor spectroscopy and imag-ing.Biophys J1994;66:259 – 67
17. Pearlman AL, Sheppard AM.Extracellular matrix in early cortical develop-ment.Prog Brain Res1996;108:117–34
18. Judas M, Milosevic NJ, Rasin MR, et al.Complex patterns and simple architects: molecular guidance cues for developing axonal pathways in the telencephalon.Prog Mol Subcell Biol2003;32:1–32
19. Margolis RU, Margolis RK.Chondroitin sulfate proteoglycans as mediators of axon growth and pathfinding.Cell Tissue Res1997;290:343– 48
20. Rados M, Judas M, Kostovic I.In vitro MRI of brain development.Eur J Radiol
2006;57:187–98
21. Kostovic I, Jovanov-Milosevic N.The development of cerebral connections during the first 20 – 45 weeks’ gestation.Semin Fetal Neonatal Med2006; 11:415–22
22. Molliver ME, Kostovic I, van der Loos H.The development of synapses in cerebral cortex of the human fetus.Brain Res1973;50:403– 07
23. Kostovic I, Rakic P.Developmental history of the transient subplate zone in the visual and somatosensory cortex of the macaque monkey and human brain.J Comp Neurol1990;297:441–70
24. Huang H, Zhang J, Wakana S, et al.White and gray matter development in human fetal, newborn and pediatric brains.Neuroimage2006;33:27–38 25. Neil JJ, Shiran SI, McKinstry RC, et al.Normal brain in human newborns:
apparent diffusion coefficient and diffusion anisotropy measured by using diffusion tensor MR imaging.Radiology1998;209:57– 66
26. Fishbein KW, Gluzband YA, Kaku M, et al.Effects of formalin fixation and collagen cross-linking on T2 and magnetization transfer in bovine nasal car-tilage.Magn Reson Med2007;57:1000 –11
27. Metz B, Kersten GF, Hoogerhout P, et al.Identification of formaldehyde-induced modifications in proteins: reactions with model peptides.J Biol Chem
2004;279:6235– 43
28. Puchtler H, Meloan SN.On the chemistry of formaldehyde fixation and its effects on immunohistochemical reactions.Histochemistry1985;82:201– 04 29. Kim JH, Trinkaus K, Ozcan A, et al.Postmortem delay does not change
re-gional diffusion anisotropy characteristics in mouse spinal cord white matter.
NMR Biomed2007;20:352–59
30. Sun SW, Neil JJ, Liang HF, et al.Formalin fixation alters water diffusion coef-ficient magnitude but not anisotropy in infarcted brain.Magn Reson Med
2005;53:1447–51
31. Sun SW, Neil JJ, Song SK.Relative indices of water diffusion anisotropy are equivalent in live and formalin-fixed mouse brains.Magn Reson Med
2003;50:743– 48