Abstract— This paper presents a real time degraded 1D barcode restoration method applied to a flow of frames representing images coming from a webcam device. This degradation could come from dirty, dusty products or discarded barcode resulting in touched or missing parts of bars. In the proposed restoration method, a fast directional median filtering (FDMF) and robust barcode detection are developed. The barcode detection is based primarily on the barcode orientation determination to be used as an important parameter for a directional filtering. The calculation of this orientation is not trivial and becomes more and more difficult with increasing degradation especially for poor quality and damaged barcodes. In the present work, an image bloc gradient is first used to detect the presence of barcode strips represented by high gradient and secondly these high gradient areas are used to calculate accurately the orientation of those areas. The resulting bloc orientations are clustered to finally give the dominant orientation of the barcode using a probability density function. Only blocs that are around the dominant orientations with a small difference are kept, and then a fast directional median filtering is applied linked to the dominant orientation in order to restore or repair the damaged bars. Experimental results on some degraded images in real time show the efficiency and the ability of the model to yield correct barcode restoration even with touched and discarded barcode.
Index Terms—Orientation estimation, barcode detection, barcode restoration, directional mean filtering
I. INTRODUCTION
HE barcode systems become increasingly involved in many fields of daily life. They are easy to use and make possible to enter data much more quickly than by manual methods and are highly reliable. Their speed and reliability
Manuscript received March 23, 2012; revised April 16, 2012. This work was supported in part by the Algerian MESRS (Higher Studies Ministry of Scientific Research.
A. Namane is with the University Saad Dahlab of Blida, Dept. of Electronics, Signal and Image Laboratory, Route de Soumaa BP.270, Blida, Algeria (phone: 025433850; fax: 025433850; e-mail: namane_a@ yahoo.fr).
M. Arezki is with the University Saad Dahlab of Blida, Dept. of Electronics, Signal and Image Laboratory, Route de Soumaa BP.270, Blida, Algeria (phone: 025433850; fax: 025433850; e-mail: arezki_md@ yahoo.fr).
E.H. Soubari is with the University of Strasbourg, Photonics Systems Laboratory, Parc d’innovation, boulevard Sébastien Brant BP10412 F-67412 Illkirch, Strasbourg, France (e-mail: [email protected]).
P. Meyrueis is with the University of Strasbourg, Photonics Systems Laboratory, Parc d’innovation, boulevard Sébastien Brant BP10412 F-67412 Illkirch, Strasbourg, France (e-mail: [email protected]).
.
allow the improving of many operations, such as manufacturing, forwarding, reception and packing, orders preparations, inventory, and management of files. Barcodes can be found in the supermarkets, the libraries, the banks of blood, the factories…etc. They are sensed with reading devices in manual or automatic modes. The term of barcodes is used to describe a large range of techniques of encoding of data that are machine-readable optically.
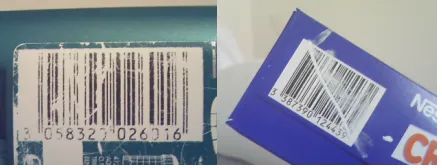
[image:1.612.313.534.402.486.2]A code of bars, often called “barcode” represents a graphic encoding of data. According to the algorithms of coding, this coding is optimized to fit the needs to encode texts, numerals, characters of punctuation or a combination of both. The representation obtained is optimized for an optical reading. The bars must be contrasted, with spaces between them which explain why they are often constituted of black features on white zone. It should be known that spaces can also codify information.
Fig. 1. Low quality and damaged image barcodes
The main aim of the method that we propose is to provide a way to repair accurately and rapidly the damaged barcodes and in real time. The bars could be barred and discarded, and in any orientation. The barcodes detection or identification is an important step in our work and must be achieved before the restoration phase. This detection is usually trivial in case of clean barcodes, but this operation could not detect correctly barcodes in the case of degraded barcodes. Most of the commercial systems like those based on laser beams or camera devices for barcode acquisition use a number of predefined angles to scan a given barcode. This scanning is unnecessary when the barcode is cut or barred. The reading accuracy is inversely proportional to the barcode degradation. The system that we propose aims first to locate and determine the barcode orientation, and secondly it uses a directional filter in order to restore the distorted barcode. Thus the barcode needs to be detected first and then its orientation must be accurately determined.
In spite of significant improvements in the area of barcode reading [1][2], the recognition of degraded barcodes where the bars are touched or discarded in low resolution
Fast Directional Median Filtering for Real Time
Restoration of Degraded 1D Barcode from
Webcam Images
Abderrahmane NAMANE, Madjid AREZKI, El Houssine SOUBARI and Patrick MEYRUEIS
and low contrast images (see Fig.1), is still lacking satisfactory solutions [1][6][7]. Studies concerning the designing of systems for barcode detection were in progress during the last decade [3][4][5]. A. Zemberletti et al. [6] proposed a method of restoration to solve the problem of 1D barcode images acquired by mobile phone without autofocus. They used a multilayer neural network for image restoration in order to improve their selected algorithm. D. Chai and F. Hock [7] used a bloc-based technique to locate a barcode. Their work rely on seven operations, namely, transformation of the input into non overlapping blocks of size 32 by 32 image, binarization of every block independently by using a global thresholding, skeletonization of each binarized block, connected component labeling, label region block orientation is estimated using the 2nd order moment. Their work involved the whole image pixels in the seven operations starting with non-overlapping blocks and ending with 2nd order moment. This makes their method time consuming and finally not suitable for real time applications. A. Namane et al. [8] proposed a real time 1D barcode detection method based on the least square method to determine the bars orientation. The resulting orientations are clustered to finally give the dominant orientation of these bars. Then the Hough transform is used, only through one orientation, to determine the line that cross all the centroid bars. Their proposed method suggested that the bars are not touched or discarded but could be extracted from low resolution and low contrast images. R. Janapriya et al. [9] proposed a method for barcode recognition using webcam. The method is based, first, on the detecting and localizing of the barcode. The procedure is based on a number of steps; they transformed the image input into image edges, and morphological dilation was applied through four directions (0°, 45°, 90 and 135°). Then a higher response coming from an absolute difference of two images is selected. Dilation and erosion are applied to that contour. They introduced a formula to select the blob which corresponds to barcode area from that image. Their detection method involved several low levels processing which makes the method time consuming, particularly for real time applications like those using mobile phone for image acquisition. M. Y. Sherin and M. S. Rana [10] proposed an effective method to utilize the specific graphic features of barcodes for positioning and recognition purposes even in case of distorted barcodes. They use a contour tracing process to locate all the closed contours in the binarized images. These closed contours represent also the strips or the bars of a barcode. They use a clustering operation of bars that have the same orientation and spacing. Their method fails when the strips or bars are touched or cut into many segments.
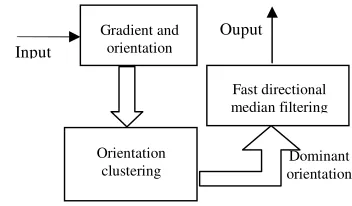
The method that we propose aims to process barcodes with touched and/or cut discarded strips for restoration applications. Our study is based first on robust barcode detection using a gradient bloc image and secondly on an effective barcode orientation determination using PDF, and third on the use of fast directional median filtering to make the method (FDMF) a real time application. The FDMF aims to restore or repair only the distorted bars by filling the gaps or removing the stains. Figure 2 shows a block diagram of the proposed method. Our paper is organized as follow: Section 2 describes the proposed method, namely, bloc
[image:2.612.342.518.107.210.2]gradient and orientation, orientation clustering and fast directional median filtering. Finally, section 3 presents and discusses experimental results.
Fig. 2. Proposed method bloc diagram
II. PROPOSED METHOD
A. High area gradient localization
The gradient operation is performed on the input image after the application of a Gaussian filtering. The filtered image f of size NxN is decomposed into non overlapping blocs of size MxM. The size M was determined experimentally and set to 7. The gradient of the image bloc g of coordinates (k,l) is calculated as follows:
) 1 , ( ) , 1 ( ) 1 , 1 ( ) , ( ) , ( 1 -M 0 1 -M 0 + − + + + + − = ∇
∑∑
= = y x f y x f y x f y x f l k fx y (1)
≥ = otherwise 255 )) , ( ( 0 ) , ( M l k f mean l k
g (2)
Where: M M l k f l k f mean x ) , ( )) , ( (∇ =∇
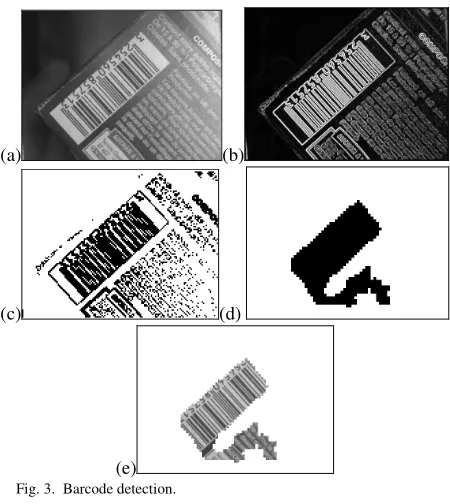
With (k,l)=0,1,2,……,N/M. The image gradient is thresholded using equation (2). The resulted image is not well clustered (see Fig. 3c), and presents many gaps in the barcode and also other parts that are not part of the barcode. Thus, to keep and enhance only the barcode area and reduce the other parts, we attempted to use the following relation:
∇ ≥ = otherwise 255 )) , ( ( 0 ) , ( δ l k g mean l k
gclust (3)
(a) (b)
(c) (d)
[image:3.612.72.297.44.296.2](e)
Fig. 3. Barcode detection.
The parameter δranges from 0.3 to 0.7 depending, on the image barcode degradation, it is used to remove the damaged areas from the barcode zone, its effect will be discussed in section 3. Figure 3d and 3e show the application of equation (3) to the thresholded image gradient and superposition of the original image with the clustered image gradient respectively. According to these results, the detected area includes barcodes, but could also include printed character which represents the higher gradient areas. To keep only the barcode, we introduce the bloc orientation estimation to determine the dominant orientation. Our concept is that barcode areas have a uniform orientation whereas other objects areas have a non uniform one.
B. Gradient area orientation estimation
In this step, we use only the high gradient areas detected in the previous step. First we decompose these areas into non overlapping blocs of size WxW. Second the size W was determined experimentally and set to 13. For each bloc the orientation is calculated [11] using the following formula:
) tan( 2 1
V H T T a
=
θ (4)
Where :
∑ ∑
−= −
=
∇ ∇
=
1
0 1
0
) , ( . ) , ( . 2
W
x W
y
V H
H f x y f x y
T
[
]
[
]
∑ ∑
−= −
=
∇ − ∇
=
1
0 1
0
2 2
) , ( )
, (
W
x W
y
V H
V f x y f x y
T
∑ ∑
+− =
+
− =
+ + + + =
∇
1
1 1
1
H( 1, 1). ( , )
Sob )
, (
u v
H x y u v f x u y v
f
∑ ∑
+− =
+
− =
+ + + + =
∇
1
1 1
1
V( 1, 1). ( , )
Sob )
, (
u v
V x y u v f x u y v
f
1 2 1
0 0 0
1 2 1
SobH
− − −
= and
1 0 1
0 0 2
1 0 1
SobV − −
− − =
As it can be noticed from Fig. 4, the barcode is represented by a uniform and unique orientation, but the other areas are represented by a non uniform orientation. This leads us to estimate the dominant orientation, and we can use it to remove the other parts and keep only blocs orientation that are corresponding to the barcode. Hence we use the orientation clustering [8] to calculate accurately the dominant orientation.
(a)
(b)
(c)
(d)
Fig. 4. Results of orientation determination applied to image blocs (a) Image parts of high gradient area (b) Image orientation of high gradient area (c) Image parts that are close to the dominant orientation (θ=131.743 degrees) (d) Correctly detected barcode.
C. Orientation clustering
Once all the bloc image orientations are obtained, a clustering procedure can be applied to determine the dominant orientation. The orientations are grouped into clusters for different integer values of θ ranging from 0 to 180 degrees with a resolution of δθ=1degree. An accumulator A is used for bloc orientation. Orientations should be considered as integer values; the accumulator is then incremented for a specific integer orientation θiwhen
this orientation is encountered by half resolution in both sides as follows:
[image:3.612.318.462.144.548.2]where |*| designates absolute value. All blocs orientation contribute in the construction of A. To find the dominant orientation, we use a probability function (PDF) [8] for θ
ranging from 0 to 180 degrees with a resolution of
δθ=1degree. With the PDF attained, the correct value is found by computing the mass center of the densest interval among the interval with a given length T. The best value for the interval T is found experimentally to be equal to 4. The densest interval is noted by λ, and the mass center mλ of the
interval λ is calculated as follow:
∑
∑
∈ ∈
=
λ θ
λ θ λ
θ θ θ θ
) (
) ( . ) (
A A
m (6)
The dominant orientation is then given by the following equation:
θ = argmax{ mλ(θm)} (7) m=0,1,2….,180-1
The bloc selection of a barcode is mainly based on the dominant orientation. Figure 4d shows a well detected and localized barcode, with a dominant bloc orientation of
θ=131.743 degrees.
The barcode orientation is perpendicular to the dominant bloc orientation and could be simply calculated;
θbarcode = θ −90=41.743 degrees. Results of application of
this procedure is shown in Fig. 4c.
D. Fast directional median filtering
Directional median filtering is widely used in the area of image enhancement and restoration [11], [12]. It consists in replacing a pixel with a median value of a selected neighborhood through a specified direction. For the proposed work, the median value of known pixels in the dominant direction is calculated, and then, a damaged pixel is replaced by the median of the obtained value.The selected neighborhood is a straight line of one pixel thick along the dominant orientation. According to many experiments, the length was fixed to L=51 pixels taking into account the position of the product to be at different distances which makes the barcode to appear large or small. This value of L is able to fill gaps or remove segments of length Lx=25
pixels (L=2.Lx+1). The direct application of DMF with a
length equal to 51 pixels is time consuming and does not fit for real time application. We introduced a new way of manipulating the increasing ordering of the selected neighborhood. We use the ordering only once in the beginning of a line direction instead for all the pixels that belong to that entire line. The fast directional median developed in the frame of this work is explained as follows: Start:
1) Neighborhood setting and ordering: pixels are processed through a certain direction θ for a given P0,
the neighborhood starts at P0-25 and ends at P0+25:
Save P0-25->Init_pixel and P0+25+1->Last_pixel. Order
the pixels of the neighborhood in the increasing intensity
and save in Ac[k], k=0,1,…,50 and keep the median value Ac[25].
2) Move to the next pixel P0+1, the neighborhood starts
with P0-25+1 and ends with P0+25+1, that means the
Init_pixel (P0-25) is removed from the neighborhood and
the Last_pixel (P0+25+1) is inserted. Hence to calculate
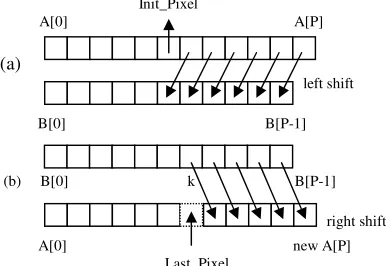
the median value we don’t have to reorder the new neighborhood but keep the last one with two changes on A[k]; first, remove Init_pixel value from A[k] and shift all values of A[k] (A[k]->B[k]) to the left in order to fill in the gap created by the removing of Init_pixel value as illustrated in Fig.5a.
Init_Pixel
A[0] A[P]
(a) left shift
B[0] B[P-1]
(b) B[0] k B[P-1]
[image:4.612.326.519.194.327.2]right shift A[0] new A[P] Last_Pixel
Fig. 5. Illustration of fast median filtering.
Second, compare Last_pixel value to all values of B and determine the position k, where Last_pixel value is just less or equal than B[k], then shift all values of B[k] (B[k]->A[k]) to the right in order to create a gap as illustrated in Fig.5b. The Last_pixel value is then inserted in the position k. Finally the median value is given by A[25]. The values of Init_pixel and Last_pixel must be saved before continuing the process, in this case; P0-25+1->Init_pixel and P0+26+1->Last_pixel.
3) Move to the next pixel in the same direction, if the neighborhood is found to be in the image, go to step 3, otherwise go to step1.
End:
Figure 6 shows the application of fast directional median filtering.
(a)
(b)
[image:4.612.318.534.535.671.2]III. EXPERIMENTAL RESULTS
The data set represents images of a size of 640x480 acquired by a Webcam device. The sample size is NS (number of samples) = 24, and the qualification is based on the accurate determination of the dominant orientation. Figure 7 shows two sets of test images used in our experiments; naturally and manually degraded images. These images are colored, and were converted to gray levels.
The orientation estimation passes through gradient operation and orientation clustering to yield a probability density function (PDF) as shown in Fig 8. It can be noticed that the dominant orientation is shown by a peak around 131.75 degrees corresponding really to the bars orientation of Fig.3(a)
(a) (b)
© (d)
(e) (f)
(g) (h)
Fig. 7. Image samples from test set.
0 20 40 60 80 100 120 140 160 180
0 20 40 60 80 100 120
Orientation (degree)
P
D
F
[image:5.612.273.525.199.711.2]
Fig. 8. PDF plot versus orientation of image in 3(a).
The proposed system is considered as the first stage of a barcode reader system which consists to restore a damaged barcode. The confirmation of effective restoration results is based on the correct barcode recognition.
Once the dominant orientation θd is calculated, all the
blocs that have their orientation less or greater than θd by
one degree; θd-1<=θ<=θd+1, are kept. The fast directional
median filtering is then applied along the dominant orientation (θd). Results of the application of restoration
method to the images of Fig. 7(a-f) are illustrated in Fig. 9. The actual angle of the barcode could be at any orientation belonging to [0, 360] degrees.
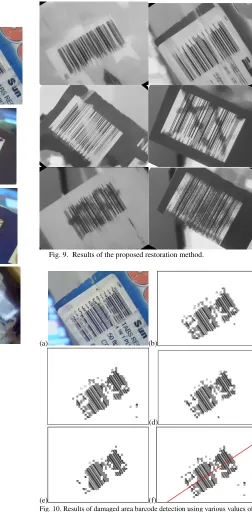
Fig. 9. Results of the proposed restoration method.
(a) (b)
(d)
(e) (f)
Fig. 10. Results of damaged area barcode detection using various values of the parameter δ (a) Original image (b)δ =0.4 (c) δ =0.5 (d) δ=0.6 (e)
[image:5.612.71.306.218.705.2]The success S is incremented by 1 when the barcode is correctly read. Finally the success rate is given by SR=100.(S/NS). Our proposed system can even detect damaged areas within the barcode using a threshold parameter δbarcodes as shown in Fig.10. Results of the proposed method using the images of Fig. 7 are summarized in Table 1. According to table1 at least one barcode reader was able to recognize the degraded barcode image via the restoration method, particularly with image of Fig.7(f) which is extremely degraded. These results show an improvement of 50.0 (62.5-12.5), 75.0 and 62.5 % of recognition rate for the barcode readers; DotImage, Tasman and ImageInfo respectively.
IV. CONCLUSION
We have presented a real time 1D barcode restoration method applied to real images output from Webcam devices. In order to repair distorted barcodes our proposed method and system can detect barcodes in any orientation and within complex scenes, and it can detect also blurred barcodes due to unfocussed Webcam. Experiments were conducted in real time on images out of commercial products, with poor quality and damaged barcodes, in low resolution. We report about experimental results that show an effective achievement of correctly restored barcode based on the recognition of some barcode readers. This result shows the robustness of the proposed method.
REFERENCES
[1] Jain, A. K., Chen, Y. ”Bar code localization using texture analysis”, Proceeding of the Second International Conference on Document Analysis and Recognition, October 1993, pp.41-44.
[2] H. Wakaumi, “A high-density ternary barcode detection system with a fixed period delay method,” Proc. Eurosensor XXIV Procedia Engineering 5, Linz, Austria, September 2010, pp. 252-255. [3] S. Wachenfeld, S. Terlunen, X. Jiang“Robust recognition of 1-D
barcode using camera phones,” Proc. of 19th International Conference on Pattern Recognition (ICPR 2008), 2008, pp. 1-4. [4] K. Wang, Y. Zhou, H. Wang,”1D barcode reading on camera
phones,” International Journal of Image and Graphics, 7(3) pp. 529-550, 2007.
[5] E. Ohbuchi, H. Hanaizumi, A. H. Lim, “Barcode readers using the camera device in mobile phones,” International Conference on Cyberworlds, Tokyo, Japan, 2004, pp. 260-265.
[6] A. Zamberletti, Ignazio Gallo, Moreno Carullo, Elisabetta Binaghi, “Neural Image Restoration for Decoding 1-D Barcodes using Common Camera Phones,” Proceeding of VISAPP 2010, May, 2010,
Angers, France, pp. 17-21.
[7] D. Chai,F. Hock, “Locating and decoding EAN-13 barcodes from images captured by digital cameras,” IEEE International Conference on Information, Communications and Signal Processing, IEEE Proc., Thailand, Bangkok, December 2005, pp 1556-1560. [8] A. Namane, E.H. Soubari and P. Meyrueis, “Real Time 1D Barcode
Detection From Webcam Images Using The Least Square Method,” Proceeding of IEEE Internarional Conference on Cybernetics and Intelligent Systems, London East, London, UK, September 2011. [9] Ruwan Janapriya, Lasantha Kularatne, Kosala Pannipitiya,
Anuruddha Gamakumara and Chathura de Silva,”A Low Cost Barcode Reader using a Web-cam,” Engineering Research Unit (ERU) Symposium, Sri Lanka, 2003.
[10] Sherin M. Youssef, Rana M. Salem, "Automated barcode recognition for smart identification inspection automation", 2007. the international journal of expert systems with applications (eswa), elsevier journal, united kingdom (uk),vol.33, no.4, pp. 968 - 977, july, 17, 2007.
[11] Hong, L., Wan, Y., and Jain, A. K. 'Fingerprint image enhancement: Algorithm and performance evaluation'. IEEE Transactions on Pattern Analysis and Machine Intelligence 20, 8, pp 777-789, 1998. [12] Z. Chen and L. Zhang, “Multi-stage directional median filter,”
International journal of information and communication engineering, pp. 249–252, 2009.
[13] H. Noori and S. Saryazdi, “Image Inpainting Using Directional Median Filters,” Proceeding of the International Conference Computational Intelligence and Communication Networks (CICN), Bhopal, India, 2010, pp. 45-49.
TABLEI
SUMMARY OF RECOGNITION RESULTS OF IMAGES OF FIG.7 Dotimage Tasman ImageInfo
Without With Without With Without With
Restor. Restor. Restor. Restor. Restor. Restor.
Image (a) X X X ok X ok
Image (b) ok ok X X X ok
Image (c)
Image (d)
Image (e)
Image (f)
Image (g)
Image (h)
Recognition rate (%)
X X X
X ok X
X ok X
X X X
X ok X
X ok X
12.5 62.5 0.0
ok X X
ok X X
X X X
ok X ok
ok X ok
ok X ok