Developing a reference model for KPI
and Dashboard reporting in Sales &
Marketing
Author:
Jasper Stoop
Date:
September 2009
Abstract
In the Bachelors thesis we will present a model which can aid in the (semi)
automation of KPI and Dashboard design, from a Sales and Marketing point of
view. After defining the various involved objects and actors, we provide a set of
properties on which different Business Types can be classified. We combine this
with some of the Functional Roles involved in Sales and Marketing to create a
model that can provide importance relationships between KPIs and the
Functional Roles that require these KPIs for their respective Business Information
Management.
We will attempt to verify and fill the model with the results of web surveys held
among various professionals working in Sales and Marketing. With these results
we will show an example of a Business Template, showing the most important
KPIs for a Functional Role with respect to it’s Business Type.
We will discuss the possible relation between the visual representation of KPIs
and the business functions they are monitoring.
Table of contents
Abstract... 2
Table of contents ... 3
1.
Introduction ... 4
1.1
Motivation ... 4
1.2
Objective ... 5
1.3
Research Questions ... 5
1.4
Approach ... 5
1.5
Structure... 6
1.6
Intended Audience... 6
2.
Key Performance Indicators ... 7
2.1
Definitions... 7
2.1.1
Critical Success Factor ... 7
2.1.2
Key Performance Indicator... 7
2.1.3
Metric ... 7
2.1.4
Dashboard ... 8
2.1.5
Reference Model... 8
2.2
Properties ... 9
2.2.1
Measurement Type ... 10
2.2.2
BSC perspective ... 10
2.2.3
Business Type ... 10
2.2.4
Functional Role ... 10
2.2.5
KPI Influence (Leading / Lagging) ... 12
2.2.6
Data Source... 13
2.2.7
Sales & Marketing Relevance ... 13
2.2.8
Measurability... 13
2.3
Initial KPI Listing ... 14
2.3.1
Preliminary Survey Results ... 14
2.3.2
KPI Analysis... 20
3
Survey... 31
3.1
Main web-survey... 31
3.1.1
Main Survey KPI Groups... 31
3.1.2
Main Survey Results ... 35
3.2
Sales and Marketing Dashboard Design... 47
3.2.1
Analysis Results... 47
4
Business Templates ... 49
4.1
Definition ... 49
4.2
Creating Business Templates ... 50
4.2.1
Sales manager Business Template creation ... 50
4.2.2
Sales manager Business Template use ... 60
5
Conclusions... 62
5.1
Research Questions ... 62
5.2
Recommendations... 64
5.3
Evaluation... 66
References... 68
Appendix A
KPI list... 69
Appendix B
Glossary... 75
Appendix C
Preliminary Survey Results ... 77
1. Introduction
1.1 Motivation
Managers and executives need the right information at the right time to be able to
manage their company’s performance and activities. As part of this Business
Performance Management, there needs to be information and data. The
gathering of this data is part of Business Intelligence. When the data is gathered
and processed it needs to be presented, so managers can act on it accordingly.
Dashboards serve as the visual presentation tool of Business Intelligence and
Business Performance Management. A good definition of Dashboards is given by
Steven Few
[1]:
“A dashboard is a visual display of the most important information needed to
achieve one or more objectives, consolidated and arranged on a single screen so
the information can be monitored at a glance.” – S. Few
In the current business practice, mainly mid and high level executives have
access to Dashboards. Due to the current costs and time consuming nature of
Dashboard design, it is not feasible to provide all employees with a Dashboard
that is specifically tailored to their information needs.
Though it can be valuable to enable individual employees to analyze their own
performance, personal performance is only available in a few Dashboard vendor
tools, and mainly serves as a means of monitoring and/or control for higher level
employees.
By creating a model and/or tool that can create (semi) automated Dashboards for
every employee, more information needs can be satisfied and hence improve
business performance overall.
Another, more interesting definition is the one given by Wayne Eckerson
[2]:
“A performance dashboard is a multilayered application built on a business
intelligence and data integration infrastructure that enables organizations to
measure, monitor, and manage business performance more effectively.” – W.
Eckerson
These definitions show the two most important aspects of this thesis: measuring
and monitoring.
Performance must be measured. What exactly needs to be measured is different
for every function within a company, so the question is: which person requires
what information?
Once an executive knows which information is needed to be able to manage the
company’s performance, this information has to be constructed using the
This thesis focuses on creating a reference model to answer these questions,
and showing it’s practical use by creating Business Templates for Scanmar’s
MarketingTracker software suite.
1.2 Objective
The goal of this assignment is to create a reference model for Key Performance
Indicator (KPI) and dashboard reporting. This reference model will then be used
to create Business Templates for MarketingTracker.
These Business Templates are standardized Dashboards used to report
function-specific performance in the Sales & Marketing department. They consist
of one or more KPIs, grouped and classified based on various properties.
1.3 Research Questions
To be able to complete the objective we need to answer the following question:
How can we develop a reference model for KPI and dashboard reporting for
Sales & Marketing?
To answer this question it will be split in several smaller ones:
1. What KPIs are used (most) in Sales & Marketing?
2. How can these KPIs be classified based on which characteristics?
3. (How) can these KPIs be defined mathematically and (how) are they
related?
4. Is there a need for new KPIs or are there KPIs that are not used (much)?
5. What is the relation between KPI, Business Type and Functional Role?
6. Are there differences in data / KPI visualization between Sales and
Marketing and other departments?
1.4 Approach
To answer the (sub-) research questions a combination of both literature study
and questionnaires was chosen.
Sub-research questions one to three can be answered by studying the available
literature. By doing so a clear insight into how KPIs are constructed and used can
be obtained. By examining them further their underlying characteristics can be
evaluated so they can be classified based on different characteristics.
Further analysis is done creating an online web-survey, in which respondents are
asked to rate different KPIs on their importance, with respect to their own
Functional Role and Business Type. Respondents are gathered from Scanmar’s
users as well as by postings several websites for Sales and Marketing
professionals. Examples of these websites include specialized LinkedIn groups
and marketing / sales blogs.
Marketing Dashboards. This analysis will try to see if there are differences in
dashboard design other than the KPIs that are used.
After gaining the required knowledge, the KPI reference model can be
constructed. This reference model will contain the various KPIs and will classify
and group them based on their characteristics. The model will then be used to
create Business Templates for the various functions in Sales & Marketing.
1.5 Structure
The structure of this thesis is roughly based on the approach given in Section
1.4.
In Chapter 2 various KPIs, their underlying characteristics and different
classifications will be described.
In Chapter 3 the results of the web-survey given to professionals will be
discussed. Also, the findings of the current-best-practice analysis in Sales and
Marketing visualization will be presented.
In Chapter 4 the per-function Business Templates will be presented.
In Chapter 5 the conclusions and recommendations of this thesis will be
presented.
Appendix A will give the full list of KPIs found while studying the literature for this
thesis.
In Appendix B some terms, not directly related to KPIs, will be defined and
explained.
Appendix C shows the result of the preliminary survey, used to group KPIs.
1.6 Intended Audience
2. Key Performance Indicators
In this chapter the concept of KPIs is examined. This leads to answers to
sub-research questions one, two and three.
2.1 Definitions
When studying literature one of the first problems encountered is the difference in
definitions of certain terms and elements used in their respective definition. To
counter this problem these definitions need to be redefined. Another advantage
of redefining is that certain terms can be described from a Sales & Marketing
perspective. This means that some terms used in this thesis do not fully match
the generic definitions found in other sources.
This section covers the most important terms used in this thesis. This includes
KPIs and their related concepts as well as most of the different elements that are
used to define some of the KPIs.
2.1.1 Critical Success Factor
[image:8.612.86.520.364.410.2]Critical Success Factors (sometimes referred to as Key Success Factors) are
elements in an organization that determine the current and future success of an
organization’s operation
[17]. If an organization fails to act upon unwanted changes
in its CSFs, it is likely to fail meeting its goals. To evaluate these CSFs, they can
be quantified and measured using Key Performance Indicators.
Figure 1: relations between Metrics, KPIs, CSFs and Business Success
2.1.2 Key Performance Indicator
Although there are a lot of different definitions of what KPIs are, we will define
KPIs in this thesis closely derived from the definition given by Michael Brooks
[3]:
“KPIs are quantifiable and strategic metrics that measure an organization’s
critical success factors.”
Which metrics are KPIs and which are just measurements or result indicators, is
subject of debate among experts; it can sometimes be very hard to differentiate
between them.
When companies create KPIs, they can create them in accordance with a lot of
different standards or even just logic reasoning only. In this thesis however we
will not focus on how to create and define KPIs but rather on categorizing and
classifying existing ones. Since the majority of KPIs used in this thesis are
already being used in practice, we can assume they are valid to use and serve a
valid information need.
How the KPIs will be categorized will be discussed later in this chapter.
2.1.3 Metric
and ‘returns per month’ have the measures dollars and units and the dimensions
week and month respectively. Other dimensions may include the country or store
the sales or returns are measured for, as well as the product or product group.
It is important to distinguish metrics from KPIs. Even though KPIs are metrics, not
all metrics should be classified as KPIs. Metrics are the measurements on which
KPIs are monitored and managed.
2.1.4 Dashboard
As stated before in the introduction, Dashboards are visual display mechanisms
used to present corporate performance data and measure it against certain
targets.
The majority of Dashboards is created in a time consuming and cost ineffective
manor. Vendors of Dashboarding tools provide consultants to analyze user
information needs and deliberate on the KPIs that will be displayed in the
Dashbaord. Even if future users have a clear idea on their information needs and
consultants have experience in creating the right Dashboard for the type of user,
it can take a lot of refining before the right information is displayed in the right
way.
The information that is displayed and in what way depends on the type of
Dashboard. Eckerson
[2]defines three types of Dashboards: operational, tactical
and strategic Dashboards.
Operational Dashboards
are used to display detailed information to front-line
workers and their supervisors. The metrics used in Operational Dashboards
monitor core operational processes and are often updated on an intra-day basis.
Tactical Dashboards
are used by managers and business analysts to display the
performance of projects and plannings rather than processes. The metrics are
updated daily or weekly and are more summarized.
Strategic Dashboards
are used by company leaders to monitor corporate
performance against strategic objectives. Strategic Dashboards are often
implemented using concepts like Balanced Scorecard (BSC) or Six Sigma. The
metrics are often updated weekly or monthly.
2.1.5 Reference Model
Although there is a lot of research on reference modeling, especially with respect
to Business Processes Modeling, exactly defining reference models is very
complicated
[10];; there appears to be no uniform graps of the term ‘reference
model’.
While developing the reference model in this thesis we will consider it defined as
“… an information model used for supporting the construction of other
2.2 Properties
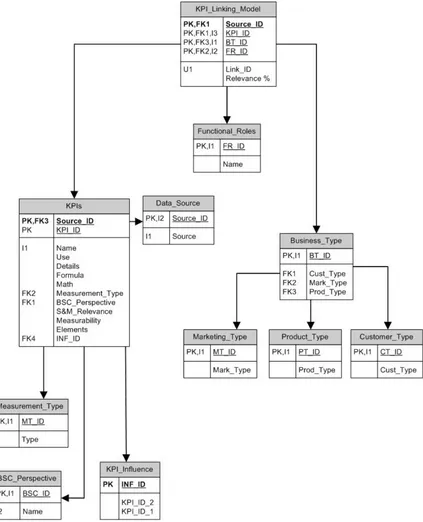
[image:10.612.98.521.166.688.2]In order to create a reference model there need to be properties on which KPIs
and metrics can categorized. This section discusses the different characteristics
that will shape the reference model. Given below is a relational diagram giving an
overview of the KPI reference model created in Microsoft Access and its chosen
properties.
2.2.1 Measurement Type
The measurement type of a KPI relates to the combination of the measure and
dimension from Section 2.1.3. In this thesis we choose to use three types of
measurement: flow (e.g. a 12-month period like Revenue), stock (e.g. the value
of a certain measure, like inventory level at time T) or per-unit (e.g. Marketing
Cost per Unit). If a certain KPI could be classified as both flow and stock, we
choose to classify it as being flow, since most KPIs are more valuable
considering a period then considering one certain moment in time.
2.2.2 BSC perspective
KPIs and metrics are part of the BSC concept, developed by Robert Kaplan and
David Norton
[5], and are often designed used from a certain BSC perspective.
This thesis will classify KPIs and metrics based on the four BSC perspectives:
•
Customer – The customer perspective contains metrics that measure both
the value that is delivered to the customer as well as metrics that measure
the outcome of the customer value proposition.
•
Internal – The metrics from the internal perspective are focused at
measuring the performance of processes aimed at creating and delivering
the customer value proposition; innovation, operations and (post-) sales.
•
Learning and Growth – The learning and growth perspective focuses on
the internal skills and capabilities that are required to support the other
perspectives.
•
Financial – The metrics in the financial perspective can be considered the
‘output’ of the other three perspectives. They measure the outcome of the
operations and strategy of the organization and the contribution to its
financial ‘bottom-line’.
2.2.3 Business Type
We can classify the type of business a company conducts in three different ways;
the type of its customers, the multiplicity of its customers and the type of its
products. This thesis will classify KPIs and metrics based as either:
•
Business-to-Consumer (B2C) or Business-to-Business (B2B)
•
One-to-One (O2O) or One-to-Many (O2M); emphasizing on personal(ized)
contact with customers or mass-media marketing.
•
Service (intangible products) or non-service (tangible products)
2.2.4 Functional Role
Since this thesis proposes a model to relate KPIs to Functional Roles, the most
important property of the KPIs and metrics model in this thesis is the Functional
Role; it is not so much a property of a KPI itself, but rather a property of the
model. The Functional Role is the property on which KPIs and metrics are
grouped into when the Business Templates for MarketingTracker are created. In
this thesis ‘Functional Role means the specific tasks an employee has when
doing a certain job. The different roles are given below.
Marketing Roles
Trade marketer
– Trade marketing is a discipline that focuses on everything
between Sales and Marketing. Any employee concerned with business analysis,
channel development, category development, in-store marketing and trade
communication is in fact working within the trade marketing domain. Rather then
to focus on individual customers, trade marketers focus on the relationship with
retailers and distributors. By trying to determine how much to sell, where to sell it
and with which retail-partner, they try to get a competitive edge in stores rather
then markets.
Marketing manager
– The marketing manager is concerned with managing the
concrete execution of a firm’s marketing activities. As head of the marketing
department they are responsible for “regulating the level, timing, and character of
demand in a way that will help the organization achieve its objectives” ([6], p22).
Marketer
– Although any marketing professional who is concerned with
advertising, public relations, customer demands and similar issues can be
considered a marketer, the term is typically used to represent people who
promote and sell products. Marketers try to discover customer preferences and
needs in order to create marketing and advertisement campaigns.
Product manager
– the product manager is concerned with managing every
aspect of a product, whether the product is a tangible good or an intangible
service. They can be responsible for both outbound marketing activities such as
product placement and product development, as well as internal scheduling and
resource management.
Brand Manager
– The marketing coordinator is concerned with external
communications and relationships. Their focus lies more on the company and
brand as a whole then on individual products. They are concerned with the
creation and guidance of companywide marketing campaigns.
Sales Roles
Sales manager
– Sales managers direct the firm’s sales program. They assign
sales territories, set goals, and establish training programs for the sales
representatives. Sales managers maintain contact with dealers and distributors.
They are responsible for the planning, organization, and performance of the sales
force.
[7]Customer service representative
– Customer service representatives are the
direct connection with the company’s customers. By helping customers with
questions and complaints, they focus on providing service to the customer.
[8]Account manager
– Account managers focus on predefined groups of
customers, which are often businesses. They are responsible for any aspect of
selling products, delivering services and maintaining relations with those
customers.
Sales representative
– Sales representatives are responsible for creating
interest for the company’s products. They can represent a single brand or
product or a line of multiple products. By educating and informing possible leads
they try to convert them into prospects and eventually into customers. Sales
representatives are often also concerned with parts of after-sales.
[9]acquiring new customers. They provide the administrative support for the selling
process to run smoothly.
2.2.5 KPI Influence (Leading / Lagging)
As discussed before in the introduction, Dashboards, and the KPIs presented on
the Dashboards, have both the function of measuring and monitoring. The
leading / lagging property of a KPI tells whether it is used to monitor an ongoing
process or measuring the result of a finished process.
Leading / Lagging can also indicate that an increase or decrease in a certain KPI
leads to the same increase or decrease in a different KPI, some time later.
It is difficult to consistently and unambiguously classify KPIs. When defining a
KPI or metrics as leading or lagging, the question must always be if it’s leading or
lagging in respect to what. Because of this, we choose to remove the leading /
lagging property from the model; instead, a new table was added which lists the
intra-KPI influences or rather which KPI is influenced directly by a certain other
KPI.
We created a Microsoft Access Database in which we list the relationships
between KPIs. Sometimes these relationships are only 1-way: e.g. the Reach of
a certain advertisement influences the Market Demand, but not the other way
around.
In the MS Access table KPI_Influence this is represented by the screenshot
below:
KPI_Influence
IN_ID
KPI_ID_1
KPI_ID_2
KPI_ID_1(optional)
Relation_Type
4
Marketing / Advertising Costs
Gross Profit
Causal
KPI_Influence
IN_ID
KPI_ID_1
KPI_ID_2
KPI_ID_1(optional)
Relation_Type
60
Market Growth
Revenue
Indicator
An important distinction to make here is the Relation_Type. There are three types
of relationships; beside the ‘Causal’ and ‘Indicator’ relationships that are shown in
the example above, there is an ‘Unlcear’ relationship.
The Causal relationship is used to show a direct influence among two KPIs; in
the first example, an increase in Advertising Costs will cause a decrease in Gross
Profit (assuming Gross Profit is calculated using Advertising Costs as a variable
cost).
It is also possible that the relationships are 2-way, which is represented as
follows:
KPI_Influence
IN_ID
KPI_ID_1
KPI_ID_2
KPI_ID_1(optional)
Relation_Type
182
Share of Customer Brand Equity
Share of Customer
Unclear
In the example above Share of Customer influences Brand Equity; if people buy
90% of their groceries at a certain supermarket, it’s Brand Equity is bigger than if
they only bought 10% of their groceries there. On the other hand, a high Brand
Equity can influence Share of Customer as well; if a certain brand is more
popular (where ‘popularity’ is the Brand Equity) it can cause customers to buy
more products of the same brand.
In this example the relation is considered Unclear. Although Brand Equity has an
Indicator relationship to Share of Customer (the relationship goes through Market
Demand), the relationship of Share of Customer to Brand Equity is not clear.
When Brand Equity is measured using Share of Customer it is a Causal
relationship, however, we could argue that Share of Customer has an Indicator
relationship to Brand Equity through Market Share as well.
We initially intended to represent all intra-KPI relationships with a picture, but due
to the size of the table (near 500 relationships) this would not have any value
since the picture would be very inconvenient to read.
In Appendix D all relationships from the KPI_Influence table are listed.
2.2.6 Data Source
The data for the KPIs and metrics have different sources. Whether the data is
about customers, competitors or the company itself depends on the type of KPI /
metric used. In this thesis we will differentiate the attribute ‘data source’ as either
internal (e.g. sales data) or external (e.g. Nielsen, IRI, GfK)
2.2.7 Sales & Marketing Relevance
When determining the usefulness of some of the KPIs and metrics used, we
should take a quick look at its relevance. The KPIs and metrics in this thesis were
rated on a scale from one to three, where three means the KPI / metric was
irrelevant from a Sales & Marketing point of view. All KPIs and metrics who were
rated ‘three’ were removed from the eventual list, so only very and somewhat
relevant KPIs remain.
2.2.8 Measurability
While using KPIs and metrics on Dashboards to monitor and manage processes
and performance, Measurability is not a very major attribute; only if Measurability
of a KPI is considered very costly, designers could consider not using it. If it is
used we can consider it somewhat reliable and feasible to measure.
When designing the Dashboard it is used in, this attribute does become
important. If a KPI or metric is too hard to measure or calculate, the relevance
should be considered against the costs of measuring it.
In this thesis KPIs and metrics were rated on a scale from one to three, where
three meant it is very difficult or expensive to get an accurate result.
2.3 Initial KPI Listing
This section lists the KPIs and metrics that were found while studying the
literature. A complete overview of all these KPIs and metrics with detailed
information can be found in Appendix A. This list serves as a pre-sorting which
will be used when the main survey on role-specific KPI and metric use is
conducted.
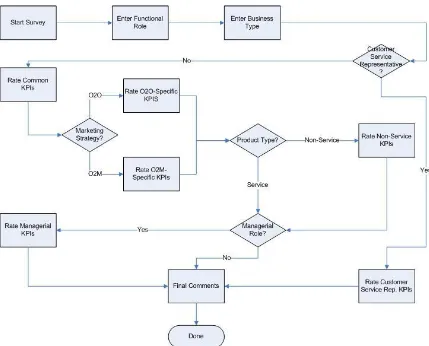
To make this initial listing, an online survey was made. In this survey people were
asked whether they are working in the Sales, Marketing or Trade department of
their organization and they were asked about the Business Type of their
organization, as defined in Section 2.2.3. They were then asked to rate each KPI
on its importance and usage from their respective point of view.
To get responses on this survey, it was posted on several internet sites and
forums used by professionals in the respective departments. Unfortunately the
response was not as plenty as hoped and had a very high low finishing rate. This
was very likely due to the fact that the software, or rather the (only affordable)
license, used for the survey did not allow pre-sorting by making groupings of
KPIs; all respondents were asked to rate all KPIs, including the ones that were
clearly not relevant.
While respondents were asked to rate both the importance and the usage of
each KPI, the results for the usage are discarded in the analysis of the results.
The reason for this is that when reviewing some of the responses, it became
clear that, to some of the respondents, it was unclear what the difference
between importance and usage meant. Although it was expected that importance
and usage would be pretty much the same, there are some respondents who did
not differentiate at all and rated both the importance and the usage the same for
each KPI. This lead to the results being distorted so much that, together with the
low response rate, they could not be of any use.
2.3.1 Preliminary Survey Results
In this section we will list all KPIs with their respective survey findings. The tables
will show the response, broken down by total, department and the three Business
Type properties.
The respondents were distributed as follows:
Sales
Marketing
B2B
B2C
B2B
B2C
O2O
O2M
O2O
O2M
O2O
O2M
O2O
O2M
Service
Non-Service Non-Service
Non-Service Non-Service
Non-Service Non-Service
Non-Service Non-Service
Non-Service Non-Service
Non-Service Non-Service
Non-Service Non-Service
Non-Service
[image:16.612.91.565.80.200.2]4
1
8
3
0
0
1
1
1
1
2
2
0
0
1
3
Table 1: Preliminary Survey respondent distribution
This table clearly shows the main problem of this survey; with only 28
respondents the survey got much less response then intended. One-to-One is
not represented in Business-to-Consumer at all. However, for the purpose of
pre-sorting KPIs, this survey can still be valuable.
The following table lists all KPIs that were rated by the respondents. The KPIs
are sorted by importance, as the percentage of respondents who rated the
KPI
Somewhat +
Very Important
KPI
Somewhat +
Very Important
Revenue
100%
Recognition
73%
Net Profit
100%
Sales Force Salary
73%
Gross Profit
97%
Transaction per Customer
73%
Market Demand
97%
Trial Rate
73%
New Customer Gain
97%
Customer Acquisition Costs
70%
Return on Sales
96%
Faulty Deliveries
70%
Market Growth
94%
Returns to Net Sales
70%
Customer Profitability
94%
Cannibalization
70%
Repeat Rate
93%
Page Views
70%
Net Price
93%
Costs per Call
70%
Market Penetration
93%
Recall
70%
Return on Customer
90%
Target Market Fit
67%
Sales Complaints
87%
Percent Utilization of Discounts
67%
Increased Sales
87%
Product Returns
67%
Customer Loss
86%
Price Premium
67%
Cost per Lead
84%
Average Sales per Call
67%
Marketing Cost per Unit
84%
Program / Non-Program Ratio
66%
Net Sales Contribution
84%
Off Time Deliveries
63%
Price Elasticity
84%
Impressions
63%
Market Share
83%
Cost per Order
63%
Awareness
83%
Numeric Distribution
63%
Customer Lifetime Value
83%
Average Order Turnover
63%
Sales Performance Quota
83%
Net Promoter Score
60%
Average Transaction Size
83%
Cost per Click
60%
Sales Productivity
80%
Adjusted Trial Rate
60%
Close Rate
80%
Category Perform Ratio
60%
Sales Value Variance
80%
Product Category Volume
60%
Market Share Index
80%
Advertising to Sales Ratio
57%
Sales Price Variance
80%
Inventory Turnover
56%
Segment Contribution
80%
Percent Good Value
54%
Baseline Sales
80%
Cost per Impression
54%
Churn Rate
77%
Share of Voice
53%
Product Complaints
77%
Percent Inventory Carrying Costs
53%
Sales Volume Variance
77%
Markdown
50%
Promotion Profit
77%
Reservation Price
50%
Quotation Speed
77%
All Commodity Value
47%
Sales per Employee
77%
Gross Rating Points
47%
Frequency
77%
Facings
47%
Reach
77%
Share of Shelf
46%
Share of Customer
76%
Costs per Gross Rating Point
44%
Value to Volume Ratio
76%
Retailer’s Margin Percentage
43%
Click Through Rate
75%
Markdown Goods Percentage
43%
Brand Equity
74%
Sales Premiums
43%
Complaint Resolval Time
74%
Sales per Square Foot
30%
[image:17.612.87.532.54.704.2]Delivery Complaints
73%
Some of the respondents commented that they were asked to rate KPIs that they
were not using at all. Especially the differences in KPIs between B2B and B2C
were pointed out. Based on these respondent comments we choose to
differentiate between Customer Type rather then any other Business Type or
department.
When the respondents were grouped by their Customer Type, either B2B or B2C,
the results changed. Given below are the twenty five most importantly rated KPIs
for both B2B and B2C, as well as the fifteen least importantly rated KPIs.
Although the low number of respondents makes these results somewhat
ambiguous, there are still some noticeable differences.
KPI – B2B
Somewhat +
Very Important
KPI – B2C(+O2M)
Somewhat +
Very Important
Revenue
100%
Revenue
100%
Net Profit
100%
Market Growth
100%
New Customer Gain
100%
Gross Profit
100%
Gross Profit
96%
Return on Sales
100%
Customer Profitability
96%
Sales Complaints
100%
Market Demand
95%
Market Share
100%
Return on Sales
95%
Market Share Index
100%
Repeat Rate
91%
Product Complaints
100%
Net Price
91%
Delivery Complaints
100%
Market Penetration
91%
Net Profit
100%
Market Growth
91%
Market Demand
100%
Close Rate
87%
Net Price
100%
Return on Customer
87%
Return on Customer
100%
Customer Loss
87%
Increased Sales
100%
Average Transaction Size
87%
Price Elasticity
100%
Sales Complaints
83%
Baseline Sales
100%
Cost per Lead
83%
Promotion Profit
100%
Sales Performance Quota
83%
Value to Volume Ratio
100%
Awareness
83%
Returns to Net Sales
100%
Increased Sales
82%
Cannibalization
100%
Customer Lifetime Value
82%
Percent Utilization of Discounts
100%
Marketing Cost per Unit
79%
Repeat Rate
100%
Sales Productivity
78%
Market Penetration
100%
Market Share
78%
Numeric Distribution
100%
Sales Value Variance
78%
Markdown
100%
Sales Price Variance
78%
Marketing Cost per Unit
100%
Net Sales Contribution
78%
Net Sales Contribution
100%
Segment Contribution
78%
Trial Rate
100%
Price Elasticity
78%
Average Order Turnover
100%
[image:18.612.84.533.215.657.2]Churn Rate
74%
Inventory Turnover
86%
Table 3: The top twenty-five most importantly rated KPIs in B2B and B2C
Due to the low response rate and especially the low number of respondents from
B2C, the results give a somewhat distorted picture.
Customer Gain and Customer Profitability are not among the top rated KPIs in
B2C.
KPI – B2B
Somewhat +
Very Important
KPI – B2C(+O2M)
Somewhat +
Very Important
Sales per Square Foot
17%
Target Market Fit
57%
Markdown Goods Percentage
30%
Close Rate
57%
Retailer’s Margin Percentage
30%
Sales Premiums
58%
Costs per Gross Rating Point
35%
Net Promoter Score
58%
Share of Shelf
35%
Average Sales per Call
58%
Markdown
35%
Costs per Call
58%
Sales Premiums
39%
Sales per Square Foot
71%
Facings
39%
All Commodity Value
71%
Gross Rating Points
39%
Recognition
71%
All Commodity Value
39%
Reservation Price
72%
Reservation Price
43%
Costs per Gross Rating Point
72%
Percent Good Value
43%
Facings
72%
Share of Voice
43%
Gross Rating Points
72%
[image:19.612.83.574.92.325.2]Cost per Impression
46%
Percent Inventory Carrying Costs
72%
Percent Inventory Carrying Costs
47%
Product Category Volume
72%
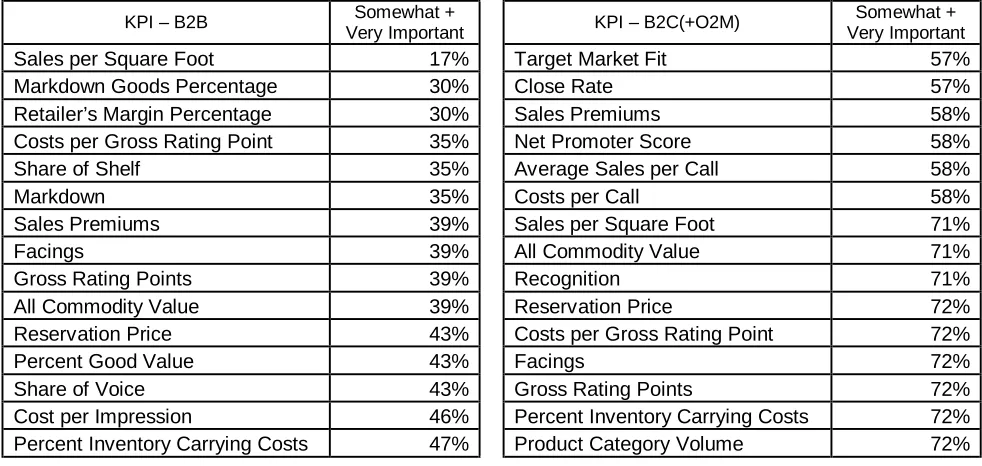
Table 4: The bottom fifteen least importantly rated KPIs in B2B and B2C
The most remarkable thing in these tables is the big difference in
importance-ratings. While the least important KPI to B2B only has a combined importance of
17%, the least important KPI in B2C still has a 57% importance. This is probably
due to the low number of responses, but there might also be a relation to the fact
that all respondents in B2C were solely O2M.
If Table 4 is examined closer there are a few things that stand out. We can see
that Close Rate is the least important KPI to B2C, but to B2B it is in the top fifteen
most important KPIs. Even with the low response rate in mind, it might be valid to
conclude that Close Rate is a genuine B2B KPI.
Sales per Square Foot is very unimportant to B2B. The fairly high importance in
B2C is explained by the fact that all B2C respondents were O2M; Sales per
Square Foot should be considered a pure O2M KPI.
Markdown Goods Percentage is a lot more important in B2C than in B2B. This is
probably explained by the fact that the B2C respondents are from O2M;
Markdown Goods Percentage is more of an O2M KPI than O2O.
These are just a few examples of the results of the preliminary survey. In Section
2.3.2 we will analyze the results on a per-KPI basis.
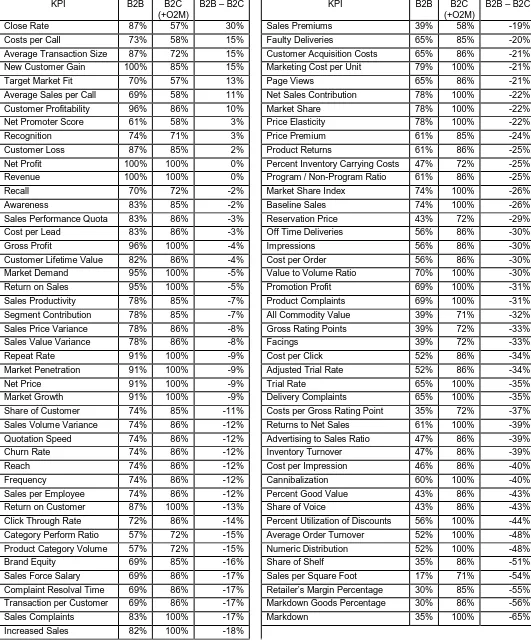
KPI
B2B
B2C
(+O2M)
B2B – B2C
KPI
B2B
B2C
(+O2M)
B2B – B2C
Close Rate
87%
57%
30%
Sales Premiums
39%
58%
-19%
Costs per Call
73%
58%
15%
Faulty Deliveries
65%
85%
-20%
Average Transaction Size
87%
72%
15%
Customer Acquisition Costs
65%
86%
-21%
New Customer Gain
100%
85%
15%
Marketing Cost per Unit
79%
100%
-21%
Target Market Fit
70%
57%
13%
Page Views
65%
86%
-21%
Average Sales per Call
69%
58%
11%
Net Sales Contribution
78%
100%
-22%
Customer Profitability
96%
86%
10%
Market Share
78%
100%
-22%
Net Promoter Score
61%
58%
3%
Price Elasticity
78%
100%
-22%
Recognition
74%
71%
3%
Price Premium
61%
85%
-24%
Customer Loss
87%
85%
2%
Product Returns
61%
86%
-25%
Net Profit
100%
100%
0%
Percent Inventory Carrying Costs
47%
72%
-25%
Revenue
100%
100%
0%
Program / Non-Program Ratio
61%
86%
-25%
Recall
70%
72%
-2%
Market Share Index
74%
100%
-26%
Awareness
83%
85%
-2%
Baseline Sales
74%
100%
-26%
Sales Performance Quota
83%
86%
-3%
Reservation Price
43%
72%
-29%
Cost per Lead
83%
86%
-3%
Off Time Deliveries
56%
86%
-30%
Gross Profit
96%
100%
-4%
Impressions
56%
86%
-30%
Customer Lifetime Value
82%
86%
-4%
Cost per Order
56%
86%
-30%
Market Demand
95%
100%
-5%
Value to Volume Ratio
70%
100%
-30%
Return on Sales
95%
100%
-5%
Promotion Profit
69%
100%
-31%
Sales Productivity
78%
85%
-7%
Product Complaints
69%
100%
-31%
Segment Contribution
78%
85%
-7%
All Commodity Value
39%
71%
-32%
Sales Price Variance
78%
86%
-8%
Gross Rating Points
39%
72%
-33%
Sales Value Variance
78%
86%
-8%
Facings
39%
72%
-33%
Repeat Rate
91%
100%
-9%
Cost per Click
52%
86%
-34%
Market Penetration
91%
100%
-9%
Adjusted Trial Rate
52%
86%
-34%
Net Price
91%
100%
-9%
Trial Rate
65%
100%
-35%
Market Growth
91%
100%
-9%
Delivery Complaints
65%
100%
-35%
Share of Customer
74%
85%
-11%
Costs per Gross Rating Point
35%
72%
-37%
Sales Volume Variance
74%
86%
-12%
Returns to Net Sales
61%
100%
-39%
Quotation Speed
74%
86%
-12%
Advertising to Sales Ratio
47%
86%
-39%
Churn Rate
74%
86%
-12%
Inventory Turnover
47%
86%
-39%
Reach
74%
86%
-12%
Cost per Impression
46%
86%
-40%
Frequency
74%
86%
-12%
Cannibalization
60%
100%
-40%
Sales per Employee
74%
86%
-12%
Percent Good Value
43%
86%
-43%
Return on Customer
87%
100%
-13%
Share of Voice
43%
86%
-43%
Click Through Rate
72%
86%
-14%
Percent Utilization of Discounts
56%
100%
-44%
Category Perform Ratio
57%
72%
-15%
Average Order Turnover
52%
100%
-48%
Product Category Volume
57%
72%
-15%
Numeric Distribution
52%
100%
-48%
Brand Equity
69%
85%
-16%
Share of Shelf
35%
86%
-51%
Sales Force Salary
69%
86%
-17%
Sales per Square Foot
17%
71%
-54%
Complaint Resolval Time
69%
86%
-17%
Retailer’s Margin Percentage
30%
85%
-55%
Transaction per Customer
69%
86%
-17%
Markdown Goods Percentage
30%
86%
-56%
Sales Complaints
83%
100%
-17%
Markdown
35%
100%
-65%
[image:20.612.55.586.66.707.2]Increased Sales
82%
100%
-18%
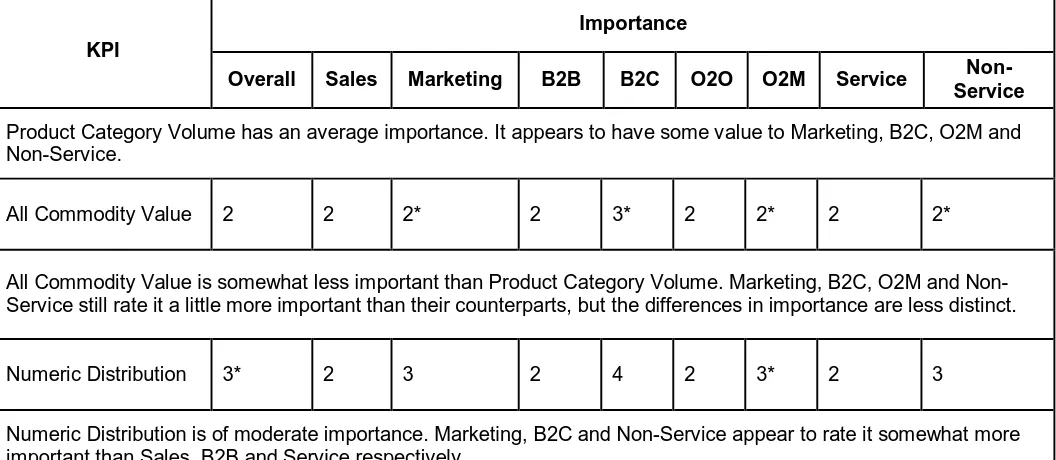
2.3.2 KPI Analysis
Table 6, given in the following pages, shows a more in-depth analysis on how the
respondents rated the different KPIs. Depending on the percentage of
respondents who rated a KPI ‘not important’, ‘somewhat important’ or ‘very
important’ a weighted rating of 1 (not important) through 5 (very important) was
given to the overall importance of the KPI and each of the different Business
Types. This five-point scale was chosen so that ratings in between the three
ratings could be asserted. It could be considered as being the original 1-2-3
rating with 1,5 and 2,5 to it; 1-2-3-4-5 now correspondents to 1-1,5-2-2,5-3. There
are off course still ratings which fall in between one of the five. Those were given
an asterisk (*) to indicate that the rating is a bit ambiguous. The same goes for
ratings with very high variable or multimodal responses; those were given an
asterisk as well.
Importance
KPI
Overall
Sales
Marketing
B2B
B2C
O2O
O2M
Service
Non-Service
Revenue
5
5
5
5
5
5
5
5
5
With Revenue being rated ‘very important’ by over 90% of the respondents we can conclude it is an important KPI for
almost everyone.
Gross Profit
5
5
5
5
5
5
5
5
5
Gross Profit seems to be rated ‘very important’ less within the marketing department then when considering other
Business Types, but since only 9% rated it as ‘not important’ it should still be considered reasonably important.
Value to Volume
Ratio
4
4
3
4
5
4
3
4
4
Value to Volume Ratio seems to be less important to B2B then B2C, as well as being less important to Service
organizations than to Non-Service organizations. Overall it is somewhat above average important.
Net Profit
4
4
5
5
5
4
5
5
5
The importance of Net Profit is less distinct then that of e.g. Revenue, but none of the respondents rated it as being
‘not important’. There are no obvious differences in importance among Business Types either.
Return on Sales
4
4
4
4
5
4
4
4
5
Only 5% of the respondents rated Return on Sales as being ‘not important’. It seems to be a little less important in
B2B compared B2C, in O2O compared to O2M and Service compared to Non-Service.
Return on Customer
4
4
4
4
5
4
4
4
5
Return on Customer appears to be fairly important overall with only 10% rating it ‘not important’. It seems to be a little
less important to B2B compared to B2C and Service compared to Non-Service.
Marketing Cost
Importance
KPI
Overall
Sales
Marketing
B2B
B2C
O2O
O2M
Service
Non-Service
The importance of Marketing Cost per Unit is somewhat ambiguous. Due to the low number of respondents and
especially respondents in B2C, it is difficult to get a clear view on this KPI. It is an average important KPI overall and
it appears to be some more important to Marketing, B2C and Non-Service.
Program /
Non-Program Ratio
3
3
3*
3
4
2
4
2
4
The overall importance of Program / Non-Program Ratio is average. When we look at the departments however, it
seems that Marketing rates this KPI more important then Sales. When Business Types are compared, it appears that
B2C, O2M and Non-Service organizations rate Program / Non-Program a little more important than their
counterparts.
Market Growth
4
4
5
4
5
3
4
4
5
Market Growth is an important KPI with only 7% of the respondents rating it ‘not important’. It appears that Sales
rates this KPI somewhat less important than Marketing and a further analysis showed that differences in importance
within Business Types were related to the respondent’s department. If this relation was just a coincidence, B2C, O2M
and Non-Service rate Market Growth much more important than their counterparts.
Market Share
4
4
4
4
5
3
4
4
5
Market Share is a KPI with above average importance. It appears to be no difference in importance within
departments, but there is a difference within Business Types; B2C, O2M and Non-Service rate this KPI more
important than their counterpart.
Market Share Index
4
4
4
3
5
3
4
3
4
Market Share Index is rated like Market Share with roughly the same differences in Business Type. It’s overall
importance and use is a little lower then Market Share.
Net Sales
Contribution
4
3
4
4
4
4
4
3
4
Net Sales Contribution is a moderate important KPI. It appears to be somewhat more important to Marketing than
Sales and somewhat more important to B2C and Non-Service than B2B and Service respectively. Due to the low
response there is no clear difference between marketing strategies, even though it can be expected that Net Sales
Contribution is more important in O2O than O2M.
Market Demand
4
4
4
4
5
4
4
4
4
Market Demand is an above average important KPI. It appears to be a bit more important in B2C and O2M, but again
due to the low response this is ambiguous. There seems to be no real difference between Sales or Marketing, and
Service or Non-Service
Market Penetration
4
4
4
4
4
4
4
4
4
Market Penetration is a moderate important KPI. It is remarkable to notice that in Marketing and O2M there where
responses who rated the KPI as ‘not important’ while there were no such responses in Sales and O2O respectively.
Due to the nature of the KPI one could expect this to be the opposite.
Importance
KPI
Overall
Sales
Marketing
B2B
B2C
O2O
O2M
Service
Non-Service
Trial rate is a moderate important KPI. It appears to be somewhat more important to Marketing, B2C, O2O and
Non-Service than Sales, B2B, O2M and Non-Service respectively.
Repeat Rate
4
4
5
4
4
4
4
4
4
Repeat Rate is rated considerably important with only 7% of the respondents rating it ‘not important’. There is a clear
difference between Sales and Marketing, with 91% of Marketing-respondents rating it ‘very important’. There are
some differences between Business Types, but due to low response rate, implying any relation would be ambiguous.
Churn Rate
4
4
4
4
4
4*
4
4
4
Churn Rate is rated less important then Repeat Rate, but still moderately important. It is remarkable to see that its
use is less common as well; 10% rated is ‘very important’ while not using it.
Segment Contribution 4
4
3
4
4
3
4
4
4
Segment Contribution is of moderate importance overall. The only clear difference is between B2B and B2C.
Customer Profitability
4
4
4
4
4
4
4
4
4
Customer Profitability is of above average importance. There appears to be a difference between O2O/O2M and
Service/Non-Service; the latter both rate it a little higher.
Share of Customer
4
4
3*
3
4
4
3
3
4
Share of Customer is moderate important KPI. The difference within departments is somewhat visible, with 56% of
Marketing-respondents rating it ‘not important’. Within Business Types there is some indication that B2C, O2O and
Non-Service rate this KPI higher than their counterparts.
Customer Acquisition
Costs
4*
4
3*
3*
4
4
4*
4
2*
Although the overall importance of Customer Acquisition Costs is moderate, the difference between departments is
clear; Sales rates its importance higher then Marketing. The same goes for B2C, O2O and Service respectively.
Cost per Lead
4
4
4
4
4
4
4
4
4*
Cost per Lead is a moderate important KPI. It appears to be more important to Sales than to Marketing. On average
there is no clear indication among Business Types.
Customer Lifetime
Value
4
4
4
4
4
4
4
4
4
Customer Lifetime Value is moderately important overall, but appears to be more important to B2C, O2O and
Service. Sales and Marketing rate it almost equally important.
Importance
KPI
Overall
Sales
Marketing
B2B
B2C
O2O
O2M
Service
Non-Service
New Customer Gain is above average importance with only 5% rating it ‘not important’. There is a clear difference
between departments with 82% of Marketing rating it ‘very important’. The Business Types do not seem influence its
importance.
Customer Loss
4
4
4*
4
4
4
4
5
3
Customer Loss is fairly important with only a 15% ‘not important’ rating. Sales seems to rate it a more important as
well as Service, compared to Marketing and Non-Service respectively. When Customer Loss is compared to the
related KPI Churn Rate, it shows the same rating, but it is more explicit then Churn Rate.
Net Price
4
4
4
4
5
4
4
4
4
Net Price appears to be an above average important KPI. There is a small indication that B2C rates it a little more
important than B2B, but due to the low response this is unreliable.
Share of Voice
2
2
3
2
4
2
2
2
3*
The importance of Share of Voice is below average. It seems to be relevant only in B2C. It is remarkable that 56% of
Marketing rates this KPI ‘not important’. Cross-referencing Marketing and B2C indicated that Share of Voice is more
important there; 25% rated Share of Voice ‘not important’. But again due to the low number of respondents this
cannot be justified.
Advertising to Sales
Ratio
3
2
3*
2
4
2
3
2
3*
Advertising to Sales Ratio is a below average important KPI. It appears to be more important in B2C and
Non-Service, but this is ambiguous.
Reach
3
3
3
3
4
3
4
3
4
Reach is moderately important. Marketing, B2C, O2M and Non-Service rate Reach more important than their
counterparts. Of the 25% respondents who rated it as ‘not important’, the majority worked in B2B which rates Reach
less important. This relation however, is ambiguous due to the low number of response.
Impressions
3
3
3*
3
4
2
3
3
3
Impressions is rated average important. There is an indication that Marketing, B2C and O2M rate this KPI somewhat
higher than their counterparts.
Frequency
3
3
3*
3
4
3
4
3
3
Frequency is rated a bit more important then Impressions. This is the same with respect to the relations with among
Business Types. The difference in importance is a little more distinct.
Gross Rating Points
2
2
2
2
3
2
2
2
2
Gross Rating Points has a below average importance. Only in B2C it appears to have some relevance, especially
when it was cross-referenced to O2M.
Costs per Gross
Importance
KPI
Overall
Sales
Marketing
B2B
B2C
O2O
O2M
Service
Non-Service
The Costs per Gross Rating Point are slightly less important then (the amount of) Gross Rating Points itself. As with
Gross Rating Points, the respondents who did not rate this KPI ‘not important’ were from B2C, O2M organizations.
Sales Premiums
2
2
2
2
2
2
2
2
2
Sales Premiums appears to have a low importance. There seems to be no clear difference within departments or
Business Types.
Baseline Sales
3
3
4
3
4*
3
4
3
4
Baseline Sales is a moderate important KPI. It seems that B2C rates it more important than B2B. The difference is
less clear for Marketing, O2M and Non-Service compared to Sales, O2O and Service respectively.
Increased Sales
4
4
4
4
4*
3
4
3
4
The importance of Increased Sales is very much like that of Baseline Sales, however, besides the overall importance
being higher, the differences in importance among Business Types is more distinct.
Promotion Profit
3*
4
3
3
4
2
4
3
4
Promotion profit is of average importance. There is a good indication that B2C, O2M and Non-Service rate this KPI
more important than their counterparts. There seems to be no clear indication that it is more important to Marketing
than Sales, which is remarkable. Cross-referencing showed that the ‘not important’ ratings in Marketing respondents
were also B2B. This might show a relation, but this would be ambiguous to claim due to the low number of
respondents.
Brand Equity
4
4
4*
4*
4
4
4*
4*
4
Brand Equity is of above average importance. When cross-referencing, it seemed that the respondents in Marketing
who rated Brand Equity ‘not important’, were all in O2M. This could indicate a relationship, but due to the low number
of respondents, no assumptions should be made on any relationship between these organizational properties.
Price Premium
3
3
2*
2
4
2
3
3
3
The importance of Price Premium is slightly below average. There is an indication that B2C rates this KPI much more
important than B2B. Also, Sales and O2M rate Price Premium somewhat more important than their counterparts.
Recall
3
3
3
3
3
3
3
3
3*
Recall appears to be a moderate important KPI. It seems to be only a little more important to Marketing than Sales,
where a remarkable 56% in Marketing rates it ‘not important’. O2M and Service appear to rate it somewhat more
important than O2O and Non-Service respectively.
Recognition
4
3
4
3
4*
3
4
4
3*
Importance
KPI
Overall
Sales
Marketing
B2B
B2C
O2O
O2M
Service
Non-Service
Transaction per
Customer
3
3
3
3
4
3
3
3
3*
Transaction per Customer is of moderately important overall. There is a slight difference in importance between the
departments and Business Types; Marketing, B2C and O2O appear to rate is more important. Within Product Types
the average importance is almost equal, but the variance among responses is much bigger in Non-Service.
Returns to Net Sales
3
3
3
3
4
2
3
3
4
Returns to Net Sales is averagely important, but shows a very inconsistent importance distribution. Cross-referencing
indicated that O2M in combination with B2C rated this KPI “very important’, while its importance to O2M in
combination with B2B was evenly distributed.
Inventory Turnover
3*
3*
3*
2*
4*
2*
3*
2
4*
The importance of Inventory Turnover is average. There is an indication that it is very important in B2C. A remarkable
result is that some respondents in Service rated this KPI ‘very important’; this is somewhat strange, since Service
organizations should care about inventory in theory. Cross-referencing showed that the Service respondents who did,
all came from a O2M organization.
Percent Inventory
Carrying Costs
2
2
2
2
3
3
3
2
3
Percent Inventory Carrying Costs has a below average importance. The use of this KPI is also low, with only 10%
using it very much. It seems to be a little more important to Sales, B2C, O2O and Non-Service. As with Inventory
Turnover, there are respondents from Service who rate this KPI ‘very important’
Sales per Square
Foot
2
2
2*
2
3*
2
2
2
2*
Sales per Square Foot has a low importance. Cross-referencing did show that B2C combined with O2M and
Non-Service rate Sales per Square Foot ‘very important’; this is what could be expected of this KPI.
Sales per Employee
3
3
3
3
4
3
3
4
2*
Sales per Employee is of moderate importance. It seems to be more important to Sales, B2C, O2M and Service.
Average Transaction
Size
4
4
4
4
3
4
3
4
4
Average Transaction size is above average importance. When the responses where cross-referenced it appeared
that B2C combined with O2M and Non-Service rated this KPI more important.
Retailer’s Margin
Percentage
2*
2*
2*
2
4
1
3*
2*
2*
Retailer’s Margin Percentage has a below average importance. It appears to become more important in Sales and
B2C, especially when combined with O2M and Non-Service organizations.
Importance
KPI
Overall
Sales
Marketing
B2B
B2C
O2O
O2M
Service
Non-Service
Markdown has a below average importance. Only in B2C its importance appears to be a higher. This is also true to a
lesser extent for O2M and Non-Service. Within departments the importance is distributed with a very high variance.
Markdown Goods
Percentage
2
2
2*
2
4
2
2*
2*
2
Markdown Goods Percentage has a low importance. The somewhat higher importance in B2C is less visible than it
was for Markdown. Importance to Non-Service is also lower, while O2M now rates Markdown Goods Percentage
clearly more important than O2O.
Percent Utilization of
Discounts
3
3
4
2
4
2
4*
2*
4
The overall importance of Percent Utilization of Discounts is average. There is however an indication that is more
important in B2C combined with O2M and Non-Service organizations. Marketing rates this KPI somewhat higher than
Sales.
Sales Force Salary
3
4
3
3
3
3*
3
3
3
Sales Force Salary is moderately important. There is a small difference in importance between Sales and Marketing,
but no clear difference within Business Types.
Sales Performance
Quota
4
4
4
4
4
4
4
4
4*
Sales Performance Quota is above average importance. There is fairly clear difference in importance between O2O
and O2M.
Average Sales per
Call
3
4
2
3
2
3
3
3
2*
Average Sales per Call is moderately important. Sales rates this more Important than Marketing. B2B and Service
rate Average Sales per Call a little higher than their counterparts.
Close Rate
4
4
3
4
3*
4
4*
4
4*
Close Rate is overall an important KPI. It is a very important Sales KPI, especially in B2B and Service. There is not
much difference in importance between O2O and O2M.
Costs per Call
3
3
3
3
3*
3
3
3
3
Costs per Call is a moderately important KPI. Distinct differences in importance could not be found due to the low
number of response.
Sales Productivity
4
4*
4
4*
4
4
4*
4
4
Importance
KPI
Overall
Sales
Marketing
B2B
B2C
O2O
O2M
Service
Non-Service
Sales Value Variance
4
4
3
4
4
4
4
4
4
Sales Value Variance is somewhat above average of importance. It seems Sales and Service rate this KPI a little
higher than their counterparts.
Sales Price Variance
4
4
3
4
4
4
4*
4
4
Sales Price Variance is of average importance. There seems to be a small difference between Sales and Marketing
and a bigger difference between O2O and O2M.
Sales Volume
Variance
4*
4
3
4*
4
4
4*
4
4*
Sales Volume Variance is overall a little above average importance. The differences between Sales and Marketing
are similar to those in Sales Value Variance, but the difference between Service and Non-Service has almost
disappeared. There is also a new difference between O2O and O2M.
Product Returns
3
3
2*
3
4
4
3
3*
3*
Product Returns has average importance. There are some differences between department and Business Types, but
due to the high variance in responses and the low number of response any relationship would be ambiguous.
Product Complaints
4*
4*
4*
3
5
4*
4
4*
4
Product Complaints is a moderate important KPI. It appears to be very important in B2C; other relationships are not
distinct enough.
Delivery Complaints
4
4
4*
3
5
4
4*
4*
4
Delivery Complaints is a moderate important. Compared to Product Complaints, the high importance to O2O is
remarkable. It also seems that Marketing rates Delivery Complaints somewhat higher compared to Product
Complaints. B2C rates this KPI important as well.
Sales Complaints
4
4
4
4
5
4*
4
4
4
Sales Complaints is moderately important. It is more important to Sales and B2C compared to Marketing and B2B.
Other relationships are less distinct.
Off Time Deliveries
3*
3*
2
3*
4
3*
3*
3*
3*
Off Time Deliveries is moderately important. Relationships are not very clear and would be ambiguous to declare.
Faulty Deliveries
4
4
4*
3*
4
4*
4*
3*
4
Faulty Deliveries had is rated moderate important, but the differences and relationships are very unclear.
Cross-referencing did not clarify the results either.
Importance
KPI
Overall
Sales
Marketing
B2B
B2C
O2O
O2M
Service
Non-Service
Awareness has a slightly above average importance. It appears to be more important to Marketing as well as the
Business Types B2C, O2M and Non-Service.
Price Elasticity
4
3
4
3
4
4
4*
3
4
Price Elasticity is somewhat above average important. Marketing rates it more important than Sales and respondents
in Business Types B2C, O2O and Non-Service rated it higher swell.
Complaint Resolve al
Time
4
4
4*
4*
4
4
3
4
4*
Complaint Resolval Time is an average important KPI. The responses have a high variance, but it is fairly clear that
O2O rates this KPI highly important.
Net Promoter Score
2*
3*
2*
3
2*
4
2
2
3
Net Promoter Score is moderate important. The only distinct difference is between O2O and O2M. Within other
Business Types and departments, there is no clear difference in importance.
Quotation Speed
3*
4
3
3*
4
4
3
3
4
Quotation Speed has a more than average importance. The differences between department and Business Types
are unclear.
Cannibalization