ORIGINAL RESEARCH
High b-Value Diffusion Tensor Imaging of the
Neonatal Brain at 3T
J. Dudink D.J. Larkman O. Kapellou J.P. Boardman J.M. Allsop F.M. Cowan J.V. Hajnal A.D. Edwards M.A. Rutherford S.J. Counsell
BACKGROUND AND PURPOSE: Diffusion-weighted MR imaging studies of the adult brain have shown that contrast between lesions and normal tissue is increased at high b-values. We designed a prospective study to test the hypothesis that diffusion tensor imaging (DTI) obtained at high b-values increases image contrast and lesion conspicuity in the neonatal brain.
MATERIALS AND METHODS:We studied 17 neonates, median (range) age of 10 (2–96) days, who were undergoing MR imaging for clinical indications. DTI was performed on a Philips 3T Intera system with b-values of 350, 700, 1500, and 3000 s/mm2. Image contrast and lesion conspicuity at each b-value were visually assessed. In addition, regions of interest were positioned in the central white matter at the level of the centrum semiovale, frontal and occipital white matter, splenium of the corpus callosum, posterior limb of the internal capsule, and the thalamus. Apparent diffusion coefficient (ADC) and fractional anisotropy (FA) values for these regions were calculated.
RESULTS: Isotropic diffusion image contrast and lesion-to-normal-tissue contrast increased with in-creasing b-value. ADC values decreased with inin-creasing b-value in all regions studied; however, there was no change in FA with increasing b-value.
CONCLUSIONS:Diffusion image contrast increased at high b-values may be useful in identifying lesions in the neonatal brain.
D
iffusion-weighted MR imaging is increasingly being used to investigate neonatal cerebral pathologic lesions. Previ-ous studies have shown that diffusion-weighted imaging (DWI) is able to demonstrate lesions that are not always dis-cernible on conventional MR imaging, and the usefulness of this imaging technique to assess infarction1-3and metabolic disorders4,5in the neonatal brain is established. In addition to the qualitative assessment of injury, diffusion tensor imaging (DTI) provides directionally invariant measurements of mean diffusivity and diffusion anisotropy. These objective measure-ments provide information regarding water molecular mobil-ity, which reflect tissue microstructure and thereby provide insight into mechanisms of brain development and disease processes.Diffusion-weighted MR imaging with b-values of more than 2000 s/mm2has been performed in animal studies,6,7in the adult brain,8-14and in infants.8,15These studies suggest that diffusion contrast characteristics are altered at higher b-values. In addition, adult studies of cerebral infarction13and white matter disease14have shown increased lesion conspicu-ity at higher b-values, and so it is possible that high b-value DTI in neonates may also improve lesion conspicuity.
To our knowledge, the only studies investigating the effects of high b-value diffusion imaging in the neonatal brain were done on infants whose results on conventional MR imaging was considered normal and did not examine the full diffusion tensor.8,15In this prospective study, we tested the hypothesis that diffusion imaging at high b-values enhances contrast be-tween lesions and normal tissue in neonates and thereby in-creases lesion conspicuity. Furthermore, we acquired diffu-sion data in 6 noncollinear directions of sensitization, enabling us to examine the effects of high b-values on diffu-sion anisotropy.
The aims of this study were 1) to assess isotropic DWI contrast and lesion conspicuity at b-values between 350 and 3000s/mm2and 2) to assess whether apparent diffusion coef-ficient (ADC) or fractional anisotropy (FA) in the neonatal brain change with increasing b-value.
Materials and Methods
Subjects
The study group consisted of 17 neonates (8 boys and 9 girls) of gestational ages ranging from 26 to 42 weeks, who underwent MR imaging for clinical indications. The median (range) age of the infants at scanning was 10 (2–96) days (median postmenstrual age at scan-ning, 41 [39 – 45] weeks). One infant was imaged twice. Neonates were sedated for imaging with oral chloral hydrate (20 –50 mg/kg). Pulse oximetry and electrocardiogram were monitored throughout the procedure. Ear protection was used for each infant (Natus Mini-Muffs; Natus Medical, San Carlos, Calif). An experienced neonatolo-gist trained in MR imaging procedures was in attendance throughout the MR examination.
MR Imaging
MR imaging was performed on a 3T Intera system (Philips Medical Systems, Best, the Netherlands) with use of a 6-channel, phased-array head coil. Transverse T2-weighted fast spin-echo and 3D MPRAGE images were acquired before DTI was obtained. The conventional MR Received April 9, 2008; accepted after revision June 9.
From the Imaging Sciences Department (J.D., D.J.L., O.K., J.P.B., J.M.A., F.M.C., J.V.H., A.D.E., M.A.R., S.J.C.), Department of Paediatrics (O.K., J.P.B., F.M.C., A.D.E., M.A.R.), MRC Clinical Sciences Centre, Imperial College London, Hammersmith Campus, London, United Kingdom; Neonatal Intensive Care Unit (J.D.), Sophia Children’s Hospital, Erasmus MC, Rotterdam, the Netherlands; and Hammersmith/St. Mary’s Comprehensive Biomedical Research Centre (J.D., D.J.L., O.K., J.P.B., J.M.A., F.M.C., J.V.H., A.D.E., M.A.R., S.J.C.), London, United Kingdom.
Permission for this study was granted by the Hammersmith Hospitals Research Ethics Committee. Written, informed parental consent was obtained for each infant before scanning.
Please address correspondence to Dr. Serena Counsell, Robert Steiner MR Unit, Imaging Sciences Department, MRC Clinical Sciences Centre, Imperial College London, Hammer-smith Campus, DuCane Road, London W12 0HS, United Kingdom; e-mail: [email protected]
images were assessed by an experienced neonatal neuroradiologist (M.A.R.).
Single-shot echo-planar imaging DTI was acquired in 6 noncol-linear directions with b-values of 0, 350, 700, 1500, and 3000 s/mm2.
The pulse sequence parameters used were as follows: TR, 5000 ms; TE, 100 ms; section thickness, 4 mm; FOV, 220 mm; and matrix, 96⫻96. The number of signals averaged (NSA) was increased with increasing b-value; 2 NSA (b⫽350 s/mm2), 4 NSA (b⫽750 s/mm2), 6 NSA (b⫽
1500 and 3000 s/mm2). The duration of the diffusion gradient pulses
was 36 ms, and the time interval between their leading edges was 49 ms for all b-values. The b-value was increased by increasing the am-plitude of the diffusion gradients (maximum 21 mT/m). In addition, DTI was obtained with use of the same parameters described above on a spherical phantom containing dimethyl sulfoxide (DMSO), which was positioned in the head coil at the isocenter of the magnet before commencing the infant imaging study.
Data Analysis
Phantom Data.Measurements were taken from a circular region of interest measuring 740 mm2. To assess hardware or pulse sequence
errors, ADC and FA values were plotted against b-value.
Infant Data.Image contrast and lesion conspicuity at each b-value were assessed visually by 2 investigators (S.J.C. and M.A.R.) and by calculating the contrast ratio as described by Meyer.13The contrast
ratio between unmyelinated (frontal) white matter and central gray matter (thalamus), between unmyelinated white matter and partially myelinated white matter (central white matter at the level of the cen-trum semiovale), and between partially myelinated, highly anisotro-pic white matter (posterior limb of the internal capsule) and central gray matter was determined with use of equation [1].13The contrast
ratio between lesions and adjacent tissue in infant 4 and infant 17 was also assessed.
1) CR⫽S1⫺S2/S1⫹S2
where CR⫽contrast ratio, S1and S2are the signal intensities of regions on the isotropic diffusion images.
In addition, regions of interest were positioned in the central white matter at the level of the centrum semiovale, frontal white mat-ter at the level of the basal ganglia, occipital white matmat-ter, the sple-nium of the corpus callosum, the posterior limb of the internal cap-sule, and the thalamus on the ADC and FA maps. ADC and FA values were plotted against b-value for each region.
Results
Phantom Data
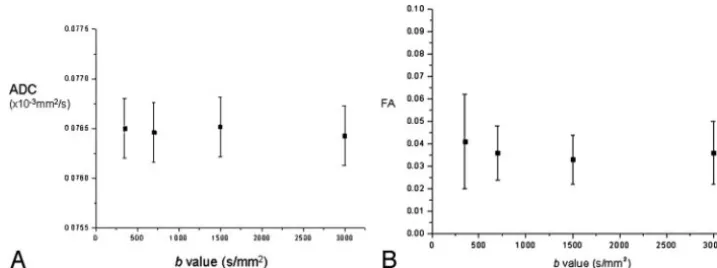
Phantom data showed little change in ADC (Fig 1A) or FA (Fig 1B) over the range of b-values.
Infant Data
Conventional Imaging.Infant 1 (gestational age 41 weeks,
female, scan day 7) had perinatal asphyxia. Conventional im-aging (CI) showed posterior fossa and hemispheric subdural hemorrhage, small foci of abnormal signal intensity in the pos-terior lateral lentiform nucleus. Infant 2 (38 weeks, male, scan day 3) had ventricular dilation noted on antenatal sonogra-phy. CI showed extensive subependymal heterotopias and ab-normal cortical folding, no myelin within the posterior limb of the internal capsule, abnormal signal intensity in the thalamus and lentiform, and a hypoplastic cerebellar vermis. Infant 3 (26 weeks, day 3, female, scan day 96) was assessed at term corrected age. CI showed mild bilateral lateral ventricular di-lation, residual hemorrhage from previous intraventricular hemorrhage evident on the ventricular wall, and myelin ap-propriate for postmenstrual age at scan. Infant 4 (40 weeks, male, scan day 5) had right-sided focal seizures. CI showed a left-sided anterior branch middle cerebral artery infarct and abnormal signal intensity in the left posterior limb of the in-ternal capsule and thalamus. Infant 5 (40 weeks, female, scan day 18) had repetitive jerking episodes. CI showed focal re-gions of short T2 in temporal white matter. Infant 6 (39 weeks, female, scan day 25) was hypotonic at birth and had poor feeding. CI showed foci of abnormal signal intensity in the globus pallidum and thalamus. Myelin was not present in the posterior limb of the internal capsule, and abnormally long T1 and T2 was evident throughout the white matter. Infant 7 (42 weeks, female, scan day 9) had hypotonia, hip contractures, and poor feeding. Diagnosis was Prader-Willi syndrome. CI showed an enlarged anterior extracerebral space, subdural hemorrhage, and abnormal folding of the frontal cortex. In-fant 8 (40 weeks, male, scan day 8) had perinatal asphyxia. Imaging showed no abnormalities. Infant 9 (41 weeks, male, scan day 17) had seizures, hypoglycemia, and hypotonia. Early diagnosis was hyperhomocysteinemia. Later diagnosis was So-tos syndrome. CI showed increased T1 and T2 in the white matter and foci of increased T2 in the basal ganglia and thala-mus. Infant 10 (37 weeks, male, scan day 2) had perinatal asphyxia. CI showed hemorrhage within the right cerebellar
Fig 1.A, Graph demonstrating ADC value versus b-value in a spherical DMSO phantom.B, Graph demonstrating FA value versus b-value in a spherical DMSO phantom.
PEDIATRICS
ORIGINAL
[image:2.594.111.470.42.176.2]hemisphere. The basal ganglia and thalamus appeared normal. Infant 11 (41 weeks, female, scan day 4) had neonatal seizures. CI showed left middle cerebral artery infarct with abnormal signal intensity within the left posterior limb of the internal capsule and thalamus. Infant 12 (38 weeks, female, scan day 3) had cerebellar hypoplasia suspected on antenatal sonography but normal imaging appearances on MR imaging. Infant 13 (37 weeks, female, scan day 16) had seizures and no definite diagnosis with no abnormalities on MR imaging. Infant 14 (41 weeks, male, scan day 5) had perinatal asphyxia. Imaging showed no abnormalities. Infant 15 (29 weeks, female, scan day 75) had prolonged rupture of membranes (6 weeks) and was scanned as part of a research cohort at term-equivalent age. CI showed very high signal intensity within the white mat-ter on T2-weighted imaging and a subependymal cyst. Infant 16 (38 weeks, male, scan day 3) had periventricular cystic le-sions observed on cranial sonography. Diagnosis was methyl-malonic acidemias. CI showed generalized long T1 and long T2 in the white matter, foci of abnormal signal intensity within the cerebellum, and bilateral periventricular cysts anteriorly. Infant 17 (38 weeks, male, scan day 6) had perinatal asphyxia. CI showed bilateral abnormal signal intensity within the basal ganglia and thalami extending into the brain stem. Multiple small “hemorrhagic” foci were observed within the white matter.
Visual Assessment of Isotropic DWIs
Atb⫽350 s/mm2unmyelinated white matter was high signal intensity relative to the central gray matter and the cortex. Highly anisotropic white-matter regions such as the posterior limb of the internal capsule were demonstrated as very slightly hyperintense relative to the thalamus. Atb⫽700 s/mm2, there was little contrast between unmyelinated white matter and the central gray matter. The posterior limb of the internal capsule was seen as very slightly hyperintense relative to the thalamus. Atb⫽1500 s/mm2unmyelinated white matter was low signal intensity relative to the central and cortical gray matter. Highly anisotropic white matter regions were hyperintense relative to both gray matter and unmyelinated white matter. Atb⫽3000 s/mm2unmyelinated white matter was extremely low signal intensity relative to the central and cortical gray matter. Highly anisotropic white-matter fiber bundles were markedly hyper-intense relative to other brain tissues. The cerebellum was demonstrated as very high signal intensity. Figure 2 shows isotropic DWIs at the level of the centrum semiovale and the basal ganglia level for the 4 different b-values in an infant who had no evidence of abnormality on conventional MR or diffu-sion imaging (infant 3).
Visual Assessment of Lesion Conspicuity on Isotropic DWIs and ADC Maps
In the cases of acute infarction, no new lesions were identified on isotropic DWIs obtained at higher b-values compared with those observed at lower b-values. However, the contrast be-tween regions of abnormality and adjacent tissue increased with increasing b-value. Signal intensity change in the cortico-spinal tracts distal to the region of infarction consistent with wallerian degeneration was much more clearly seen on the ADC map obtained from theb⫽3000 s/mm2diffusion data than on those obtained at the lower b-values. High b-value
DTI also clearly showed abnormal signal intensity of the tha-lamic nuclei related to the injured cortex. Figure 3 shows iso-tropic DWIs of a left anterior branch middle cerebral artery infarction with abnormal signal intensity in the posterior limb of the internal capsule (Fig 3A) and wallerian degeneration in the mesencephalon (Fig 3B). Susceptibility artifact in the fron-tal and temporal regions appeared diminished on the high b-value DWIs, and a region of infarction in the left temporal region was more clearly seen on theb⫽3000 andb⫽1500 s/mm2isotropic DWIs compared with those obtained at lower b-values (Fig 3B).
Follow-up images at 1 month of age in infant 11 with a left posterior branch middle cerebral artery infarct demonstrated abnormal high signal intensity within the left posterior limb of the internal capsule on theb⫽3000 s/mm2isotropic diffusion image. This lesion was not observed at lower b-values (Fig 4). In 3 of the 4 infants presenting with hypoxic-ischemic en-cephalopathy (infants 8, 10, and 14), no new lesions were iden-tified on high b-value DTI. However, in infant 17, lesions in the basal ganglia and in the mesencephalon were visualized on the isotropic DWIs obtained atb⫽3000 andb⫽1500, which were not seen on those obtained at lower b-values (Fig 5).
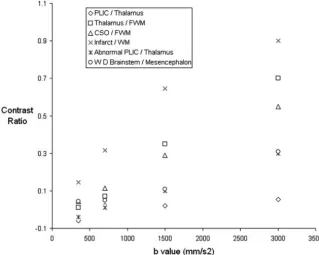
Contrast Ratio on Normal-Appearing Isotropic DWIs
The contrast ratio between unmyelinated (frontal) white mat-ter and central gray matmat-ter (thalamus) and partially myelin-ated white matter (central white matter at the level of the cen-trum semiovale) increased with increasing b-value for those infants who had no focal lesions on conventional MR or dif-fusion imaging. The contrast ratio between the thalamus and the posterior limb of the internal capsule also increased with increasing b-value. Figure 6 shows contrast ratios for the pos-terior limb of the internal capsule versus the thalamus, the thalamus versus the frontal white matter, and the central white
Fig 2.Isotropic DWI at the level of the basal ganglia in an infant (infant 3) who has no
evidence of abnormality on conventional or DWI (i,b⫽3000 s/mm2;ii,b⫽1500 s/mm2;
iii,b⫽700 s/mm2
[image:3.594.301.536.43.286.2]matter of the centrum semiovale the versus the frontal white matter for infant 3.
Contrast Ratio of Lesions to Adjacent Tissue on Isotropic DWIs
Figure 6 shows the contrast ratios obtained for the signal in-tensity of the isotropic DWIs of a left-sided middle cerebral artery territory infarct (infant 4) versus the adjacent white matter, the abnormal posterior limb of the internal capsule versus the adjacent thalamus, and the region of wallerian de-generation in the corticospinal tracts versus the adjacent mes-encephalon tissue. The contrast ratio between the lesion and
the adjacent tissue increased with increasing b-value for all regions of abnormality examined.
ADC and FA Values
ADC values decreased with increasing b-value in all regions studied. In white matter, there was an approximately linear trend in the reduction of ADC with increasing b-value, whereas in the thalamus ADC declined more slowly at higher b-values. There was no consistent change in FA with increas-ing b-value in the neonatal brain. Figure 7 shows change in ADC and FA with b-value for infant 3, who had no evidence of focal pathologic changes on conventional MR or DWI.
Fig 3.A, Isotropic DWIs demonstrating a left middle cerebral infarct in a term born infant (infant 4) and abnormal signal intensity in the left posterior limb of the internal capsule and
left thalamus (arrow) (i,b⫽3000 s/mm2
;ii,b⫽1500 s/mm2
;iii,b⫽700 s/mm2
;iv,b⫽350 s/mm2
).B, Isotropic DWIs demonstrating wallerian degeneration in the corticospinal tracts of the left mesencephalon (arrow). Susceptibility artifact appears reduced on the higher b-value isotropic DWIs, thereby allowing the infarct in the left temporal lobe to be more clearly visualized (arrowhead) (i,b⫽3000 s/mm2
;ii,b⫽1500 s/mm2
;iii,b⫽700 s/mm2
;iv,b⫽350 s/mm2 ).
Fig 4.Isotropic DWIs in a term-born infant with a left-sided middle cerebral artery
infarction (infant 11) at 4 weeks of age demonstrating residual abnormal high signal intensity in the posterior limb of the internal capsule on the left on theb⫽3000 s/mm2 isotropic DWI (arrow), not demonstrated on the images obtained at lower b-values. T2 shinethrough in the region of the infarct is reduced at high b-values (i,b⫽3000 s/mm2;
ii,b⫽1500 s/mm2
;iii,b⫽700 s/mm2
;iv,b⫽350 s/mm2 ).
Fig 5.Isotropic DWI at the level of the basal ganglia in a term-born infant who had a
history of perinatal asphyxia (infant 17). Lesions in the basal ganglia and in the mesen-cephalon are visualized on the isotropic DWIs obtained atb⫽3000 andb⫽1500, which are not seen at lower b-values (i,b⫽3000 s/mm2
;ii,b⫽1500 s/mm2
;iii,b⫽700 s/mm2 ;
[image:4.594.134.453.42.207.2] [image:4.594.279.531.262.514.2] [image:4.594.53.288.264.510.2]Discussion
This study shows that image contrast and lesion conspicuity on isotropic DWIs increase with increasing b-value. Our re-sults show that for b-values between 350 and 3000 s/mm2, FA values are not altered by increasing b-value, but ADC values in the white matter and central gray matter decrease with in-creasing b-value.
The following considerations were taken into account when choosing the range of b-values used in this study: 1) b-values of more than 3000 s/mm2did not show significant improvement in contrast ratios in adults compared with lower b-values,13and signal-to-noise ratio is reduced at high b-val-ues. Although the higher signal-to-noise ratio afforded by im-aging at 3T means that high b-value DTI of the neonatal brain is feasible, even at this field strength, multiple signal intensity averages were required to achieve adequate signal-to-noise
ra-tio. This increases image acquisition time and, hence, suscep-tibility to image degradation from patient motion, which is of particular importance when imaging is performed on neo-nates. Thus, we chose 3000 s/mm2as our maximal b-value. 2) b-values used in clinical neonatal DTI scans are usually lower than those used in adult brain studies because b-values corre-sponding to 1.1/ADC have been thought to provide the best contrast-to-noise ratio;16thus, we included an acquisition at a b-value of 700 s/mm2. 3) We acquired data at the other 2 points, a low but nonzero b-value (350 s/mm2), and an inter-mediate value (1500 s/mm2) to be able to assess the change in ADC and FA over a range of b-values. However, to avoid pro-hibitively long examination times, we investigated only 4 dif-ferent b-values in this study. This prevented us from exploring the possible nonmonoexponential nature of diffusion signal intensity decay in the neonatal brain at high b-values.
Fig 6.Graph demonstrating contrast ratios between adjacent tissues on isotropic DWIs of an infant whose conventional and DWI appear normal (infant 3) and between areas of abnormal
signal intensity and adjacent tissues on isotropic DWIs (infant 4).
[image:5.594.136.455.44.299.2] [image:5.594.134.453.337.512.2]We observed that contrast on isotropic DWIs increases at b-values of more than 700 s/mm2. Similar to adult studies of infarction,13our instances of acute infarction demonstrated that lesion conspicuity was increased at higher b-values. This was particularly striking in showing abnormal signal intensity changes distal to the infarction consistent with early wallerian degeneration in the brain stem and in the posterior limb of the internal capsule. In addition, high b-value DTI made abnor-mal signal intensity in the ipsilateral thalamus more conspic-uous. It has been shown that neonate stroke involving exten-sive parts of cerebral cortex immediately leads to a secondary network injury in the thalamus presenting as increased signal intensity on DWI.17Among our cohort in a neonate with an anterior branch middle cerebral artery infarction, higher b-values revealed more clearly abnormal signal intensity of the thalamic nuclei related to the injured cortex. The relevance of network injury for prognosis is as yet unknown. The use of higher b-values to reveal acute network injury might give more insights.
In acute asphyxia, the diagnostic role of DWI/DTI in the evaluation of deep gray matter injury is still not clear. In some cases, DWI underestimated the extent of lesions or provided no additional information compared with conventional MR imaging, whereas in other cases lesion detection was increased on DWI.18In this study, lesions were observed in the basal ganglia and mesencephalon at higher b-values in 1 infant with hypoxic-ischemic encephalopathy that were not apparent at lower b-values. This finding suggests that the increase in iso-tropic diffusion image contrast with increasing b-value may have an important clinical use to identify lesions in some pathologic processes in the neonatal brain. On review of our images, DTI obtained at a b-value of 1500 s/mm2seemed to be the most useful to identify additional pathologic processes and to provide good tissue contrast while maintaining adequate signal-to-noise ratio. However, care must be taken in inter-preting these images because the increasing contrast-to-noise ratio observed at high b-values may potentially lead to misin-terpretation of normal tissue as pathologic.
Reductions in ADC values with increasing b-values have previously been demonstrated in animal,6,7adult,8,9,11-13and pediatric studies.8,15In the adult brain, the ADC value of my-elinated white matter becomes lower than that of gray matter with increasing b-value.9,10In this study, ADC values in the partially myelinated posterior limb of the internal capsule be-came lower than ADC values in the thalamus at higher b-values. However, ADC values in the other white matter re-gions studied here remained higher than those obtained in the central gray matter at all b-values, reflecting the higher ADC of unmyelinated white matter compared with myelinated white matter.19,20In addition, although the reduction in ADC with increasing b-value was approximately linear in the white mat-ter, the rate of reduction in ADC values in the thalamus de-creased at higher b-values, suggesting that the difference be-tween ADC values in the fast and slow compartments is less in central gray matter than in unmyelinated white matter. The change in measured ADC with different b-values must be taken into account when attempting to compare diffusion data obtained at different imaging centers.
To our knowledge, the change in diffusion anisotropy with
increasing b-value has not been previously investigated in ne-onates, and the results of previous studies in adults are con-flicting. One study observed no change in FA with increasing b-value,9consistent with the findings of our study, and sug-gests that the reduction in ADC is proportional for all eigen-vectors of the diffusion tensor.9However, a more recent DTI study observed that FA of the slow component was signifi-cantly higher than that of the faster component.11This finding concurs with previous estimates of anisotropy (the anisotropy index) in the different compartments.12The reasons for the differing results between these adult brain studies9,11are not clear, as both examined central gray matter and the posterior limb of the internal capsule and used b-values up to 5000 s/mm2. However, it is possible that the differing results are because of the different approaches to calculating FA. Yo-shiura et al9used the same method as that used in our study to calculate FA at each b-value, whereas Maier et al11obtained fits for the fast and slow components of diffusion on a pixel-by-pixel basis by using all measured b-values and then calculated FA separately for the 2 components. Additional DTI studies over an extended range of b-values and with use of the method described by Maier11are required to confirm that FA does not change with increasing b-value in the neonatal brain.
Our results show a wide range of ADC and FA values in different regions in infants with no abnormalities identified on conventional or DWI. These findings are in agreement with previous DTI studies in neonates at low b-values, which have demonstrated greatest anisotropy in the highly organized white matter bundles of the corpus callosum and posterior limb of the internal capsule.19 The lower ADC values and larger FA values in the central white matter of the centrum semiovale compared with the frontal and occipital white mat-ter probably reflect the more advanced maturation of this white matter region because the corticospinal tracts of the pre-central and postpre-central sulcus show evidence of myelination in term neonates, but the occipital white matter does not show evidence of myelination until 3 months and the frontal white matter until around 6 months after birth.21Diffusion anisot-ropy in the thalamus is lower than in the white matter in adults22and neonates,20,23which is consistent with the cyto-architecture of this structure.
Conclusion
Acknowledgments
We are grateful for support from the National Institute for Health Research (NIHR) Hammersmith/St. Mary’s Compre-hensive Biomedical Research Centre, the NIHR postdoctoral award scheme, Philips Medical Systems, the Medical Research Council, the Academy of Medical Sciences, The Health Foun-dation, and the Garfield Weston Foundation. We would also like to thank the staff of the neonatal units at Hammersmith and Queen Charlotte’s Hospitals. We are especially grateful to the parents and the infants who took part in this study.
References
1. Cowan FM, Pennock JM, Hanrahan JD, et al.Early detection of cerebral infarc-tion and hypoxic ischemic encephalopathy in neonates using diffusion weighted magnetic resonance imaging.Neuropediatrics1994;25:172–75 2. Krishnamoorthy KS, Soman TB, Takeoka M, et al.Diffusion-weighted imaging
in neonatal cerebral infarction: clinical utility and follow-up.J Child Neurol
2000;15:592– 602
3. Groenendaal F, Benders MJ, de Vries LS.Pre-wallerian degeneration in the neonatal brain following perinatal cerebral hypoxia-ischemia demonstrated with MRI.Semin Perinatol2006;30:146 –50
4. Mourmans J, Majoie CB, Barth PG, et al.Sequential MR imaging changes in nonketotic hyperglycinemia.AJNR Am J Neuroradiol2006;27:208 –11 5. Parmar H, Sitoh YY, Ho L.Maple syrup urine disease: diffusion-weighted and
diffusion-tensor magnetic resonance imaging findings.J Comput Assist To-mogr2004;28:93–97
6. Niendorf T, Dijkhuizen RM, Norris DG, et al.Biexponential diffusion attenu-ation in various states of brain tissue: implicattenu-ations for diffusion-weighted imaging.Magn Reson Med1996;36:847–57
7. Pfeuffer J, Provencher SW, Gruetter R.Water diffusion in rat brain in vivo as detected at very large b values is multicompartmental.MAGMA1999;8: 98 –108
8. Mulkern RV, Vajapeyam S, Robertson RL, et al.Biexponential apparent diffu-sion coefficient parametrization in adult vs newborn brain.Magn Reson Im-aging2001;19:659 – 68
9. Yoshiura T, Wu O, Zaheer A, et al.Highly diffusion-sensitized MRI of brain: dissociation of gray and white matter.Magn Reson Med2001;45:734 – 40 10. DeLano MC, Cooper TG, Siebert JE, et al.High-b-value diffusion-weighted
MR imaging of adult brain: image contrast and apparent diffusion coefficient map features.AJNR Am J Neuroradiol2000;21:1830 –36
11. Maier SE, Vajapeyam S, Mamata H, et al.Biexponential diffusion tensor anal-ysis of human brain diffusion data.Magn Reson Med2004;51:321–30 12. Clark CA, Le Bihan D.Water diffusion compartmentation and anisotropy at
high b values in the human brain.Magn Reson Med2000;44:852–59 13. Meyer JR, Gutierrez A, Mock B, et al.High-b-value diffusion-weighted MR
imaging of suspected brain infarction.AJNR Am J Neuroradiol 2000;21: 1821–29
14. Assaf Y, Ben Bashat D, Chapman J, et al.High b-value q-space analyzed diffu-sion-weighted MRI: application to multiple sclerosis.Magn Reson Med
2002;47:115–26
15. Jones RA, Palasis S, Grattan-Smith JD.The evolution of the apparent diffusion coefficient in the pediatric brain at low and high diffusion weightings.J Magn Reson Imaging2003;18:665–74
16. Conturo TE, McKinstry RC, Aronovitz JA, et al.Diffusion MRI: precision, accuracy and flow effects.NMR Biomed1995;8:307–32
17. Govaert P, Zingman A, Jung YH, et al.Network injury to pulvinar with neona-tal arterial ischemic stroke.Neuroimage2007;39:1850 –57
18. Roelants-van Rijn AM, Nikkels PG, Groenendaal F, et al.Neonatal diffusion-weighted MR imaging: relation with histopathology or follow-up MR exami-nation.Neuropediatrics2001;32:286 –94
19. Huppi PS, Maier SE, Peled S, et al.Microstructural development of human newborn cerebral white matter assessed in vivo by diffusion tensor magnetic resonance imaging.Pediatr Res1998;44:584 –90
20. Neil JJ, Shiran SI, McKinstry RC, et al.Normal brain in human newborns: apparent diffusion coefficient and diffusion anisotropy measured by using diffusion tensor MR imaging.Radiology1998;209:57– 66
21. Barkovich AJ, Kjos BO, Jackson DE Jr, et al.Normal maturation of the neonatal and infant brain: MR imaging at 1.5 T.Radiology1988;166:173– 80 22. Shimony JS, McKinstry RC, Akbudak E, et al.Quantitative diffusion-tensor
anisotropy brain MR imaging: normative human data and anatomic analysis.
Radiology1999;212:770 – 84