• No results found

profitability for

N/A
N/A
Protected

Academic year: 2020

Share "profitability for"

Copied!
5
0
0

Loading.... (view fulltext now)

Full text

(1)

J. Range Manage.

55:112-116 March 2002

Cull cow management and its implications for cow-calf profitability

RANDALL D. LITTLE, ALLEN R. WILLIAMS, R. CURT LACY, AND CHARLIE S. FORREST

Authors are Associate Professor, Department of Agricultural Economics, Associate Professor, Department of Animal and Dairy Sciences, Graduate Research Assistant and Extension Specialist, Department of Agricultural Economics, Mississippi State University, Mississippi State, Mississippi

39762. Dr. Little is the corresponding author. (662) 325-2884; fax: (662) 325-8777; email: [email protected]

Abstract

Selling culled breeding livestock is often viewed as "just anoth- er chore." Most cull sales are made in the fall, after calves are weaned and cows are pregnancy checked and open. Since cull cow sales comprise from 15 to 30% of a cow-calf enterprise's gross revenue, perhaps they should be viewed as a potential prof- it center.

This paper uses enterprise budgets and sensitivity analyses to illustrate cull cow management strategies that overcome certain physical and economic factors that limit the profitability of fall cow sales. The key limiting physical factor is often poor body condition, which results from the combined effect of lactation and deteriorating forage quality. The key economic factor is a seasonal price low, generated by a large beef supply in the fall.

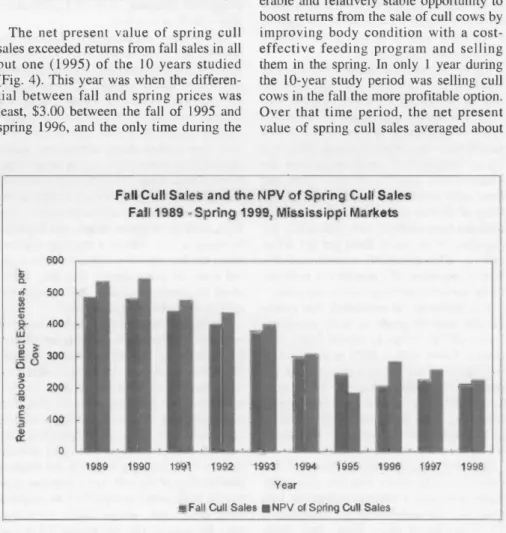
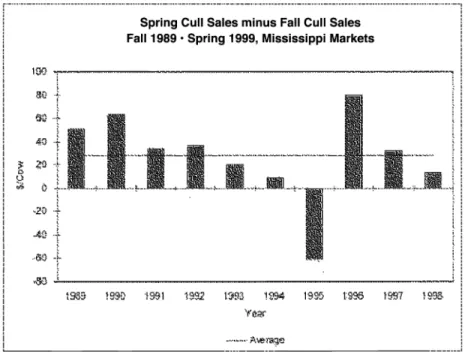
The results suggest potential, with adequate, low-cost feed- stuffs, to increase net returns by properly managing cull breed- ing stock. In only 1 year during the 10-year period, 1990-1999, was selling cull cows in the fall the more profitable option. Over that time period, the net present value of spring cull sales aver- aged about $30 per cow more than selling cull cows in the fall.

Key Words: seasonal price trends, net present value

Selling culled breeding livestock is often viewed as "just anoth- er chore." Most sales are made in the fall, after calves are weaned and cows are pregnancy checked and found to be open. Since cull cow sales comprise from 15 to 30 percent of a cow-calf enter- prise's gross revenue, the culling activity should, perhaps, be viewed and managed as a potential profit center.

The purpose of the research reported in this paper was to deter- mine if cull cow management strategies using cool season forages on improved pastures can overcome certain physical and eco- nomic factors limiting the profitability of fall cull sales. The key physical factor that frequently limits the profit potential of fall sales is poor body condition. Cows typically start the fall season in poor body condition because of the combined effect of the demands of lactation and the deteriorating quality of summer for- ages. The key economic effect is a seasonal price low, generated by large fall supplies (Fuez 1996, Spreen and Simpson 1992).

While the model used reflects a production situation typical throughout much of the Southeastern U.S., the theoretical frame-

Manuscript accepted 30 May 2001.

Resumen

La yenta de ganado para crianza que es de baja produccion (o no productivo), es una actividad que normalmente es considera- da como una "tarea rutinaria mas" en el manejo del ganado. La mayor parte de las ventas de este ganado se Ileva a cabo durante la epoca de Primavera, despues que las crias han sido destetadas y las vacas han sido revisadas y comprobadas que estan libres de prenez. La yenta de gando de baja producion abarca entre un 15

a 30 porciento del ingreso bruto de las operaciones de vaca para cria, por to que esta actividad deberia ser vista como una poten- cial fuente de ganancia.

Esta publicacion hace use de presupuesto de operaciones y analisis de sensibilidad para ilustrar estrategias en el manejo de ganado de baja producion, que ayudan a eliminar o reducir cier- tos factores fisicos y economicos que limitan la alta rentabilidad en las ventas de ganado durante la Primavera. El principal fac- tor fisico limitante, es a menudo una pobre condicion corporal del ganado, to cual es el resultado del efecto combinado de pobre lactacion y la deteriorada calidad del forrage. El principal factor economico es un bajo precio temporal durante la epoca de Primavera, generado por una alta oferta de reses durante la epoca de Otono.

Los resultados del analisis presentado indican un incremento potencial en el retorno neto, dado un manejo apropiado del ganado con una adecuada alimentacion, utilizando material ali- menticio de bajo costo. Solamente en un ano durante el periodo de 10 anos (1990-1999), la opcion de mayor ganacia fue vender el ganado de baja producion durante el Otono. Durante este mismo periodo el Valor Presente Neto (VPN) de las ventas de ganado de baja produccion durante la Primavera tuvo una ganacia prome- dio de $30.00 mas alto por cabeza, comparadas con las ventas en Otono.

work and methods are pertinent to any place quality cool season forages can be produced.

Cull Cow Grades

Cull cows are sold based on USDA slaughter grades, which can be related to body condition scores (BCS) (Table 1). The BCS is a system that uses visual appraisal to determine the degree of fat or muscle loss an animal exhibits. Body condition is scored from

1 to 9, with 9 being the fattest classification. An evaluation of fat

112 JOURNAL OF RANGE MANAGEMENT 55(2) March 2002

(2)

Table 1. Cull cow grades and characteristics.

Grade Dressing Percent Lean Content of Trimmings BCS

Canner 40-46 90-92

Cutter 45-49 88-90

Utility

Boning 50-52

Breaking 52-54 76-82

Commercial 55-60 70-80

Source: Gill (1998).

deposits at various locations of the body condition score of 5-6 and avoid market- (back, tail head, pins, hooks, ribs, and ing in the fall, particularly if cows are in brisket) is made to estimate the potential poor body condition.

carcass cutout quality. An animal with a score of 5 'should look average without being too thin or too fat. Animals with a score of 3 or below will have little or no fat and are scored on the degree of muscle loss.

The USDA Utility and Commercial cows usually command the best prices and have the highest dressing percentage (50 to 60 percent). They typically have body condition scores of 5 or higher. Cows that grade USDA Utility or Commercial usual- ly have enough intramuscular fat (mar- bling) and muscling for primals to be pulled from the carcass (particularly cuts from the rib and loin) and marketed out- side of the ground meat trade. This greatly enhances the value of a carcass, which, in turn, generates premiums paid for the higher quality animals.

Cow Prices - Historical and Trends

Materials and Methods

It may be profitable for producers to take advantage of favorable seasonal price trends and the premiums for animals in better body condition. The analysis report- ed in this paper used a partial budgeting approach in which the cull cow selling activity was treated as an independent livestock enterprise. An enterprise budget for the cull or stocker cow activity was developed (Table 2). Interest is charged on the purchase of the stocker cow over the 6-month period; the other expense items

Monthly Average Prices for Slaughter Cows Mississippi Auctions, 1981-1999

L

{¢ {f i. '

13,. {\5. r3 . 5

`

1

r 5r

Month/Year

Cr

,

Figure 1 illustrates the volatility slaugh-

ter cow prices exhibit over time. For the Fig. 1. Monthly Average Utility Cow Prices in Mississippi, 1981 to 1999.

19-year period shown, average monthly cow prices (in nominal dollars) ranged from a high of $1.26 per kg to a low of about $0.64 per kg. Also evident in Figure

1 is the cyclical nature of cattle prices.

Not only is price variability an impor- tant factor, but seasonal price trends (Boyles, Spreen and Simpson 1992, Torell et al. 1998) and the price differentials between grades of cull cows (Gill 1998) are also critical to effective cull cow man- agement and marketing decisions. On average, the difference in price between USDA Utility and Cutter is about $0.09 per kg (Fig. 2). Figure 2 also shows the seasonal price patterns inherent in slaugh- ter cow prices. Prices normally peak in March and decline steadily through November. Torell et al. (1997) note that

"flesh adds weight and that weight adds value" (p. 955-2). Thus, if possible, it may be advantageous to target marketing of cull cows in the early spring at a body

Average of Monthly Prices for Slaughter Cows Mississippi Auctions, 1990-1999

ft 1.15

C

.Q0

0.95.

0.85 O.3t'

M 75 0.'70 0,65

5 1.5Y.;"r'Y,..5 5.

1

55r..`.y.5,.y..

-,.

Y1y1

'

_ 5

-5L 5''5''

fY

` L.

SL

----..r. 1-,`L

5.

:. y`.

1'

J 'k5

5'

15t"

.111

L

'tll._.'S

5

' '-555-.-

,

f.--f-

i

r

Jan. Feb. Mar Apr May June July Aug Sept Oct Nov Dec Month

.. S-r. biwinq Utilityh:.uttex5 1-2

11.WL W IWW W/V.IYiNN L. L111iV1W-H-.ifJ

Fig. 2. Seasonal Price Patterns for Cull Cows in Mississippi, 1990 to 1999.

l .i

1 1

5 I 5

1 4 i

1 SS

5 5 .

5

i

L55 !

5 : q

1. i

JOURNAL OF RANGE MANAGEMENT 55(2) March 113

(3)

Table 2. Estimated Income and Expenses for Overwintering Cull Cows in Mississippi.

Item Unit Price

INCOME

(dollars) (dollars/cow)

Cull cows (Utility) 80% Kg 1.12 80%)

Cull cows (Cutter) 20% Kg 1.01 20%)

Total Income 537.95

Total Income Per Kg Sold DIRECT EXPENSES

1.10

Canner/Cutter Kg 0.86

Death Loss % 0.01

Pasture Rental (fescue) Ha 49.42

Protein Supplement Kg 0.2425

Hay Kg 0.0782

Salt/minerals Head 4.00

Labor Hrs. 6.50

Veterinary/health mgt. Head 5.00 1

Mach., fuel, oil Head 2.50 1

Marketing Head 10.00 1

Supplies & misc. Head 5.00 1

Interest (for 6 months) Dol. 0.090 Total Direct Expenses

Breakeven Selling Price

457.35

(weighted average, $/Kg) 0.934

Returns above Direct Expenses 80.65

Net Returns per Kg sold 0.16

are assumed to be distributed equally over the period.

The budget presented in Table 2 was based on the assumption that cows will graze fescue from 1 November to 1 May.

Cows were assumed to enter the program at 363 kg (at a body condition score of 4 or less), grading USDA Cutter or Canner.

It is recognized that not all culled cows will grade so poorly, clearly there are other reasons besides poor body condition why some cows are open, but this is a major criterion in the culling decision.

An average daily gain of 0.757 kg over the 180 day feeding period was assumed.

It is estimated that most cows gaining at this rate will grade USDA Utility (body condition score of 5-6) by early spring.

Research has shown that about 80% of animals should reach this desired body condition (Schnell et al. 1997, Rasby et al.

2000); hence it was assumed that 80 per- cent of the cull cows grade Utility and the remainder grade Cutter. Cows that grade Utility were assumed to weigh 499 kg at the time of sale, while the cows grading Cutter were assumed to weigh 454 kg.

Real prices (1999 = 100) were used to eliminate the effect of inflation on prices received, so prices across years would be more directly comparable. The consumer price index was used as the deflator. The average Utility and Cutter prices (in real dollars) received for the sale of cull cows in the spring were $1.12 and $1.01 per kg, respectively. The producer was assumed to pay about $0.86 per kg for Cutter grade cull cows in the fall or to value the ranch-

produced cull herd as an opportunity cost.

To facilitate comparison of fall and spring cull sales within a cow-calf opera- tion, the net present value (NPV) of the returns for sale in the spring was calculat- ed. Net present value is an investment analysis technique that takes into account the time value of money and the timing of cash flows (Robison and Barry 1996).

Returns were discounted for the 180 days assumed in the cull cow enterprise using a 10% annual discount rate. While a discount rate between 6 and 9% is recommended (AAEA Task Force on Commodity Costs.

and Returns 1998), ten percent was used to

build in an additional risk premium for extending ownership of the culled cows. A lower discount rate would slightly increase the present value of the returns from selling cull cows in the spring.

The NPV analysis includes as gross income the returns from selling 80%

Utility grade and 20% Cutter grade cows in April. Average real April prices were used. All estimated expense items from the budget in Table 2 were included except the cost of cow purchase, since this reflects an attempt to portray a cow-calf producer's decision to retain ownership of cull cows, as compared to a stocker cow enterprise.

Instead, an opportunity cost of holding cows was included, based on income fore- gone had the returns from the fall cull sale been invested at 6%. Net returns from the sale of culls in the fall and the correspond- ing NPV of the net returns from the sale of those cows the following spring were cal- culated using price data from the fall of 1989 to the spring of 1999.

Results

Using 10-year average real prices for cows and the estimated expenses of Table 2, the expected returns above direct

expenses were $80.65 per cow. Given the expenses assumed in the cull cow budget, including the 10-year average purchase price for Cutter grade cows in the fall, the break-even selling price for the cows in the spring, weighted for the percentage expected to grade Utility and Cutter, is an estimated $0.934 per kg.

Figure 3 shows the buy-sell margins, in nominal dollars, for the past 10 years. The

April Utility Prices Minus October Cutter Prices Monthly Averages, Mississippi Markets, 1990-1999

0:40 0.35 0.30 0.26 0.20 0,16 0.10 0,06 0,00

90

"

9 91.90 92.91 93-A92 94-°9 95-94 `96.95 W-96 '9 M"97 99-98

Y

Buy/Se In

Fig. 3. Buy/Sell Margins for Cull Cows in Mississippi, 1990 to 1999.

114 JOURNAL OF RANGE MANAGEMENT 55(2) March 2002

(4)

Table 3. Estimated Returns above Specified Expenses (dollars per cow) for Different Purchase and Selling Prices.

PurchasePrice Selling Price ($/Kg)

$0.79 $0.83 $0.88

($/Kg)

$0.79 -43.69 -0.49

$0.75 -26.81 -5.21

$0.74 -9.93 11.67

$0.66 6.95 28.55

$0.62 23.83 45.43

$0.57 40.71 62.31

$0.53 57.59 79.19

Table 4. Estimated Returns above Specified Expenses (dollars per cow) for Different Total Feed Costs (dollars per cow) and Selling Prices.

Total Feed Costs Selling Price ($/Kg)

$0.79 $0.83 $0.88

$60.00 -38.38 -16.78 4.82

$70.00 -48.60 -27.00

$80.00 -58.82 -37.22

$90.00 -69.04 -47.44

$100.00 -79.27 -57.67

$110.00 -89.49 -67.89

margin, which was calculated by subtract- ing the October Cutter cow price from the April Utility cow price of the next year, averaged about $0.20 per kg over the 10- year period, 1990-1999. The range for this margin was from $0.07 to $0.38 per kg.

Although positive, the margins exhibit variability.

Table 3 presents the returns per cow, assuming different purchase and selling prices. Changes in weight gain and body condition are reflected in the price differ- entials of Table 3, as those are key deter- minants of the price received in the spring.

The importance of adequate margins between the fall purchase price and the spring selling price is highlighted in Table 3, as returns above direct expenses per cow do not become positive until the dif- ference between the fall and spring prices exceed $0.08 per kg.

The sensitivity of returns per cow to changes in feed costs is presented in Table 4. Total feed costs, including pasture costs, as reflected in the budget in Table 2, were about $90 per cow. The returns in Table 4 assume the cull cows are pur- chased at the 10-year average price for cutter/canner in the fall. These results illustrate the importance of low-cost feed- stuffs, in addition to the adequate price differentials from fall to spring discussed previously, to a profitable stocker cow enterprise.

The net present value of spring cull sales exceeded returns from fall sales in all but one (1995) of the 10 years studied (Fig. 4). This year was when the differen- tial between fall and spring prices was least, $3.00 between the fall of 1995 and spring 1996, and the only time during the

ID 600£

500

400

300

200

100

0

study period when selling in the fall would have been more profitable. The difference between the NPV of the returns above direct expenses from spring cull sales and the sale of culls in the fall is illustrated in Figure 5. The average difference over the 10-year period was about $30 per cow. As in Table 3, the importance of an adequate price differential between the fall and spring prices to the profitability of holding cows for sale in the spring is highlighted.

Discussion and Conclusions

The objective of this paper was to deter- mine if cull cow management strategies can overcome certain physical and eco- nomic factors limiting the profitability of fall cull sales. The key physical factor is often poor body condition, the combined effect of lactation and deteriorating sum- mer forage quality. The key economic effect is a seasonal price low in the fall, due to the increase in quantity supplied in those months.

The results suggest that there is consid- erable and relatively stable opportunity to boost returns from the sale of cull cows by improving body condition with a cost- effective feeding program and selling them in the spring. In only 1 year during the 10-year study period was selling cull cows in the fall the more profitable option.

Over that time period, the net present value of spring cull sales averaged about

Fall Cull Sales and the NPV of Spring Cull Sales Fall 1989 - Spring 1999, Mississippi Markets

1990 1991 1992

Year

Fall Call Sales NPV of Spring Gull Sales

1997 1998

Fig. 4. Fall Cull Sales and the Net Present Value of Spring Cull Sales, 1989 to 1999.

JOURNAL OF RANGE MANAGEMENT 55(2) March 115

(5)

Spring Cull Sales minus Fall Cull Sales Fall 1989' Spring 1999, Mississippi Markets

should consider how the cull cow enter- prise fits into the whole farm or ranch plan before deciding to feed cull cows through the winter.

Literature Cited

L.JVJ i 9SJ `E91 9a2 V93 194 195 :995

Fig. 5. Difference between the Net Present Value of Spring Cull Sales and Fall Cull Sales, 1989 to 1999.

$30 per cow more than selling cull cows in the fall. Availability of low-cost feed- stuffs, whether cool season forages or some other feed, is critical to the success of a cull cow enterprise.

There are several factors to consider when deciding to hold cull cows over for sale in the spring. Producers should esti- mate the weight and grade of their cull cows or purchased stocker cows. Cows should have the potential to gain 90 to 135 kg on forages and supplement over the winter. Cows must be healthy, open, and have solid mouths to increase the proba- bility of making a profit. Producers should evaluate their markets, and, if possible, put together 40 or more head per lot when selling. This provides a truckload lot, which increases the marketing options, while lowering per head marketing costs.

It is important to remember that reach- ing the desired grade or body condition score (BCS) helps to avoid price dis- counts. Cows with a BCS in excess of 6 will likely be subject to a discount for too much external fat, especially when mar- keted directly to the packing plant.

Likewise, cows that grade USDA Utility and Commercial are typically discounted if they have too much external fat.

Producers should also be aware of dis- counts on carcasses that are too light.

Cows yielding a carcass weighing less than 181 kg will likely be discounted

$0.33 per kg or more. Cows that grade USDA Canner are the most likely to

receive this discount. The best way to avoid such discounts is to not market cows with a BCS of 4 or less.

The research reported here assumed the primary feed source was cool season for- ages on improved pasture, which implies a temperate winter climate. Consequently, the expenses shown in Table 2 reflect a grazing operation. A cull cow manage- ment program, however, can be effective with hay and/or cheap alternative feeds available in some years and at some loca- tions. These could include crop residues, corn gluten feed (wet or dry), broiler litter, whole cottonseed, soybean hulls, rice bran, corn or sorghum silage, and haylage, to name a few. Given a feeding regime, then, the key question centers on the typi- cal seasonal price trends. Are they suffi- cient to generate returns that exceed the cost of overwintering cull cows?

The results suggest potential to increase cow-calf enterprise profitability by proper- ly managing culled breeding stock.

However, there may be barriers that pre- vent successful addition of the cull cow enterprise into the farm or ranch plan. For example, the resource base, including space and time, on a given operation may be inadequate to support cull cows in addi- tion to the remaining herd. Or the relative profitability of the cull cow enterprise may not be sufficiently competitive to displace other enterprises, stocker cattle, for exam- ple, for use of the operation's limited resources. Thus, individual managers

AAEA Task Force on Commodity Costs and Returns. 1998. Commodity Costs and Returns Estimation Handbook. Ames, Iowa:

Amer. Agr. Econ. Assoc.

Boyles, S. Undated. Feeding Cull Cows. Ohio State Univ. Ext.n Serv. http://www2.ag.ohio- state.edu/-beef/library/cull.html (Date of last access: 15 May, 2001)

Gill, R. 1998. Marketing Cull Cows -

Understanding What Determines Value.

http://agnews.tamu.edu/drou

hg

tldrght_

pak98/dr htl l.html (Date of last access: 15 May, 2001)

Fuez, D.M. 1996. Feeding and Marketing Cull Cows. Research Report 96-2. Managing for Today's Cattle Market and Beyond. South Dakota State Univ.

http://ag.arizona.edu/AREC/WEMC/Todavs CattlePub.html (Date of last access: 15 May, 2001)

Rasby, R., R. Selley, and T. Klopfenstein.

2000. Grazing Crop Residue. Nebraska Coop. Ext. EC 98-278-B.

Robison, L.J. and P.J. Barry. 1996. Present Value Models and Investment Analysis.

Northport, Ala: The Academic Page.

Schnell, T.D., K.E. Belk, J.D. Tatum, R.K.

Miller, and G.C. Smith. 1997. Performance, Carcass, and Palatability Traits for Cull Cows Fed High Energy Diets for 0, 14, 28, 42, or 56 Days. J. Anim. Sci. 75:1195-1202.

Spreen, T.H. and J. Simpson. 1992.

Seasonality of Cow Prices. 4P Annual Florida Beef Cattle Short Course Proc.. Dept.

of Ani. Sci., Univ. of Florida, Gainesville, Fla.

http://gnv.ifas.ufl.edu/animal/short92/SPRE EN.HTM (Date of last access: 15 May, 2001)

Torell, R., B. Bruce, and G. Myer. 1997.

What is a Cow Worth? Nevada Cattlemen's Assoc. Spec. Pubi. 97-1:CL955-1.

Torell, R., B. Bruce, B. Kvasnicka, and T.

Ringkob. 1998. Marketing Alternatives of

"B" Maturity Cattle. Univ. of Nevada Coop.

Exten. Fact Sheet 98-17.

116 JOURNAL OF RANGE MANAGEMENT 55(2) March 2002

Figure

Fig.  2.  Seasonal  Price  Patterns for  Cull  Cows in Mississippi, 1990  to 1999.
Table  2.  Estimated  Income and Expenses  for Overwintering Cull  Cows in Mississippi
Table  3.  Estimated Returns  above  Specified Expenses  (dollars  per  cow)  for  Different Purchase  and  Selling Prices
Fig.  5.  Difference  between  the  Net  Present  Value  of Spring  Cull  Sales  and  Fall  Cull  Sales,  1989 to 1999

References

Related documents

Mental Effort Frequent concentration; work pattern unpredictable Concentration for emergency care, responds to emergency situations.

Key words: bile duct proliferation, chlordanes, dichlorodiphenyltrichloroethane, dieldrin, East Greenland, HCB, hexacyclohexanes, Ito cells, lipid granulomas, liver, mononuclear

The dissonance between sight and sound actualised and made visible the gap in time between the lived present of the unreturned soldiers where the Pacific War never ended, and

Taking these considerations into account, the present study was designed based on the following hypotheses (see Figure 1): (1) The autonomy support provided by the teacher

While the printed program emphasized the religious and educational aspects of the assembly, the performance text still had a strong.

c) Regulation 36(3) of the Electricity Regulations 1994 states that for an installation where hand-held equipment, apparatus or appliance is likely to be used, protection

time alpha males consorted a female during her fertile

Trauma  Rehabilita>on  Database   — Microsoft  Access  designed  by  Consultant  in  RM   — Simple  data  input  for  administrative  staff   — Daily