On Improving the Accuracy of Readability Classification
using Insights from Second Language Acquisition
Sowmya Vajjala
Seminar f¨ur Sprachwissenschaft Universit¨at T¨ubingen
Detmar Meurers
Seminar f¨ur Sprachwissenschaft Universit¨at T¨ubingen
Abstract
We investigate the problem of readability as-sessment using a range of lexical and syntac-tic features and study their impact on predict-ing the grade level of texts. As empirical ba-sis, we combined two web-based text sources, Weekly Reader and BBC Bitesize, targeting different age groups, to cover a broad range of school grades. On the conceptual side, we explore the use of lexical and syntactic mea-sures originally designed to measure language development in the production of second lan-guage learners. We show that the develop-mental measures from Second Language Ac-quisition (SLA) research when combined with traditional readability features such as word length and sentence length provide a good indication of text readability across different grades. The resulting classifiers significantly outperform the previous approaches on read-ability classification, reaching a classification accuracy of 93.3%.
1 Introduction
Reading plays an important role in the development of first and second language skills, and it is one of the most important means of obtaining information about any subject, in and outside of school. How-ever, teachers often find it difficult to obtain texts appropriate to the reading level of their students, on a given topic. In many cases, they end up modifying or creating texts, which takes significant time and ef-fort. In addition to such a traditional school setting, finding texts at the appropriate reading level is also
important in a wide range of real-life contexts in-volving people with intellectual disabilities, dyslex-ics, immigrant populations, and second or foreign language learners.
Readability-based text classification, when used as a ranking parameter in a search engine, can help in retrieving texts that suit a particular target reading level for a given query topic. In the context of lan-guage learning, a lanlan-guage aware search engine (Ott and Meurers, 2010) that includes readability classi-fication can facilitate the selection of texts from the web that are appropriate for the students in terms of form and content. This is one of the main motiva-tions underlying our research.
Readability assessment has a long history (DuBay, 2006). Traditionally, only a limited set of surface features such as word length and sentence length were considered to derive a formula for read-ability. More recently, advances in computational linguistics made it possible to automatically extract a wider range of language features from text. This facilitated building machine learning models that es-timate the reading level of a text. On the other hand, there has also been an on-going stream of research on reading and text complexity in other areas such as Second Language Acquisition (SLA) research and psycholinguistics.
In SLA research, a range of measures have been proposed to study the development of complexity in the language produced by learners. These mea-sures are used to evaluate the oral or written pro-duction abilities of language learners. The aim of readability classification, on the other hand, is to re-trieve texts to be comprehended by readers at a
ticular level. Since we want to classify and retrieve texts for learners of different age groups, we hypoth-esized that these SLA-based complexity measures of learner production, when used as features for read-ability classification will improve the performance of the classifiers. In this paper, we show that this approach indeed results in a significant performance improvement compared to previous research.
We used the WeeklyReader website1 as one of the text used in previous research. We combined it with texts crawled from the BBC-Bitesize website2, which provides texts for a different age group. The combined corpus, WeeBit, covers a comparatively larger range of ages than covered before.
To summarize, the contributions of this paper are:
• We adapt measures from second language ac-quisition research to readability classification and show that the overall classification accu-racies of an approach including these features significantly outperforms previous approaches.
• We extend the most widely used WeeklyReader corpus by combining it with another corpus that is graded for a different age-group, thereby cre-ating a larger and more diverse corpus as basis for future research.
The paper is organized as follows: Section 2 de-scribes related work on reading level classification to put our work in context. Section 3 introduces the corpora we used. Section 4 describes the features we considered in detail. Section 5 presents the ap-proach and discusses the results. Section 6 provides a summary and points to future work.
2 Related Work
The traditional readability formulae made use of a limited number of surface features, such as the aver-age sentence length and the averaver-age word length in characters or syllables (Kincaid et al., 1975; Cole-man and Liau, 1975). Some works also made use of lists of “difficult” words, typically based on fre-quency counts, to estimate readability of texts (Dale and Chall, 1948; Chall and Dale, 1995; Stenner,
1http://www.weeklyreader.com
2http://www.bbc.co.uk/bitesize
1996). Dubay (2006) provides a broad survey of tra-ditional approaches to readability assessment. Al-though the features considered appear shallow in terms of linguistic modeling, they have been popular for many years and are widely used.
More recently, the developments in computational linguistics made it possible to consider various lex-ical and syntactic features to automatlex-ically model readability. In some of the early works on statis-tical readability assessment, Si and Callan (2001) and Collins-Thompson and Callan (2004) reported the impact of using unigram language models to es-timate the grade level of a given text. The models were built on a United States text book corpus.
Heilman et al. (2007; 2008b; 2008a) extended this approach and worked towards retrieving rele-vant reading materials for language learners in the REAP3project. They extended the above mentioned
approach to include a set of manually and later au-tomatically extracted grammatical features.
Schwarm and Ostendorf (2005) and Petersen and Ostendorf (2009) report on classification experi-ments with WeeklyReader data, considering statisti-cal language models, traditional formulae, as well as certain basic parse tree features in building an SVM-based statistical model. Feng et al. (2010) and Feng (2010) went beyond lexical and syntactic features and studied the impact of several discourse-based features, comparing their performance on the Week-lyReader corpus.
While the vast majority of approaches have tar-geted English texts, some work on other languages such as German, Portuguese, French and Italian (vor der Br¨uck et al., 2008; Aluisio et al., 2010; Fran-cois and Watrin, 2011; Dell’Orletta et al., 2011) is starting to emerge. Parse-tree-based features have also been used to measure the complexity of spoken Swedish (Roll et al., 2007).
The process of text comprehension and the effect of factors such as the coherence of texts have also been intensively studied (e.g., Crossley et al., 2007a; 2007b; Graesser et al., 2004) and measures to ana-lyze the text under this perspective have been imple-mented in the CohMetrix project.4
The DARPA Machine Reading program created
3http://reap.cs.cmu.edu
a corpus of general text readability containing var-ious forms of human and machine generated texts (Strassel et al., 2010).5 The aim of this program is to
transform natural language texts into a format suit-able for automatic processing by machines and to filter out poorly written documents based on the text
quality. Kate et al. (2010) used this data set to build a coarse grained model of text readability.
While in this paper we focus on comparing com-putational linguistic approaches to readability as-sessment and improving the state of the art on a tra-ditional and available data set, Nelson et al. (2012) compared several research and commercially avail-able text difficulty assessment systems in support of the Common Core Standards’ goal of providing stu-dents with texts at the appropriate level of difficulty throughout their schooling.6
Independent of the research on readability, the complexity of the textsproducedby language learn-ers has been extensively investigated in Second Language Acquisition (SLA) research (Housen and Kuiken, 2009). Recent approaches have automated and compared a number of such complexity mea-sures for learner language, specifically in English as Second Language learner narratives (Lu, 2010; Lu, 2011b). So far, there is hardly any work on using such insights in computational linguistics, though, with the notable exception of Chen and Zechner (2011) using SLA features to evaluate spontaneous non-native speech. Given that graded corpora are also intended to be used by incremental age groups, we started to investigate whether the insights from SLA research can fruitfully be applied to readability classification.
3 Corpora
We used a combined corpus of WeeklyReader and BBC-Bitesize to develop a statistical model that classifies texts into five grade levels, based on the age groups.
WeeklyReader7 is an educational newspaper, with articles targeted at four grade levels (Level 2, Level 3, Level 4, and Senior), corresponding to children
5
The corpus is apparently intended to be available for public use, but does not yet seem to be so; we so far were unsuccessful in obtaining more information from the authors.
6http://www.corestandards.org
7http://www.weeklyreader.com
between ages 7–8, 8–9, 9–10, and 9–12 years. The articles cover a wide range of non-fiction topics, from science to current affairs, written according to the grade level of the readers. The exact criterion of graded writing is not published by the magazine. We obtained permission to use the graded magazine articles and downloaded the archives in 11/2011.8
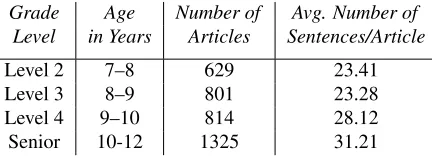
Though we used the same WeeklyReader text base as the previous works, the corpus is not identi-cal since we downloaded our version more recently. Thus the archive contained more articles per level and some preprocessing may differ. The Week-lyReader magazine issues in addition to the actual articles include teacher guides, student quizzes, im-ages and brain teaser games, which we did not in-clude in the corpus. The distribution of articles after this preprocessing is shown in Table 1.
Grade Age Number of Avg. Number of Level in Years Articles Sentences/Article
[image:3.612.317.533.301.380.2]Level 2 7–8 629 23.41 Level 3 8–9 801 23.28 Level 4 9–10 814 28.12 Senior 10-12 1325 31.21
Table 1: TheWeekly Readercorpus
BBC-Bitesize9 is a website with articles classi-fied into four grade levels (KS1, KS2, KS3 and GCSE), corresponding to children between ages 5– 7, 8–11, 11–14 and 14–16 years. The Bitesize cor-pus is freely available on the web, and we crawled it in 2009. Most of the articles at KS1 consisted of im-ages and flash files and other audio-visual material, with little text. Hence, we did not include KS1 in our corpus. We also excluded pages that contained only images, audio, or video files without text.
To cover a broad range of non-overlapping age groups, we used Level 2, Level 3 and Level 4 from WeeklyReader and KS3 and GCSE from Bitesize data respectively and built a combined corpus cover-ing learners aged 7 to 16 years. Note that while KS2 covers the age group of 8–11 years, Levels 2, 3, and
8
A license to use the texts on the website for research can be obtained for a small fee [email protected]. To support comparable research, we will share the exact corpus we used with other researchers who have obtained a license to use the WeeklyReader materials.
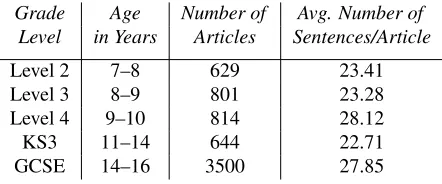
4 together cover ages 7–10 years. Similarly, the Se-nior Level overlaps with Level 4 and KS3. Hence, we excluded KS2 and Senior from the combined corpus. We will refer to the combined five-level cor-pus we created in this way asWeeBit. The distribu-tion of articles in the combinedWeeBitcorpus after preprocessing and removing the overlapping grade levels, is shown in Table 2.
Grade Age Number of Avg. Number of Level in Years Articles Sentences/Article
Level 2 7–8 629 23.41 Level 3 8–9 801 23.28 Level 4 9–10 814 28.12
KS3 11–14 644 22.71
[image:4.612.73.294.173.265.2]GCSE 14–16 3500 27.85
Table 2: TheWeeBitcorpus
To avoid a classification bias towards a class with more training examples during, for each level in the
WeeBitcorpus, 500 documents were taken as train-ing set and 125 documents were taken as test set. In total, we trained on a set of 2500 documents and used a test set of 625 documents, spanning across five grade levels.
4 Features
To build our classification models, we combined features used in previous research with other parse tree features as well as lexical richness and syntactic complexity features from SLA research. We group the features into three broad categories: lexical, syn-tactic and traditional features.
4.1 Lexical Features
Word n-grams have been frequently used as lexical features in the previous research (Collins-Thompson and Callan, 2004; Schwarm and Ostendorf, 2005).10 POS n-grams as well as POS-tag ratio features have also been used in some of the later works (Feng et al., 2010; Petersen and Ostendorf, 2009).
In the SLA context, independent of the readability research, Lu (2011a) studied the relationship of lexi-cal richnessto the quality of English as Second Lan-guage (ESL) learners’ oral narratives and analyzed
10In the readability literature, n-grams are traditionally
dis-cussed as lexical features. N-grams beyond unigrams naturally also encode aspects of syntax.
the distribution of three dimensions of lexical rich-ness (lexical density, sophistication and variation) in them using various metrics proposed in the language acquisition literature. Those measures were used to analyze a large scale corpus of Chinese learners of English. We adapted some of the metrics from this research as our lexical features:
Type-Token Ratio (TTR) is the ratio of number of word types (T) to total number word tokens in a text (N). It has been widely used as a measure of lexical diversity or lexical variation in language acquisition studies. However, since it is depen-dent on the text size, various alternative transfor-mations of TTR came into existence. We consid-ered Root TTR (T/√N), Corrected TTR (T/√2N), Bilogarithmic TTR (Log T/Log N) and Uber Index (Log2T /Log(N/T)).
Another recent TTR variant we considered, which is not a part of Lu (2011a), is the Measure of Textual Lexical Diversity (MTLD; McCarthy and Jarvis, 2010). It is a TTR-based approach that is not af-fected by text length. It is evaluated sequentially, as the mean length of string sequences that maintain a default Type-Token Ratio value. That is, the TTR is calculated at each word. When the default TTR value is reached, the MTLD count increases by one and TTR evaluations are again reset. McCarthy and Jarvis (2010) considered the default TTR as 0.72 and we continued with the same default.
Considering nouns, adjectives, non-modal and non-auxiliary verbs and adverbs as lexical items, Lu (2011a) studied various syntactic category based word ratio measures. Lexical variation is defined as the ratio of the number of lexical types to lexi-cal tokens. Other variants of lexilexi-cal variation stud-ied in Lu (2011a) included noun, adjective, modi-fier, adverb and verb variations, which represent the proportion of the words of the respective categories compared to all lexical words in the document. Al-ternative measures of verb variation, namely Verb Variation-1 (Tverb/Nverb), Squared Verb
Variation-1 (Tverb2 /Nverb) and Corrected Verb Variation-1
(Tverb/ √
2Nverb) are also studied in the literature.
In addition to these measures from the SLA lit-erature, in our lexical features we included the aver-age number of syllables per word (NumSyll) and the average number of characters per word (NumChar), which are used as word-level indicators of text com-plexity in various traditional formulae (Kincaid et al., 1975; Coleman and Liau, 1975).
Finally, we included the proportion of words in the text which are found on theAcademic Word List
as another lexical feature. It refers to the word list created by Coxhead (2000), which contains a list of most frequent words found in the academic texts.11 The list does not include the most frequent words in the English language as such. The words in this list are specific to academic contexts. It was intended to be used both by teachers and students as a measure of vocabulary acquisition. We use it as an additional lexical feature in our work – and it turned out to be one of the most predictive features.
All the lexical features we considered in this work are listed in Table 3. The SLA based lexical features are referred to as SLALEX in the table. Of these, Lexical Features from SLA research (SLALEX) – Lexical Density (LD)
– Type-Token Ratio (TTR) –Corrected TTR (CTTR)
–Root TTR (RTTR)
– Bilogarithmic TTR (LogTTR) – Uber Index (Uber)
– Lexical Word Variation (LV) – Verb Variation-1 (VV1) –Squared VV1 (SVV1)
–Corrected VV1 (CVV1)
– Verb Variation 2 (VV2) – Noun Variation (NV) – Adjective Variation (AdjV) –Adverb Variation (AdvV)
–Modifier Variation (ModV)
– Mean Textual Lexical Density (MTLD)
Other Lexical Features
– Proportion of words in AWL (AWL)
– Avg. Num. Characters per word (NumChar) – Avg. Num. Syllables per word (NumSyll)
Table 3: Lexical Features (LEXFEATURES)
11http://en.wikipedia.org/wiki/Academic_Word_List
six featuresCTTR, RTTR, SVV1, CVV1, AdvV, ModV
were shown by Lu (2011b) to correlate best with the learner data. We will refer to them as BESTLEX -SLA, highlighted in italics in the table.
4.2 Syntactic Features
Schwarm and Ostendorf (2005) implemented four parse tree features (average parse tree height, aver-age number of SBARs, NPs per sentence and VPs per sentence) in their work. Feng (2010) considered more syntactic features, adding the average lengths of phrases (NP, VP and PP) per sentence in words and characters, and the total number of respective phrases in the document. In our work, we started with reconsidering the above mentioned syntactic features.
In addition, we included measures of syntactic complexity from the SLA literature. Lu (2010) se-lected 14 measures from a large set of measures used to monitor the syntactic development in language learners. He then used these measures in the analysis of syntactic complexity in second language writing and showed that some of them correlate well with the syntactic development of adult Chinese learners of English. They are grouped into five broad cate-gories:
The first set consists of three measures of syn-tactic complexity based on the length of a unit at the sentential, clausal and T-unit level respectively. The definitions for sentence, clause and T-unit were adapted from the SLA literature. While asentence
is considered to be a group of words delimited with punctuation mark, aclause is any structure with a subject and a finite verb. Finally, a T-unit is char-acterized as one main clause plus any subordinate clause or non-clausal structure that is attached to or embedded in it.
The second type of measure targets sentence com-plexity. Clauses per sentence is considered as a sen-tence complexity measure.
The third set of measures reflect the amount of subordination in the sentence. They include clauses per T-unit, complex T-units per T-unit, dependent clauses per clause and dependent clauses per T-unit. A complex T-unit is considered as any T-unit that contains a dependent clause.
co-ordinate phrases per clause and co-co-ordinate phases per T-unit. Any adjective, verb, adverb or noun phrase that dominates a co-ordinating conjunction is considered a co-ordinate phrase.
The fifth type of measures represented the rela-tionship between specific syntactic structures and larger production units. They include complex nom-inals per clause, complex nomnom-inals per T-unit and verb phrases per T-unit. Complex nominals are com-prised of a) nouns plus adjective, possessive, prepo-sitional phrase, relative clause, participle or appos-itive, b) nominal clauses, c) gerunds and infinitives in subject positions.
We implemented these 14 syntactic measures as features in building our classification models, in ad-dition to existing features. Eight of these features
(MLC, MLT, CP/C, CP/T, CN/C, CN/T, MLS, VP/T)
were argued to correlate best with language develop-ment. We refer to this subset of eight as BESTSYN -SLA, shown in italics in Table 4. We will see in sec-tion 5 that a set including those features also holds good predictive power for classifying graded texts.
We also included the number of dependent clauses, complex T-units, and co-ordinate phrases per sentence as additional syntactic features. Table 4 summarizes the syntactic features used in this paper.
4.3 “Traditional” Features
The average number of characters per word (Num-Char), the average number of syllables per word (NumSyll), and the average sentence length in words (MLS) have been used to derive formulae for read-ability in the past. We refer to them asTraditional Featuresbelow. We included MLS in the syntactic features and NumChar, and NumSyll in the Lexi-cal features. We also included two popular readabil-ity formulae, Flesch-Kincaid score (Kincaid et al., 1975) and Coleman-Liau readability formula (Cole-man and Liau, 1975), as additional features. The latter will be referred asColeman below, and both formulas together asTraditional Formulae.
5 Experiments and Evaluation
We used the Berkeley Parser (Petrov and Klein, 2007) with the standard model they provide for building syntactic parse trees and defined the pat-terns for extracting various syntactic features from
Syntactic features from SLA research (SLASYN) –Mean length of clause (MLC)
–Mean length of a sentence (MLS)
–Mean length of T-unit (MLT)
– Num. of Clauses per Sentence (C/S) – Num. of T-Units per sentence (T/S)
– Num. of Clauses per T-unit (C/T)
– Num. of Complex-T-Units per T-unit (CT/T) – Dependent Clause to Clause Ratio (DC/C) – Dependent Clause to T-unit Ratio (DC/T) –Co-ordinate Phrases per Clause (CP/C)
–Co-ordinate Phrases per T-unit (CP/T)
–Complex Nominals per Clause (CN/C)
–Complex Nominals per T-unit (CN/T)
–Verb phrases per T-unit (VP/T)
Other Syntactic features
– Num. NPs per sentence (NumNP) – Num. VPs per sentence (NumVP) – Num. PPs per sentence (NumPP)) – Avg. length of a NP (NPSize) – Avg. length of a VP (VPSize) – Avg. length of a PP (PPSize)
– Num. Dependent Clauses per sentence (NumDC) – Num. Complex-T units per sentence (NumCT) – Num. Co-ordinate Phrases per sentence (CoOrd) – Num. SBARs per sentence (NumSBAR)
– Avg. Parse Tree Height (TreeHeight)
Table 4: Syntactic features (SYNFEATURES)
the trees using the Tregex pattern matcher (Levy and Andrew, 2006). More details about the patterns from the SLA literature and their definitions can be found in Lu (2010). We used the OpenNLP12 tagger to get POS tag information and calculate Lexical Rich-ness features. We used the WEKA (Hall et al., 2009) toolkit for our classification experiments. We ex-plored different classification algorithms such as De-cision Trees, Support Vector Machines, and Logis-tic Regression. The Multi-Layer Perceptron (MLP)-classifier performed best with various combinations of features, so we focus on reporting the results for that algorithm.
Feature set # Features Classifier Performance
Accuracy RMSE
Traditional Formulae 2 38.8% 0.36
Traditional Features 3 70.3% 0.25
Trad. Features + Trad. formulae 5 72.3% 0.32
SLALEX 16 68.1% 0.29
SLASYN 14 71.2% 0.28
SLALEX+SLASYN 30 82.3% 0.23
BEST10SYN 10 69.9% 0.28
All Syntactic Features 25 75.3% 0.27
BEST10LEX 10 82.4% 0.22
All Lexical Features 19 86.7% 0.20
BEST10ALL 10 89.7% 0.18
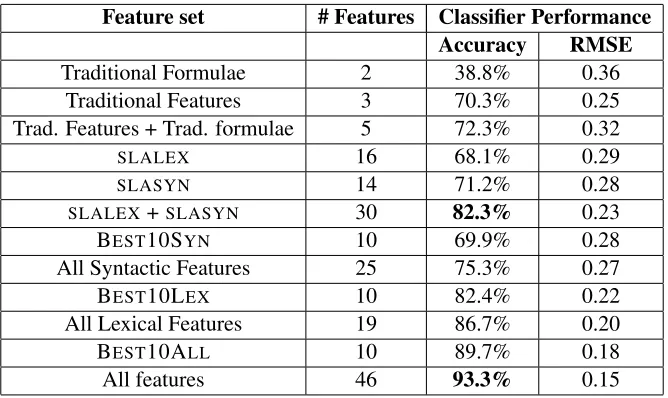
[image:7.612.140.474.53.252.2]All features 46 93.3% 0.15
Table 5: Classification results for WeeBit Corpus
5.1 Evaluation Metrics
We report our results in terms of classification accu-racy and root mean square error.
Classification accuracyrefers to the percentage of instances in the test set that are classified correctly. The correct classifications include both true posi-tives and true negaposi-tives. However, accuracy does not reflect how close the prediction is to the actual value. A difference between expected and predicted values of one grade level is treated the same way as the difference of, e.g., four grade levels.
Root mean square error (RMSE) is a measure which gives a better picture of this difference. RMSE is the square root of empirical mean of the squared prediction errors. It is frequently used as a measure to estimate the deviation of an observed value from the expected value. In readability assess-ment, it can be understood as the average difference between the predicted grade level and the expected grade level.
5.2 Feature Combinations
Complementing our experiments comparing the dif-ferent lexical and syntactic features and their com-bination, we also used WEKA’s information-gain-based feature selection algorithm, and selected the Top-10 best features using the ranker method.
When all features were considered, the top 10 most predictive features were found to be: ( Num-Char, NumSyll, MLS, AWL, ModVar, CoOrd,
Cole-man, DC/C, CN/C,and AdvVar), which are referred to as BEST10ALLin the table.
Considering the 25 syntactic features alone, the 10 most predictive features were: (MLS, CoOrd, DC/C, CN/C, CP/C, NumPP, VPSize, C/T, CN/T and NumVP), referred to as BEST10SYNin the table.
The 10 most predictive features amongst all the lexical features were: (NumChar, NumSyll, AWL, ModV, AdvV, AdjV, LV, VV1, NV and SVV1). They are referred to as BEST10LEXin the table.
Although the traditionally used features ( Num-Char, NumSyll, MLS) seem to be the most predictive, it can be seen from the other top ranked features, that there is significant overlap between the best fea-tures identified by WEKA and the feafea-tures which Lu (2010; 2011b) identified as correlating best with language development (shown in italics in Table 3 and Table 4), which supports our hypothesis that the SLA-based measures are useful features for read-ability classification of non-learner text too.
5.3 Results
# Features Highest reported accuracy Previous work (on WeeklyReader)
(Feng et al., 2010) 122 74.01%
(Petersen and Ostendorf, 2009) 25 63.18%
Syntactic features only (Petersen and Ostendorf, 2009) 4 50.91%
Our Results (on WeeklyReader alone)
Syntactic features from (Petersen and Ostendorf, 2009) 4 50.68%
All our Syntactic Features 25 64.3%
All our Lexical Features 19 84.1%
All our Features 46 91.3%
Our Results (on WeeBit)
All our Syntactic Features 25 75.3%
All our Lexical Features 19 86.7%
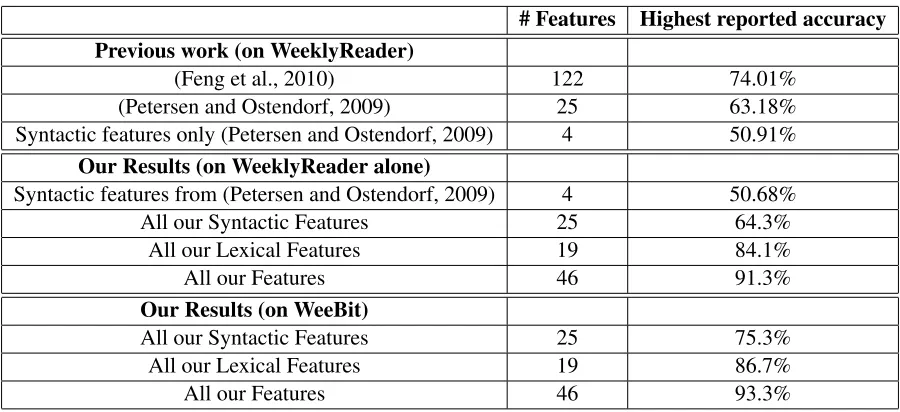
[image:8.612.81.531.52.258.2]All our Features 46 93.3%
Table 6: Overall Results and Comparison with Previous Work
in mind that the improvement is achieved on the WeeBit corpus which is an extension of the Week-lyReader corpus previously used. Interestingly, the result of 89.7% for BEST10ALL, the top 10 features chosen by the WEKA ranker, are quite close to our best result, with a very small number of features.
Lexical features seem to perform better than syn-tactic features when considered separately. How-ever, this better performance of lexical features was mainly due to the addition of the traditionally used features NumChar andNumSyll. So it is no won-der that these shallow features have been used in the traditional readability formulae for such a long time; but the predictive power of the traditional for-mulae as features by themselves is poor (38.8%), in line with the conclusions drawn in previous research (Schwarm and Ostendorf, 2005; Feng et al., 2010) about the Flesch-Kincaid and Dale-Chall formulae. Interestingly, Coleman, which was not considered in those previous approaches, was ranked among the Top-10 most predictive features by the WEKA ranker. So it holds a good predictive power when used as one of the features for the classifier.
We also studied the impact of SLA based fea-tures alone on readability classification. The perfor-mance of the SLA based lexical features (SLALEX) and syntactic features (SLASYN) when considered separately are still in a comparable range with the previously reported results on readability classifi-cation (68.1% and 71.2% respectively). However,
combining both of them resulted in an accuracy of 82.3%, which is a considerable improvement over previously reported results. It again adds weight to the initial hypothesis that SLA based features can be useful for readability classification.
5.4 Comparison with previous work
Table 6 provides an overall comparison of the accu-racies obtained for the key features sets in our work with the best results reported in the literature for the WeeklyReader corpus. However, since our classi-fication experiments were carried out with a newly compiled corpus extending the WeeklyReader data, such a direct comparison is not particularly mean-ingful by itself. To address this issue, we explored two avenues.
Firstly, we ran additional experiments, training and testing on the WeeklyReader data only, includ-ing the four levels used in previous work on that cor-pus. A summary of the results can be seen in Table 6. Our approach with 46 features results in 91.3% accuracy on the WeeklyReader corpus, compared to 74.01% as the best previous WeeklyReader result, reported by Feng et al. (2010) for their much larger feature set (122 features).
pub-lished (50.7% vs. 50.91%), supporting the compa-rability of the WeeklyReader data used. The signif-icant performance increase we reported thus seems to be due to the new features we integrated from the SLA literature.
Secondly, we were interested in the impact of the training size on the results. We therefore investi-gated how good our best approach (using all fea-tures) is on a training corpus that is comparable to the WeeklyReader corpus used in previous work in terms of the number of documents per class. When we took 1400 WeeklyReader documents distributed into four classes as described in Feng et al. (2010), we obtained an accuracy of 84.2%, compared to the 74.01% they reported as best result. Using 2500 documents distributed into four classes as in Pe-tersen and Ostendorf (2009) we obtained 88.4%, compared to their best result of 63.18%. Given that the original corpora used are not available, these WeeklyReader corpora with the same source, num-ber of documents, and size of classes are as close as we can get to a direct comparison. In the future, the availability of the WeeBit corpus will support a more direct comparison of approaches.
In sum, the above experiments seem to indicate that the set of features and classifier used in our ap-proach play an important role in the resulting signif-icant increase in accuracy.
6 Conclusion and Discussion
We created a new corpus, WeeBit, by combining texts from two graded web sources WeeklyReader and BBC Bitesize. The resulting text corpus is larger and covers more grade levels, spanning the age group between 7 and 16 years. We hope that the availability of this graded corpus will be useful as an empirical basis for future studies in automatic readability assessment.13
We studied the impact of various lexical and syn-tactic features and explored their performance in combination with features encoding syntactic com-plexity and lexical richness that were inspired by Second Language Acquisition research. Our experi-ments show that not only the full set of features, but
13As mentioned above, we will make the WeeBit corpus
available to all researchers who have obtained the inexpensive research license from WeeklyReader.
also specific manually or automatically selected sub-sets of features provide results significantly improv-ing on the previously published state of the art in automatic readability assessment. There also seems to be a clear correlation between the good predictors according to SLA research on language learning and those that performed well in text classification.
Although the exact criteria based on which the individual corpora (WeeklyReader, BBC-Bitesize) were created is not known, it is possible that they were created with the well-known, traditional read-ability formulae in mind. It would be surprising if the two corpora, compiled in the US and Britain by different companies, were created with the same set of measures in mind, so the WeeBit corpus should be less affected. Still, it is possible that the rea-son the traditional features NumChar, NumSyll and MLS held such a strong predictive power is that these measures were considered when the texts were written. But removing these traditional features only strengthens the role of the other features and thereby the main point of the paper arguing for the usefuless of SLA developmental measures for readability clas-sification.
As a part of our future work, we intend to revisit and study the impact of further classes of features employed in psycholinguistics and cognitive sci-ence research, such as those studied in Coh-Metrix (Graesser et al., 2004) or in the context of retrieving texts for specific groups of readers (Feng, 2010).
In terms of our overall application goal, we are currently studying the ability of the classification models we built to generalize to web data. We then plan to add the classification model to a language aware search engine (Ott and Meurers, 2010). Such a search engine may then also be able to integrate user feedback on the readability levels of webpages, to build a dynamic, online model of readability.
7 Acknowledgements
We thank the anonymous reviewers and workshop organizers for their feedback on the paper. The re-search leading to these results has received funding from the European Commission’s 7th Framework Program under grant agreement number 238405 (CLARA).14
References
Sandra Aluisio, Lucia Specia, Caroline Gasperin, and Carolina Scarton. 2010. Readability assessment for text simplification. InProceedings of the NAACL HLT 2010 Fifth Workshop on Innovative Use of NLP for Building Educational Applications, pages 1–9, Los Angeles, California, June.
Jeanne S. Chall and Edgar Dale. 1995. Readability Revisted: The New Dale-Chall Readability Formula. Brookline Books.
Maio Chen and Klaus Zechner. 2011. Computing and evaluating syntactic complexity features for automated scoring of spontaneous non-native speech. In Pro-ceedings of the 49th Annual Meeting of the Associ-ation for ComputAssoci-ational Linguistics, pages 722–731, Portland, Oregon, June.
Meri Coleman and T.L. Liau. 1975. A computer read-ability formula designed for machine scoring. Journal of Applied Psychology, 60:283–284.
Kevyn Collins-Thompson and Jamie Callan. 2004. A language modeling approach to predicting reading dif-ficulty. InProceedings of HLT/NAACL 2004, Boston, USA.
Averil Coxhead. 2000. A new academic word list. Teachers of English to Speakers of Other Languages, 34(2):213–238.
Scott A. Crossley, David F. Dufty, Philip M. McCarthy, and Danielle S. McNamara. 2007a. Toward a new readability: A mixed model approach. In Danielle S. McNamara and Greg Trafton, editors,Proceedings of the 29th annual conference of the Cognitive Science Society. Cognitive Science Society.
Scott A. Crossley, Max M. Louwerse, Philip M. Mc-Carthy, and Danielle S. McNamara. 2007b. A lin-guistic analysis of simplified and authentic texts. The Modern Language Journal, 91(1):15–30.
Edgar Dale and Jeanne S. Chall. 1948. A formula for predicting readability. Educational research bulletin; organ of the College of Education, 27(1):11–28. Felice Dell’Orletta, Simonetta Montemagni, and Giulia
Venturi. 2011. Read-it: Assessing readability of ital-ian texts with a view to text simplification. In Proceed-ings of the 2nd Workshop on Speech and Language Processing for Assistive Technologies, pages 73–83. William H. DuBay. 2006. The Classic Readability
Stud-ies. Impact Information, Costa Mesa, California. Lijun Feng, Martin Jansche, Matt Huenerfauth, and
No´emie Elhadad. 2010. A comparison of features for automatic readability assessment. InIn Proceedings of the 23rd International Conference on Computational Linguistics (COLING 2010), Beijing, China.
Lijun Feng. 2010. Automatic Readability Assessment. Ph.D. thesis, City University of New York (CUNY).
Thomas Francois and Patrick Watrin. 2011. On the con-tribution of mwe-based features to a readability for-mula for french as a foreign language. InProceedings of Recent Advances in Natural Language Processing, pages 441–447.
Arthur C. Graesser, Danielle S. McNamara, Max M. Louweerse, and Zhiqiang Cai. 2004. Coh-metrix: Analysis of text on cohesion and language. Behav-ior Research Methods, Instruments and Computers, 36:193–202.
Mark Hall, Eibe Frank, Geoffrey Holmes, Bernhard Pfahringer, Peter Reutemann, and Ian H. Witten. 2009. The weka data mining software: An update. The SIGKDD Explorations, 11(1).
Michael Heilman, Kevyn Collins-Thompson, Jamie Callan, and Maxine Eskenazi. 2007. Combining lexical and grammatical features to improve readabil-ity measures for first and second language texts. In Human Language Technologies 2007: The Confer-ence of the North American Chapter of the Associa-tion for ComputaAssocia-tional Linguistics (HLT-NAACL’07), pages 460–467, Rochester, New York.
Michael Heilman, Kevyn Collins-Thompson, and Max-ine Eskenazi. 2008a. An analysis of statistical mod-els and features for reading difficulty prediction. In Proceedings of the 3rd Workshop on Innovative Use of NLP for Building Educational Applications, Colum-bus, Ohio.
Michael Heilman, Le Zhao, Juan Pino, and Maxine Eske-nazi. 2008b. Retrieval of reading materials for vocab-ulary and reading practice. InProceedings of the Third Workshop on Innovative Use of NLP for Building Ed-ucational Applications (BEA-3) at ACL’08, pages 80– 88, Columbus, Ohio.
Alex Housen and Folkert Kuiken. 2009. Complexity, accuracy, and fluency in second language acquisition. Applied Linguistics, 30(4):461–473.
Rohit J. Kate, Xiaoqiang Luo, Siddharth Patwardhan, Martin Franz, Radu Florian, Raymond J. Mooney, Salim Roukos, and Chris Welty. 2010. Learning to predict readability using diverse linguistic features. In 23rd International Conference on Computational Lin-guistics (COLING 2010).
J. P. Kincaid, R. P. Jr. Fishburne, R. L. Rogers, and B. S Chissom. 1975. Derivation of new readability for-mulas (Automated Readability Index, Fog Count and Flesch Reading Ease formula) for Navy enlisted per-sonnel. Research Branch Report 8-75, Naval Techni-cal Training Command, Millington, TN.
Xiaofei Lu. 2010. Automatic analysis of syntactic complexity in second language writing. International Journal of Corpus Linguistics, 15(4):474–496. Xiaofei Lu. 2011a. A corpus-based evaluation of
syn-tactic complexity measures as indices of college-level esl writers’ language development. TESOL Quarterly, 45(1):36–62, March.
Xiaofei Lu. 2011b. The relationship of lexical richness to the quality of esl learners’ oral narratives. The Mod-ern Languages Journal. in press.
Philip McCarthy and Scott Jarvis. 2010. Mtld, vocd-d, and hd-d: A validation study of sophisticated ap-proaches to lexical diversity assessment.Behavior Re-search Methods, 42(2):381–392.
J. Nelson, C. Perfetti, D. Liben, and M. Liben. 2012. Measures of text difficulty: Testing their predictive value for grade levels and student performance. Tech-nical report, The Council of Chief State School Offi-cers.
Niels Ott and Detmar Meurers. 2010. Information re-trieval for education: Making search engines language aware. Themes in Science and Technology Education. Special issue on computer-aided language analysis, teaching and learning: Approaches, perspectives and applications, 3(1–2):9–30.
Sarah E. Petersen and Mari Ostendorf. 2009. A machine learning approach to reading level assessment. Com-puter Speech and Language, 23:86–106.
Slav Petrov and Dan Klein. 2007. Improved inference for unlexicalized parsing. InHuman Language Tech-nologies 2007: The Conference of the North American Chapter of the Association for Computational Linguis-tics; Proceedings of the Main Conference, pages 404– 411, Rochester, New York, April.
Mikael Roll, Johan Frid, and Merie Horne. 2007. Mea-suring syntactic complexity in spontaneous spoken swedish. Language and Speech, 50(2).
Sarah Schwarm and Mari Ostendorf. 2005. Reading level assessment using support vector machines and statistical language models. In Proceedings of the 43rd Annual Meeting of the Association for Computa-tional Linguistics (ACL’05), pages 523–530, Ann Ar-bor, Michigan.
Luo Si and Jamie Callan. 2001. A statistical model for scientific readability. InProceedings of the 10th Inter-national Conference on Information and Knowledge Management (CIKM), pages 574–576. ACM.
A. Jackson Stenner. 1996. Measuring reading compre-hension with the lexile framework. In Fourth North American Conference on Adolescent/Adult Literacy. Stephanie Strassel, Dan Adams, Henry Goldberg,
Jonathan Herr, Ron Keesing, Daniel Oblinger, Heather Simpson, Robert Schrag, and Jonathan Wright. 2010.
The darpa machine reading program - encouraging lin-guistic and reasoning research with a series of read-ing tasks. In Language Resources and Evaluation (LREC), Malta.