2018
Determining indicators of deception in computer
mediated communication using eye tracking
Akmal Mirsadikov Iowa State University
Follow this and additional works at:https://lib.dr.iastate.edu/etd
This Dissertation is brought to you for free and open access by the Iowa State University Capstones, Theses and Dissertations at Iowa State University Digital Repository. It has been accepted for inclusion in Graduate Theses and Dissertations by an authorized administrator of Iowa State University Digital Repository. For more information, please [email protected].
Recommended Citation
Mirsadikov, Akmal, "Determining indicators of deception in computer mediated communication using eye tracking" (2018).Graduate Theses and Dissertations. 16641.
by
Akmal Mirsadikov
A dissertation submitted to the graduate faculty
in partial fulfillment of the requirements for the degree of
DOCTOR OF PHILOSOPHY
Major: Business and Technology (Information Systems)
Program of Study Committee: Joey George, Major Professor
Kevin Scheibe Sree Nilakanta
Sekar Raju Huaiqing Wu
The student author, whose presentation of the scholarship herein was approved by the program of study committee, is solely responsible for the content of this dissertation. The Graduate College will ensure this dissertation is globally accessible and will not permit alterations after a
degree is conferred.
Iowa State University
Ames, Iowa
2018
DEDICATION
I would like to dedicate this dissertation to my late father, Mirsadikov Mirazam, who has
instilled in me love for learning. An avid reader, he wanted people around him to read and enjoy
learning and made every effort to educate his children. He would, certainly, have been very
proud to see this day. May God bless his soul.
I also dedicate this work to my family: my mom, my wife Gulnora, and my three children
Mirmuhammad, Madina, and Mahmud. You all have served as my motivation throughout this
TABLE OF CONTENTS
Page
LIST OF FIGURES ... vi
LIST OF TABLES ... vii
ACKNOWLEDGMENTS ... ix
ABSTRACT ...x
CHAPTER 1. INTRODUCTION ...11
CHAPTER 2. DETERMINING INDICATORS OF DECEPTION IN VARYING MEDIA MODES USING EYE TRACKING ...15
Abstract ... 15
Introduction ... 15
Literature Review ... 20
Deception detection ... 20
Hypotheses development ... 22
Eye tracking ... 34
Research Method ... 38
Pilot study ... 38
Main Study Procedure ... 39
Measures ... 44
Analysis and Results ... 46
Fixation duration on the speaker’s eyes ... 48
Fixation frequency on the speaker’s eyes ... 49
Fixation duration on the speaker’s mouth ... 50
Fixation frequency on the speaker’s mouth ... 50
Fixation duration on the speaker’s torso ... 50
Fixation frequency on the speaker’s torso ... 51
Detection Accuracy ... 51
Analysis of the research model ... 53
Honest messages with sound ... 54
Honest message without sound ... 54
Deceptive message with sound ... 54
Deceptive message without sound ... 55
Discussion ... 55
Implications ... 60
Limitations and future research ... 62
References ... 63
CHAPTER 3. DETECTING DECEPTION IN TEXT: WHAT YOUR EYES SEE ...70
Abstract ... 70
Introduction ... 70
Literature review ... 74
Human visual system... 74
Eye tracking ... 75
Reading ... 76
Eye movements in reading ... 78
Deception... 82
Text-Based Cues to Deception ... 86
Theme 1: Cognitive load ... 88
Theme 2: Psychological emotions ... 90
Theme 3: Sensory and contextual information ... 93
Theme 4: Memory ... 94
Omitted linguistic cues ... 94
Detection accuracy ... 95
Research Method ... 96
Experimental stimuli ... 96
Pilot study ... 96
Main Study ... 98
Measures ... 100
Analysis and Results ... 101
Theme 1: Cognitive load ... 101
Regression count ... 101
Total time ... 102
Fixations Duration and Count Total ... 102
Causation ... 103
Exclusive ... 104
Motion verbs ... 104
Theme 2: Psychological emotions ... 105
Certainty... 105
Generalizing terms ... 105
Passive voice verbs ... 105
First-person pronouns ... 106
Third-person pronouns ... 106
Negative emotions ... 106
Negations ... 107
Theme 3: Sensory and contextual information ... 107
Sensory processes ... 107
Temporal ... 107
Spatial ... 108
Theme 4: Memory ... 108
Insight ... 108
Cognitive processes ... 108
Detection accuracy: All cues ... 109
Discussion ... 115
Implications and future research ... 123
Limitations... 124
References ... 125
Appendix A. Definitions of Linguistic Cues to Deception (Hauch et al., 2015) ...129
Appendix B. Stimuli Statements ...131
Statement #1 ... 131
Statement #2 ... 131
Statement #3 ... 131
Statement #4 ... 132
Statement #5 ... 132
Statement #6 ... 133
Statement #7 ... 133
Statement #8 ... 133
Statement #9 ... 134
Statement #10 ... 134
Statement #11 ... 134
Statement #12 ... 135
Appendix C. IRB Approval ...136
LIST OF FIGURES
Page
Figure 1-1. Research model ... 13
Figure 2-1. Assigned Areas of Interest ... 45
LIST OF TABLES
Page
Table 2-1. Detectability of cues to deception across various media (Lewis, 2009) ... 27
Table 2-2. Distribution of video snippets in two stimulus sets for pilot study ... 38
Table 2-3. Demographic information ... 39
Table 2-4. Stimulus sets selected ... 42
Table 2-5. Arrangement of Treatments per Stimuli Set ... 43
Table 2-6. Distribution of Observations per Treatment for 6 Stimuli Sets ... 44
Table 2-7. Covariance estimates for variable Actor ... 47
Table 2-8. Estimates of means of fixation durations ... 48
Table 2-9. Estimates of mean differences of fixation durations ... 48
Table 2-10. Estimates of means of fixation frequencies ... 49
Table 2-11. Estimates of mean differences of fixation frequencies ... 49
Table 2-12. Parameter Estimates ... 52
Table 3-1. Participant demographic information ... 98
Table 3-2. Pairwise comparisons – mean differences ... 102
Table 3-3. Pairwise comparisons of fixation duration on AOIs - Mean difference ... 103
Table 3-4. Pairwise comparisons of fixation count on AOIs -Mean difference ... 104
Table 3-5. Parameter estimates of logistic regression. Each estimate is analyzed individually. ... 110
Table 3-6. Parameter estimates of logistic regression. Each estimate is analyzed individually. ... 110
Table 3-7. Parameter estimates of logistic regression for theme 1 variables ... 112
Table 3-9. Parameter estimates of logistic regression for fixation duration of theme 3
variables ... 114
Table 3-10. Parameter estimates of logistic regression for fixation duration of theme 4
variables ... 115
ACKNOWLEDGMENTS
There have been many people who have supported my pursuit of academic career. They
have been alongside me for the last five years, guiding me, consoling me, and most of all,
believing in me. Without them I would have never been able to accomplish this work. I would
like to thank each and every one of them.
I would like to thank my family, especially my wife Gulnora, for her selfless devotion
and love, who has carried all the burdens of raising our family on her shoulders and allowed me
to focus solely on my education. I thank my mom for her encouragement and prayers. I thank my
friend Nuriddin Ikramov for his reviews and edits of my work and guidance in my job pursuit. I
thank my children, Mirmuhammad, Madina, and Mahmud for their love and patience and for
bearing with me through the completion of my study.
I would like to thank my committee members, Dr. Scheibe, Dr. Nilakanta, Dr. Raju, and
Dr. Wu for their guidance and support throughout the course of this research. I would especially
like to thank my committee chair, Dr. Joey George, who has put up with my constant
interruptions from his work and who has been a true advisor and mentor in almost every matter.
Without your guidance and encouragement this journey would have been a dead end. I would
also like to thank my late professor, Dr. Brian Mennecke, for his tremendous support and love. I
will be forever grateful for your guidance, patience, and support.
In addition, I would also like to thank my friends, colleagues, the department faculty and
ABSTRACT
This work combines two studies, both identifying indicators of deception through the
analysis of the visual attention of a veracity judge. using eye tracking. In the first study, we
investigated the effect of the varying media modes on detection accuracy through the analysis of
the visual behavior of veracity judges. We employed eye tracking technology to understand
where the judges looked at and what impact their visual foci had on their detection performance.
We found that the visual foci of the judges varied as a result of the message veracity and media
modes. Judges fixated longer and more frequently on the mouth and the torso of the
communicators in deceptive messages. In video-only modes, the judges fixated longer on the
mouth of the sender. Fixation frequency on the eyes and the mouth of the sender worsened
deception detection accuracy. In the second study, we investigated the reading behavior of
veracity judges when presented with honest and deceptive statements produced in high-stake,
real-life scenarios with potential negative consequences for the individuals who produced those
statements. We found that the reading metrics of veracity judges varies across honest and
dishonest statements and the linguistic cues that the judges focus on have an effect on deception
CHAPTER 1. INTRODUCTION
Adoption of computer technologies accelerated the shift of our communication into
the computer mediated communication (CMC) environment using emails, text messaging,
videoconferencing, Voice Over Internet Protocol (VoIP), and other modes. The Internet and
especially Web 2.0 altered our means of seeking information and verifying its accuracy. Of
course, not all information that we come across or that we are communicated is credible;
some is deceptive. In fact, deception is part of our everyday life. Researchers generally
categorize lies as outright lies, exaggerations, and subtle lies. Outright lies, also referred to as
falsifications or fabrications, are complete lies with no truth in them. A student who states
that his paper is ready, while he has not even started writing one, is telling an outright lie. A
job applicant who attempts to embellish her résumé by stating that she is competent in Java
while her level could at best be categorized as a beginner is exaggerating. Concealing
information by omitting details or literal truth designed to mislead the target are examples of
subtle lies. In this work, we refer to the person attempting to deceive as a sender or a liar, and
the target of deception as a receiver.
Wide-spread adoption of CMC has created new venues for deception. In spite of its
prevalence in our daily communication, both private and business, research has shown that
we are poor detectors of deception. The relationship between media and deception detection,
while emerging, is understudied.
Investigation of deception and its detection has attracted researchers from multiple
disciplines. These researchers have attempted to identify reliable indicators of deception with
a goal to improve deception detection success rates. Not all deceptive communication
produced to maintain social relationships, and thus do not bear negative consequences. Other
lies, however, are more serious in their nature, and identifying those would bring benefits to
organizations and to societies. Identifying terrorism plots or serious crime offenders certainly
benefits our society. Similarly, hiring viable job candidates, or assigning business contracts
to reliable business vendors, is of great importance to organizations.
Traditionally, empirical research in deception detection has relied on trained coders
for identifying cues to deception. Such coders watch video footage or listen to audio
recordings of liars and truth tellers. They apply certain coding systems to record the
frequency and duration of behaviors that the truth tellers and liars display. Next, they
compare their results to identify whether a particular nonverbal or verbal behavior was more
prevalent in truth tellers or liars. The coders, however, are prone to mistakes: they may
misidentify a cue, fail to record one, or make other mistakes, and therefore coding is
conducted by multiple coders to minimize the error rate. Contemporary tools and techniques
used by deception researchers allow them to overcome the shortcomings of depending on
coders. Eye tracking technologies, for example, provide a unique insight into an individual’s
viewpoint and provide information about what the person looked at, how long they looked,
and what pattern her gaze displayed. This technology records all eye movements of the
individual and thus provides objective, complete, and accurate data on what the person
looked at when assessing the veracity of another person or of a written statement. Access to
such data allows researchers to better identify behaviors of senders (in video format) and
written cues (in text) associated with accurate detection of deception or truth telling.
Most research on deception detection has investigated deception in face-to-face
not well understood. Particularly, the research stream on understanding the relationship
between the differences in communication modes and accurate deception detection is scant.
The central focus of this work, thus, is to understand the relationship between message
veracity, media, and deception detection through the analysis of the point of regard of the
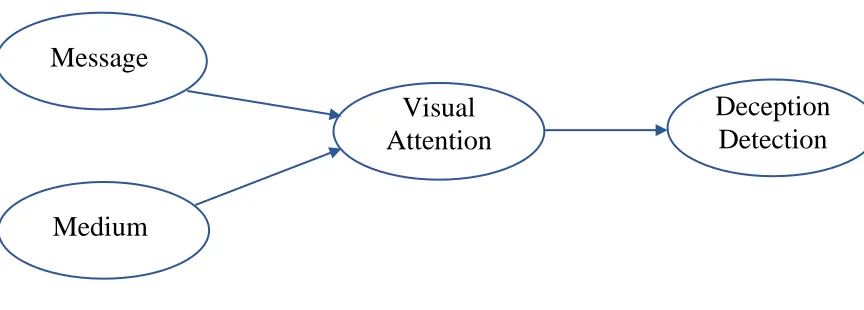
[image:14.612.92.524.259.414.2]veracity judge. Figure 1 shows the guiding research model of this work.
Figure 1-1. Research model
This dissertation is comprised of two studies, each addressing specific research
questions pertaining to the research model. In the first study, applying eye tracking
technology, we attempt to address the following three research questions:
1. Where do veracity judges look when presented with varying communication
modes?
2. Where do veracity judges look when being lied to or told the truth?
3. What is the relationship between what judges focus on and their deception
detection success?
In the second study we investigate deception in written text. Specifically, we focus on
deception produced in real-life, high-stake settings and attempt to understand what linguistic
Message
Medium
Visual
Attention
cues were noticed by the veracity judges and how those cues affected their deceptive
detection performance. Thus, the second study addresses the following two research
questions:
1. What do veracity judges look at when assessing the veracity of a text
statement written in a high-stakes setting?
2. What is the relationship between what veracity judges choose to focus on and
their detection accuracy?
To address these research questions, we conducted experiments by recruiting college
students from a large Midwestern University. In the first study, we identified areas that
judges focused on when presented with varying media modes and when being lied to and told
the truth. We further investigated how what judges looked at affected their detection
accuracy. In the second study, we examined linguistic cues that the judges focused on when
presented with deceptive and honest written statements and how those linguistic cues
affected their detection accuracy. This exploratory study provides a unique approach of
studying deception from the perspective of a veracity judge and identifies areas where the
judges would focus when communicated through different medium modes and when being
CHAPTER 2. DETERMINING INDICATORS OF DECEPTION IN VARYING MEDIA MODES USING EYE TRACKING
Akmal Mirsadikov/Iowa State University
Modified from a manuscript to be submitted to MIS Quarterly
Abstract
Our daily interactions, both personal and professional, are taking place more and
more through mediated modes of communication at this era of interconnectedness. In
computer mediated communication (CMC), we seem to continue our habits of face-to-face
interactions, including lying. Prior research on deception and its detection has focused on
identifying indicators of deception, but deception taking place in CMC has not been
researched well, especially in investigating the varying role of media on deception detection
performance. In this study we investigated the effect of the varying media modes on
detection accuracy through the investigation of the visual behavior of veracity judges. We
employed eye tracking technology to understand where the judges looked at and what impact
their visual foci had on their detection performance. We found that the visual foci of the
judges varied as a result of the message veracity and media mode. Judges fixated longer and
more frequently on the mouth and the torso of the communicators in deceptive messages. In
video-only modes, the judges fixated longer on the mouth of the sender. Fixation frequency
on the eyes and the mouth of the sender worsened deception detection accuracy.
Introduction
People, as social beings, need to communicate with each other. In doing so, we tend
to tell lies, both in the pursuit of self-interest or for altruistic purposes, i.e. for the benefit of
others. For example, while a student caught cheating on an exam may lie to avoid being
terrible haircut, could be intended to benefit someone other than the deceiver. Research on
deception has shown that lying is quite prevalent in daily life. DePaulo and her colleagues
suggest that people lie on average one or two times a day (DePaulo et al., 1996). Most lies
that people tell are pedestrian in their nature and are about people's preferences, attitudes, and
feelings.
People generally prefer to differentiate truth tellers from those attempting to deceive,
especially when the stakes of acting on deceptive information are high. Managers making
hiring decisions in organizations, for example, must be able to differentiate valid candidates
from those who attempt to deceive. Job applicants tend to lie both on their résumés (Guillory
and Hancock, 2012) and during job interviews (Fisher, 2014), and the costs of hiring the
wrong people could be quite high down the road. Phishing is another form of deception,
where perpetrators, through the use of electronic communication channels, attempt to gain
certain benefits by persuading the victims to perform certain actions (Abdelhamid et al.,
2014). Just in the third quarter of 2017, 296,208 unique phishing reports worldwide were
submitted to the Anti-Phishing Working Group (APWG, 2018).
However, previous research has shown that humans are not good at detecting lies. In
fact, we can detect lies with about 54% success rate, or slightly better than by chance (Bond
and DePaulo, 2006; Miller and Stiff, 1993; Vrij, 2000). This number, however, does not
reflect people’s real ability to detect deception. The 54% detection rate is based on receivers’
ability to correctly determine truth when the message is truthful, and correctly determine
deception when the message is deceptive (Bond and DePaulo, 2006). In fact, people are
generally good at detecting truth (about 70-80% of the time) but very bad at detecting
Research on deception detection is based on the premise that the behaviors of liars,
both verbal and non-verbal, are different from those of truth tellers. Researchers have tried to
identify those behaviors and other reliable indicators of lying, or cues, that are associated
with lying. More than five decades of research on deception detection has not come up with
even a single cue that is always associated with lying (akin to Pinocchio’s nose), although
some verbal and non-verbal cues to deception have been identified to be more reliably
associated with deception than other cues on average. A well-cited meta-analysis that
investigated many cues that have been associated with lying identified only a small set of
cues that are diagnostic of deception (DePaulo et al., 2003).
A large proportion of research on deception has investigated deception in face-to-face
(FtF) interactions. Increasingly, however, our daily communication is mediated through
various communication technologies (i.e. smart phones, chat rooms, social media boards and
messenger apps, FaceTime, emails, and others). People continue to use deception in
technology-mediated environments, although the relationship between deception, its
detection, and media is not clear (George and Robb, 2008). While the research about
detection of deception when communicating face-to-face is well established, the stream of
research on detecting deception when a communication medium is involved is relatively less
investigated (George et al., 2016; Hancock, 2007). While lying remains a common part of
daily interaction in computer-mediated communication or CMC (George and Robb, 2008;
McHaney et al., 2017), the detection accuracy in CMC remains equal to that of face-to-face
communication (Hancock et al., 2010). This similar detection performance rate raises some
interesting questions. How do people assess honest and dishonest information across varying
detection, Bond and DePaulo (2006) suggest that the video (only) medium generally invites
an application of a liar stereotype and results in a poorer detection accuracy rate. In video
only conditions, the veracity judges do not have access to the verbal content of the stimuli
and depend on visual cues, to which they attend based on their beliefs. In this study, we
investigate how the choice of media affects the attention foci of the observers. Thus, the first
research question guiding this study attempts to address the effect of media differences on the
observer’s behavior. Specifically, we attempt to investigate how, if at all, the visual attention
of veracity judges varies under varying media.
The research on deception detection proposes multiple explanations for poor
detection performance. For example, cognitive biases, including a truth bias, whereby people
tend to believe the speaker, or a lie bias, whereby targets decode all incoming messages as
deceptive (McCornack and Levine, 1990), have been shown to impede veracity assessment
(George et al., 2008). Other factors affecting the accuracy of detection include motivations of
both a deceiver and his/her target, their experience in lie detection, message severity, time to
rehearse a lie or to prepare a response when asked, and many other reasons. Vrij (2008)
suggests that one of the reasons for such poor detection rates is that detectors pay attention to
cues that are not reliably associated with deception. Researchers have used different
techniques and tools in studying deception and its detection (Bond and DePaulo, 2006).
Generally, researchers conduct laboratory-based experiments where participants, mostly
students, provide truthful and/or deceptive messages. Their verbal responses and non-verbal
behavior, or cues, are coded by trained third party coders, whose objective is to map
The limitation of this approach is that the coders are prone to mistakes and may not
code all verbal and non-verbal cues that veracity judges may observe. To overcome the
shortcomings of the human coders and to utilize the progress made in technological
innovations to help detect physiological nuances not observable by human detectors,
researchers have employed various tools and techniques that assess physiological, vocal, and
brain activity measures of deceivers (Granhag et al., 2015). They have embraced the use of
polygraphs, voice stress analyzers, thermal imaging cameras, brain scanning technologies
such as fMRI and EEG, and eye tracking technology to detect the deceit (Elaad, 2014;
Vicianova, 2015). The eye tracking technology, which helps to investigate the gaze behavior
of the subjects, enables the researches to tap into objective data not previously available to
them. As technology advances, these tools are becoming increasingly affordable, less
invasive and easier to use, and promise exciting insights into this topic.
Our study employs eye-tracking technology to objectively determine the cues that
veracity judges actually look at when assessing the targets. This approach helps us analyze
the eye movement behavior of people who assess the truthfulness of the senders and to
compare this behavior to the cues that coders have been trained to code. A closer look at the
cues that our participants focus on may reveal new areas not previously mentioned in the
deception detection literature, and help us both, to confirm what we already know about cues
and potentially to add new ones to the list of detection behavior. Thus, the second research
question seeks to investigate how, if at all, the visual attention of veracity judges varies
across honest and dishonest messages. As the ultimate purpose of our study is to investigate
seeks to understand, how, if at all, the areas that judges choose to focus on affect their
detection accuracy.
Next, we will review the literature on deception detection, media, and eye tracking
and discuss theoretical approaches that help us derive our hypotheses. Then, we will present
the research method and explanation of the procedures for the pilot and main studies, and
present our findings. We conclude the paper with a discussion of results.
Literature Review
Deception detection
People generally want to differentiate truths from lies. We say “generally” because
our social interactions would be unbearable if everyone only spoke the truth all the time. A
mediocre cook who spent three hours cooking a dinner to please her spouse would not want
to hear an honest assessment that any takeout would have been better. There are, however,
people whose job it is to accurately distinguish lies from the truth, at least in the professional
context. For example, lawyers, prosecutors, law enforcement officials, customs officers,
insurance personnel, journalists, judges, and others would want to accurately discriminate
between truth and lies to make informed decisions.
What is deception? In this study, we follow Buller and Burgoon (1996), whereby they
define deception as “a message knowingly transmitted by a sender to foster a false belief or
conclusion by the receiver.” This definition of deception suggests that not all deviations from
truth are considered deception. The deceiver must “knowingly” attempt to distort his
message or behavior. Thus, the intention of the sender is key in defining the act of deception.
Vrij suggests that both successful and failed attempts to deceive are considered deception
which he refers to as “digital deception” and which incorporates the technologically mediated
nature of interaction (Hancock, 2007).
People lie every day about various issues. On average, we lie about one or two times
a day, with most lies being about our feelings, preferences, opinions and attitudes (DePaulo
et al., 2003). DePaulo and her colleagues (1996) concluded that lying was a commonplace
attribute of daily life, wherein people lied in approximately one-third of their daily
communication. In a similar study, employing a diary study methodology, Hancock and
colleagues found that over a quarter of interactions were deceptive (Hancock et al., 2004). A
replication study of Hancock et al. concluded that lying is a common part of everyday
discourse, not only in face-to-face interactions, but also increasingly in CMC environments
(George and Robb, 2008).
Why do people lie? There are many reasons, and they can be condensed into three
broad categories: (1) instrumental - to achieve certain benefit or exercise power, (2) relational
- to maintain the desired relationship, and (3) identity based - to avoid embarrassment or to
project a desired image (Buller and Burgoon, 1996). In contrast to a lay person’s belief that
people lie for self-interested purposes, many lies are intended to benefit others, especially
those lies designed to maintain social interactions. Vrij (2008) dubs them “social lies” (p. 20)
or “social lubricant,” whereby the sender acts both in self-interest and in the interest of
others. Vrij suggests similar motivations for people’s deception: (1) for one’s own benefit or
for the benefit of others; (2) to avoid costs or punishment; and (3) for materialistic or
psychological reasons (Vrij, 2007).
Given the common use of lies in everyday life and thus our familiarity with lying and
at detecting deception? Deception detection researchers have investigated this and related
questions to identify reliable indicators of lying, the reasons for lying, and to find tools and
techniques to improve our performance as lie detectors. Of over 150 cues that have been
identified and investigated over the years, only a handful of cues to deception have been
reliably associated with lying (DePaulo et al., 2003).
People are generally bad at detecting lies because they underestimate their ability to
lie and overestimate their ability to detect lies (Elaad, 2003). Vrij (2007) suggests that poor
motivation, difficulties associated with lie detection, and common errors in detecting lies lead
to many lies being left unnoticed. The deception detection accuracy of professionals, such as
police officers and customs officers, is generally not better than that of ordinary people
(Bond and DePaulo, 2006), which suggests that lie detection is difficult. People also tend to
assess the message veracity based on cues that are not reliably associated with deception,
which are also referred to as subjective cues to deception (Strömwall et al., 2004).
Hypotheses development
Research on detecting deception has investigated many theoretical lenses to help
identify deception more accurately. One research stream is based on the premise that lying is
generally harder than truth telling (Ekman and Friesen, 1969; Zuckerman et al., 1981). The
multi-factor theory (Zuckerman et al., 1981) suggests that deception is directly associated
with psychological factors such as emotions, cognitive effort, and attempted behavioral
control. This approach proposes that lying arouses certain emotions in the sender, such as
guilt, fear, and excitement. Next, liars attempt to control their behavior, where they attempt
to suppress behaviors that they believe are associated with lying and try to display behaviors
that they think are related to being honest. Of course, not many people can skillfully enact the
display when communicating (Vrij, 2008). Lying could be mentally taxing as the sender must
cognitively process the content of the deceptive message and must remember the details of
his story to make it plausible and coherent to the receiver. At the same time, the sender needs
to monitor his own behavior and the reactions of the target for any signals of suspicion
(Buller and Burgoon, 1996). This extra cognitive burden resulting from multiple tasks that
the sender attempts to handle may results in a sender’s inferior performance. The
multi-factor theory suggests that psychological multi-factors result in behavioral differences that
distinguish truth tellers from those lying, i.e., the more senders experience emotions,
cognitive load, and attempt to control their behavior, the more likely they to display cues to
deception. For example, a person feeling guilt may avert his gaze and display more speech
hesitation, while fear may cause a higher pitch in a sender’s voice or a higher blink rate and
result in more verbal mistakes. Similarly, higher cognitive load may lead to a longer latency
period, less plausible stories, fewer illustrators, and in fewer head and trunk movements in
senders. Senders, who engage in strategic behavioral control, may end up looking longer into
the eye of the target and provide stories that sound too polished and rehearsed and may repeat
their stories more. Such cues may signal the receiver that the message is not genuine and
thus probably deceptive.
Ekman and Friesen's (1969) influential theory of deception, leakage theory, is built
around nonverbal behaviors of the sender. Similar to the multi-factor framework’s view, the
leakage theory suggests that lying produces an emotional response that is manifested
behaviorally. In the process of information inhibition or behavior simulation, the senders may
“leak” (hence the name of the theory) cues to deception through different parts of the body.
interpretable signals displayed by particular parts of the body. The face, they argue, is the
richest part of the human body to transmit discernible and visible information to a receiver
and thus is the primary focus of the target. Sending capacity is lower in the hands and lowest
in the feet.
Leakage theory also discusses two types of feedback – internal and external. External
feedback refers to the behavior of the receiver, which informs the sender what the receiver
has perceived and evaluated. The internal feedback, on the other hand, is a conscious
awareness of the sender of his own behavior. The sender, in an attempt to deceive the
receiver, relies on external feedback and monitors the reactions to the message. Because of
the sending capacity of body parts, the authors argue, people focus most on the face when
seeking feedback, and less on the other parts of the body. The face is the primary site for the
display of affect. Leakage theory suggests that the sender, in order to enact the desired affect
to support the message, will most focus on his facial features. Extra effort spent on one body
part, namely the sender’s face, will inhibit the performance of other body parts (hands and
feet), which may “leak” cues to deception that the receiver may notice. Leakage theory thus
suggests that receivers who focus more on the hands and feet of the sender are more likely to
be more accurate in detecting simulated messages than those receivers who focus on the face
of the sender.
Buller and Burgoon (1996) introduced Interpersonal Deception Theory (IDT), which
merges deception principles with interpersonal communication principles and offers a
process view of deception from an interactive, dynamic perspective. It suggests a continuous
interplay of interpretations in a face-to-face communication and subsequent enactments
of deception in interpersonal communication takes place in three phases: preinteraction,
interaction, and postinteraction. The context and the relationship of parties in the
preineraction phase, moderated by parties' expectations, knowledge, and goals, affect their
behaviors and cognitions, which in turn affect the interplay in the interaction phase. The
interaction phase refines receiver suspicions, if such exist, and subsequent sender behavior.
This iterative process concludes with receivers making an assessment of the sender’s veracity
and sender’s assessment of the receiver’s suspicion. As suggested, the sender engages in
multiple tasks simultaneously: she attempts to control the information conveyed and the
behavior displayed, while monitoring closely the reactions of the receiver and adjusts her
behavior accordingly. Such cognitive effort to control multiple tasks may not always be
successful and may result in unintended performance. Any display of suspicion from the
receiver would affect the sender's subsequent behavior. This dynamic exchange of
information and displays from both parties results in either the sender’s success or failure.
Researchers also tried to identify the beliefs that ordinary people around the world
have about the behaviors of liars (Team, 2006). In this study a group of researchers surveyed
participants from 58 countries. The respondents were asked what cues they used to identify a
lying person, to which more than a hundred different beliefs were provided. Four of those
beliefs were mentioned by more than 25% of the respondents: gaze aversion (64%), liars are
nervous (28%), incoherent statements (25%), and body movements (25%). In a similar study,
the two most common beliefs were found to be gaze aversion (73%) and body movements
(25%) (Mann et al., 2004). These studies suggest that judges in assessing the veracity of the
All three theoretical frameworks suggest that behaviors of the truth tellers should be
different from those of liars. The research on deception detection has investigated extensively
the verbal and non-verbal cues to deception. A meta-analysis by DePaulo and her colleagues
(2003) investigated 158 such cues and tried to identify the ones that are reliably associated
with lying by analyzing the effect sizes (Cohen’s d) for those cues. In his work, Vrij (2008)
summarized findings from multiple meta-analyses and proposed cues he dubbed “objective.”
Our discussion of underlying theoretical factors affecting the behavior of liars
suggests that deceivers will be expected to behave differently from truth tellers and the
judges may react to these differences by attending to them. Moreover, the beliefs that people
hold in assessing the veracity of deceivers may guide their visual attention to “anchor” areas,
from which they may shift their gaze when they notice deception leakage. Based on the
discussion of psychological factors, the multitasking cognitive load in interpersonal
interaction, the sending capacities of the body parts, and the leakage of cues, we propose that
senders’ lies will be signaled behaviorally and verbally and that receivers will react to them.
Our first hypothesis hence suggests:
Hypothesis 1:Visual attention of judges will vary across honest and dishonest messages.
The majority of the research on deception has focused on deception in face-to-face
communication, so the relationship between CMC and deception remains poorly understood
(George et al., 2008; George and Robb, 2008). Since lying continues to be a part of daily life
and as the variety of CMC technologies have been widely adopted and used for ordinary
communication, has the choice of media affected deceptive behavior and its detection? The
face-to-face interactions, yet many of those cues may not be available under different media
modes. Any communication medium will have a reduced number of cues available for
deception detection, compared to synchronous face-to-face communication (Daft and Lengel,
1986; George et al., 2016). Furthermore, media vary in their ability to transmit those cues.
For example, any cues that are visually and vocally detectable (i.e., pressed lips, body
movement, word repetition, logical structure of the message, and others) are available in full
audio-visual media modes and cannot be detected in text only media. Similarly, cues that are
detectable in audio modes (high pitched voice, latency period, and others) cannot be detected
in written modes. There seems to be a hierarchy of cues available for detection afforded by
the medium, where full audio-visual modes are able to transmit the most cues and text only
mode can transmit the least, while the audio only mode is placed somewhere in between.
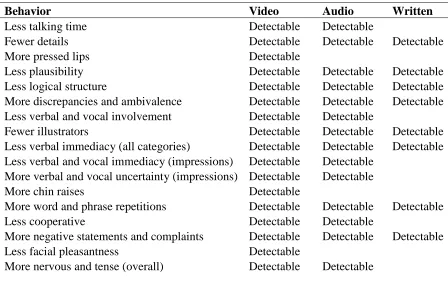
[image:28.612.91.539.439.726.2]Table 2-1 shows the detectability of cues under different communication modes.
Table 2-1. Detectability of cues to deception across various media (Lewis, 2009)
Behavior Video Audio Written
Less talking time Detectable Detectable
Fewer details Detectable Detectable Detectable
More pressed lips Detectable
Less plausibility Detectable Detectable Detectable
Less logical structure Detectable Detectable Detectable
More discrepancies and ambivalence Detectable Detectable Detectable
Less verbal and vocal involvement Detectable Detectable
Fewer illustrators Detectable Detectable Detectable
Less verbal immediacy (all categories) Detectable Detectable Detectable
Less verbal and vocal immediacy (impressions) Detectable Detectable
More verbal and vocal uncertainty (impressions) Detectable Detectable
More chin raises Detectable
More word and phrase repetitions Detectable Detectable Detectable
Less cooperative Detectable Detectable
More negative statements and complaints Detectable Detectable Detectable
Less facial pleasantness Detectable
Table 2-1 continued
Behavior Video Audio Written
More vocal tension Detectable Detectable
Higher frequency, pitch Detectable Detectable
More pupil dilation Detectable
More fidgeting Detectable
Fewer spontaneous corrections Detectable Detectable
Less admitted lack of memory Detectable Detectable Detectable
More related external associations Detectable Detectable Detectable
Following the reasoning from face-to-face communication and the potential variety of
cues suggested by the aforementioned theories, one would expect that in CMC, the
communication modes that are capable of transmitting the highest number of cues would
provide better opportunities for the receiver to detect deception and hence, by similar
reasoning, one would expect a sender to avoid such types of media. However, the empirical
evidence does not provide support for such a straightforward relationship and suggests mixed
findings (Burgoon et al., 2008; Burgoon et al., 2010). While some studies have found support
of the direct relationship between media and deception detection (Burgoon et al., 2008;
Dunbar et al., 2015), some found no support of such a relationship (Burgoon et al., 2010).
Two studies by George and his colleague found an indirect, mediated relationship between
medium and detection success. In one study, they found an indirect effect of media on
detection success through probing. The use of richer media was associated with more
probing, which in turn led to more accurate detection (George et al., 2008). In another study,
they found a mediated relationship between media and deception detection through sender
credibility. When the media increased perceived sender credibility, the accuracy of
wide range of explanations, and the available empirical evidence may explain this
discrepancy.
The academic information systems domain investigates, among many other topics,
how information systems help to improve task performance. Media synchronicity theory
(MST) was introduced as a theory of communication performance and extended beyond the
question of media choice for certain types of tasks. Pointing out the shortcomings of media
richness theory (Dennis and Kinney, 1998), which suggests that people are better off
choosing specific media based on the nature of the message they want to transmit (Daft and
Lengel, 1986), MST argues that matching media capabilities to communication processes
improves communication performance (Dennis et al., 2008). Instead of focusing on the
communication task, the authors propose focusing on the underlying processes, or steps, as
they put it, and suggest that every communication task is composed of different mixes of
conveyance and convergence processes. Conveyance processes include gathering and
transmission of new information and processing it within an individual to build a mental
model of the situation. Convergence processes of communication refer to the processes
aimed at building shared understanding among the communicating individuals.
Defining synchronicity as a shared pattern of coordinated synchronous behavior
among individuals as they work together, the authors define media synchronicity as “the
extent to which the capabilities of a communication medium enable individuals to achieve
synchronicity.” (p. 581). The authors suggest five media capabilities that influence media
synchronicity: (1) transmission velocity, or the speed at which a medium can deliver a
message among communicators, (2) parallelism, or the number of transmissions that a
medium can transmit, (4) rehearsability, or the extent to which the communication medium
allows the sender to rehearse or edit a message before sending, and (5) reprocessability, or
the extent to which the communication medium allows the receiver to reexamine or revisit
the message either during the process of communication or later on. MST proposes that for
conveyance processes use of media supporting lower media synchronicity should result in
better communication performance, whereas for convergence processes, use of media with
high media synchronicity should improve communication performance. While MST was
introduced as a theory of communication where both information sender and receiver are
honest and work toward building shared understanding, the same theory was empirically
tested to explain strategic choice of media in deceptive communication (George et al., 2013).
The researchers sought to investigate whether those intending to deceive preferred certain
types of media, as well as the reasons for preferring a certain medium over another. MST was
found to be an accurate predictor of media choice, where transmission velocity and symbol
sets were overwhelmingly favored by those seeking convergence, and rehearsability and
reprocessability were favored by those seeking conveyance.
MST offers a different approach for the assessment of communication medium by
focusing on the individual capabilities of a medium, instead of a holistic view. While a full
audio-visual communication mode may offer a larger number of symbol sets and provide a
synchronous, interpersonal interaction, it lacks in rehearsability and reprocessability. A
veracity judge would not be able to revisit the content of the message or would not have a
chance to craft better counter arguments or to probe more researched questions. Video modes
In another study, researchers focused on key media characteristics to explain and
predict the relationship between media choice and deception (Carlson et al., 2004). They
pointed out six key media features: synchronicity, symbol variety, cue multiplicity,
tailorability, reprocessability, and rehearsability. These media characteristics are closely
aligned with the media capabilities in MST. Synchronicity of a medium is similar to
transmission velocity in MST; symbol variety is similar to symbol sets; cue multiplicity is
generally the same as parallelism in MST; tailorability refers to the ability of the medium to
allow the author of the message to customize the communication event and to personalize it
to the needs of a recipient; reprocessability and rehearsability are the same as the identical
name media capabilities in MST. Based on these characteristics, Carlson et al. (2004)
suggested that deceivers would deceive best when a medium features “higher levels of
symbol variety, tailorability, and rehearsability and lower levels of cue multiplicity and
reprocessability” (p.20).
Bond and DePaulo (2006) analyzed the deception research findings in light of the
double-standard framework. According to this framework, people in general view lying as a
negative quality and truth-telling as a virtue. Thus, when judging people who lie, they
perceive them as wrong and unacceptable. Yet when they themselves lie, they take a more
practical approach and suggest that their lying is innocuous or even is a sanctioned practice.
Similarly, they assume the reasons for lying by others as being “nefarious” (p.216). This
implies that people have stereotypes of liars, who are “stricken with shame, wracked by the
threat of exposure” and thus “leak signs of their inner torment.” (p. 216). This stereotypical
approach to assessing deception can lead to inaccurate decisions. Senders who fit this
cause such behavior. For example, a husband suspected of cheating on his spouse may
display anxiety or anger, the manifestation of which may very much resemble guilt of
acceptance or an attempt to cover up misconduct. On the other hand, those who do not
exhibit the stereotypical behavior are most likely to be believed. Empirical results from prior
research have shown that deception detection judges base their assessment of a person’s
truthfulness on the person’s demeanor, referred to as a demeanor bias: people who appear
most honest when lying are people who also appear most honest when telling the truth (Bond
and DePaulo, 2008; Bond Jr and Atoum, 2000; DePaulo and Rosenthal, 1979; Levine et al.,
2011).
Based on this double-standard framework, we suggest that people might look for the
stereotypical behavior of the message sender in assessing the veracity of the sender. Speakers
who fit these stereotypes are expected to be assessed as liars. As discussed earlier, media
may vary in how much they invite application of a stereotype by affording different levels of
detectability. Communication media that transmit more symbol variety will allow the
receivers to build a more thoughtful assessment of the sender, instead of relying solely on a
stereotypical image of a liar. A medium with less symbol variety may leave fewer options for
a thoughtful assessment and lead the receivers to rely more on their stereotypes. The same
message transmitted through different media with varying media capacities is expected to be
interpreted differently. Under different communication contexts the sender and receiver
cognition and behavior is expected to vary systematically (Buller and Burgoon, 1996). An
audiovisual image of a speaker allows a receiver a wider range of behavioral cues than a
video image with no sound, which should in turn affect the visual foci of the judges. Hence,
Hypothesis 2:Visual attention of judges exposed to full audiovisual stimuli should vary from visual attention of judges exposed to video stimuli only.
Our earlier discussion of the verbal and non-verbal cues to deception and their
detectability under varying media implies that the detection accuracy of the veracity judges is
contingent on, among other factors, the cues that judges attend to. In both full audio-visual
and video only stimuli, the judges have all visual cues available and only full audio-visual
mode affords vocal and paralinguistic cues, and as predicted by Hypothesis 2, the variance in
visual foci should result from differences in media capabilities of the two modes. This
expected variance in visual attention of judges should manifest itself in varying eye gaze
metrics, including the fixation duration and frequency on certain areas of interest (explained
further). In the discussion of biases that receivers may have towards the sender, Buller and
Burgoon (1996) suggest that when receivers become participants in the communication,
instead of observers, they attend more to facial cues. The authors suggest that facial cues are
less informative, whereas vocal cues are more informative of deception. Similarly, the
application of the stereotypical double-standard framework (Bond and DePaulo, 2006) by the
veracity judges can lead to inaccurate decisions, which should contribute to their detection
performance. A video message with access to verbal content should provide more content
for analysis and thus should not depend solely on stereotypical assessment. In line with this
reasoning, Vrij suggests that instead of focusing on single, independent cues to deception, a
focus on a combination or a cluster of cues would lead to better detection (Vrij, 2008). Thus
our third hypothesis posits:
In deception detection studies, as suggested earlier, researchers attempt to compare
“objective” deceptive behavior, which is usually provided by trained third party coders, with
“subjective” assessments provided by deception judges (Vrij, 2008). The scarcity of
objective cues, however, makes the judgment task of coders error prone. People are
generally not good at accurately reporting what cues they used in making judgments. Their
assessments may not be completely based on self-reported cues but might rather be based on
intuitive and implicit cognitive processes of which they may not be consciously aware
(Hartwig and Bond, 2011). This lack of accurate reporting could be corroborated with an
external measure of their behavior, i.e., through eye tracking (Granhag et al., 2015). Eye
tracking of elements that lie-catchers looked at, but failed to report in their decision making,
could shed some light onto elements that are in the realms of implicit decision making.
Eye tracking
Eye tracking refers to a technique whereby a viewer’s eye movements are measured
and the focus of eye gaze is captured so that the researcher knows where the person is
looking at any given time. While the early application of this technique involved very
invasive methods, advances in technology have enabled more unobtrusive approaches.
Today, most commercially available eye tracking systems use a video-based corneal
reflection method to measure point-of-regard of a viewer (Duchowski, 2007). Utilizing the
information from both the center of the pupil and corneal reflection, this method allows the
researcher to disassociate eye movements from the head movements (Duchowski, 2003;
Jacob and Karn, 2003).
Studying eye movement data has given researchers an insight into the viewers’
problem solving, reasoning, mental imagery, and search strategies (Poole and Ball, 2006).
marketing, medicine, and other disciplines, as well as in the commercial sector (Poole and
Ball, 2006). The main measurements used in eye tracking research are gaze fixations, which
are moments when eyes are relatively stable and associated with taking in information, and
saccades, quick eye movements between fixations. Because information is believed to be
processed only during fixations, most information produced from eye tracking is about
fixations (Djamasbi, 2014). Eye tracking systems also provide other metrics, such as pupil
size and blink rates. Eye tracking provides objective information about the viewer’s gaze
behavior, without having to rely on self-reported information. This is important, because
previous research has demonstrated that the actual behavior of participants may differ from
self-reporting (Bernard et al., 1984; Eysenbach and Köhler, 2002).
Fixation data can also be analyzed based on a specific targeted area(s) of research
interest. This is achieved by identifying specific regions known as areas of interest (AOIs).
Different types of fixation data can be used to investigate a user’s behavior over an AOI,
including fixation duration, fixation frequency, time to first fixation on AOI, percentage of
viewers, and other metrics (Djamasbi, 2014; Poole and Ball, 2006). Additionally, AOI
analysis helps reduce the size and complexity of eye movement protocols significantly
(Salvucci, 1999). Identifying various AOIs allows comparing and contrasting regional data
quantitatively and drawing inferences as to what area was more noticeable, or more
important, to the viewer in making an assessment (Cyr and Head, 2013; Poole and Ball,
2006). In a similar fashion, viewer behavior under varying media could be contrasted and
analyzed. We can quantitatively compare whether viewers’ foci vary when viewing a video
getting an objective record of what people are looking at when viewing video, text, or other
media, as well as for tapping into veracity judges’ viewing behavior.
Because of the benefits of eye tracking technology mentioned above, several studies
in deception detection research have used this technique. Pak and Zhou investigated the eye
gazing behaviors of deceivers in an online video chatting mock dating experiment (Pak and
Zhou, 2013). They used gaze fixation data on AOIs and found that deceivers fixated less on
their communication partner, compared to honest participants. They also found that deceivers
averted their gaze more during deception than while telling the truth. A different group of
researchers sought to use eye tracking technology as a potential sensor within an automated
screening paradigm (Derrick et al., 2010 2010). Applying the Guilty Knowledge Test in an
eye tracking environment and based on the memory assessments of participants, the study
asked some participants to make a mock explosive device and sought to investigate if the
gaze behavior of those who built the device would be different from those who did not build
it when the device was altered. The results revealed that the participants that built the mock
bomb gazed longer at the altered part of the device. In this study, the eye tracking technology
helped to correctly classify all those who knew information about the “proper” image of the
mock explosive device from those who did not.
One of the topics in deception detection research is whether there are experts in
deception detection. While Bond and DePaulo suggested there were no differences between
lay people and experts in accurately differentiating lies from truth (Bond and DePaulo,
2008), others found some empirical evidence that experts did better than lay people
(O'Sullivan and Ekman, 2004). Bond used eye tracking to find out whether experts did better
both students (lay people) and law enforcement personnel (experts). Those individuals who
scored 80% accuracy rate or higher in detecting truth and deception were invited for the
second study, and this time their eye movements were recorded and analyzed with eye
tracking. Only two people continued to differentiate accurately above 80% in the second
study. Interestingly, the gaze fixation data showed that while one expert focused on face
areas, the other expert looked more at arm/torso areas when making decisions.
In another study that applied eye tracking technology to detect indicators of
deception, researchers investigated senders’ lookup patterns and pupil dilation in
sender-receiver games that involve truth telling and deception (Wang et al., 2010 2010). They used
eye tracking data as a supplement to economic analysis of choices. While senders were not
instructed to deceive the receivers, the senders had an incentive to exaggerate the truth. The
authors used pupil dilation as an indicator of deception based on the premise that such
dilations are associated with stress and cognitive load. In another study, a group of
researchers investigated pupil responses and reading behavior of participants when they were
lying vs when they were honest (Cook et al., 2012). The deceivers in this study had increased
pupil responses and took less time to read deceptive statements than honest statements.
As mentioned in our discussion about the eye tracking methodology, this approach
gives an objective insight into what veracity judges look at to determine the sender’s
credibility. It allows the researcher to designate areas of interest and quantitatively compare
fixation durations and frequencies of fixations on such areas and to analyze foci shifts
between these areas. Moreover, researches may observe other behavioral cues that judges
methods are starting to be adopted in deception detection research and promise to generate
additional insight into this topic.
Research Method
Pilot study
Seven participants (1 female), ranging in age from 19 to 35, participated in the pilot
experiment. Participants were recruited through an oral announcement made in an MIS class
offered in a business college at a large Midwestern university. During the recruitment, the
principal investigator explained the purpose and the general overview of the study. The
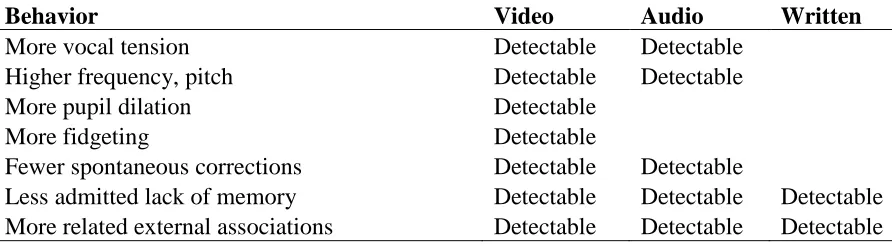
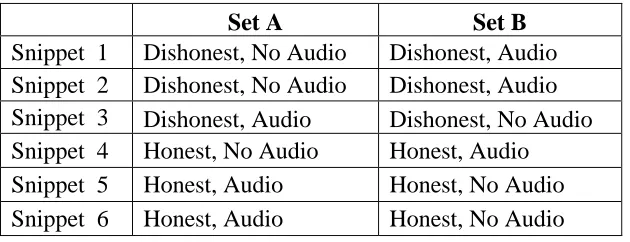
compensation was $10 per participant. The participants in the pilot study watched 6 video
snippets, half honest and the other half dishonest. Half of the videos had sound, and the other
half did not. Two stimulus sets, comprised of six unique snippets, were created (Table 2-2).
Participants were randomly assigned to one of two sets. Both stimulus sets included all six
snippets; however, snippets in sets varied by whether or not they had sound. As shown in
Table 2-2, those snippets that had sound in one set were presented in the other set without
sound. The order in which snippets were presented was randomized to minimize order or
learning effects. This design allowed the comparison of honest snippets with dishonest, as
[image:39.612.90.405.574.695.2]well as snippets with sound with those that did not have sound.
Table 2-2. Distribution of video snippets in two stimulus sets for pilot study
Set A Set B
Snippet 1 Dishonest, No Audio Dishonest, Audio
Snippet 2 Dishonest, No Audio Dishonest, Audio
Snippet 3 Dishonest, Audio Dishonest, No Audio
Snippet 4 Honest, No Audio Honest, Audio
Snippet 5 Honest, Audio Honest, No Audio
After a successful completion of the pilot study, the researchers decided to slightly
enhance the design of the study (explained below) and proceeded to the main study.
Main Study Procedure
Participants were recruited through verbal announcements made in multiple classes
offered at the college of business. During the announcements, the principal investigator
explained the purpose of the study and addressed the questions the audience asked. In
addition to providing the instructions on signing up for the experiment, the announcement
indicated that the participants would be paid $10 as compensation. To ease the process, the
participants were instructed to sign up for the study through a web link, which indicated all
possible time slots and dates the study sessions were offered. Those who signed up were
emailed the day before their scheduled appointment and reminded of their appointment. The
email included information about the location of the lab and a reminder not to wear mascara
or artificial eye lashes. Forty eight university students were recruited in total, however, for
various reasons (e.g., too long eye lashes, eye shapes, pupil size, etc.) the eye movements of
6 participants could not be calibrated. These prospective participants were paid $10 and were
let go from the study. Table 2-3 depicts information about the participants who remained in
[image:40.612.89.296.577.693.2]the study.
Table 2-3. Demographic information
Frequency Percent
Gender
Age
Male 28 66.7%
Female 14 33.3%
42 100.0%
18-24 38 90.5%
25-34 4 9.5%
The research experiment was a 2 x 2 repeated measures, within and between subjects
design, varying experimental condition (deception and truth) and medium (audio-visual and
video only). Each experimental session was completed in a single event with one participant
per session. The experimental sessions were designed to last no more than 1 hour, and most
sessions were completed in 30 - 40 minutes.
Participants began by completing an informed consent form. Next, they were
instructed about the overall procedure. After a researcher answered any questions participants
had, a participant was seated in front of a 22” monitor with an eye-tracking system mounted
underneath, providing unobtrusive eye-tracking. The eye-tracking system used in the study
was SensoMotoric Instruments (SMI) RED 250 eye tracking system, which records eye data
at 250 Hz frequency (i.e., 250 times per second) and allows the capture of participants’ eye
movements and gaze in remote, contact-free setup, while allowing for free head movement.
The system allows the capture of eye movement data even with participants wearing glasses
or contact lenses.
Each eye tracking session started with gaze calibration and subsequent validation of
calibration. To calibrate gazes properly, this process involved adjustments of participants’
chair forward/backwards or upwards/downwards to find the best position for the device to
capture the event. In the adjoining room, the principal investigator ran the iViewX software,
which runs the calibration, validation, and recording of the experimental session. All
validation results of the calibration sessions were in the desired range.
The experimental session was comprised of two parts: a practice task and the main
experimental task. The practice task was designed to make sure participants were
After the researcher confirmed a participant did not have any questions and understood the
task fully, the participant proceeded to complete the main task. Each participant was
randomly assigned to one of the six stimuli sets described below. Operating the eye tracking
software and running all experimental sessions and instructing participants was performed by
the principal investigator. All study sessions were run by the same person. For both practice
and main tasks, the participants were told that there was no time limit for completing the
tasks.
The practice task and the main experimental task involved asking students to watch a
number of video snippets. The snippets were recorded interviews of undergraduate students
and were originally created for a different study. The interviewees in the videos had willingly
enhanced a scholarship application and were then asked to defend the embellished
application in an interview. Deception was determined by comparing interviewees’ actual
résumés with enhanced applications. The interviewees are truthful in two of the four selected
videos, and deceptive in the other two.
The resulting set of video stimuli included two females (one black female) and two
males (both white). The people in the honest stimuli were the white female and a white male,
and the people who delivered the deceptive message where the black female and white male.
To eliminate the possibility that the veracity judges might assess the credibility of the people
in the video stimuli based on the sender’s gender or race, a one-way between subjects
analysis of variance was conducted. The analysis compared the effect of “actors” on the
veracity assessment in honest and deceptive conditions. There was a significant effect of
actor on veracity assessment at the p<.05 level for the two conditions [F(1, 164) = 11.448,
male, both white (mean difference=0.238, se=0.332, p=1.0), between honest (white female)
and deceptive (black female) senders (mean difference=0.571, se=0.332, p=0.523), and
between honest (white male) and deceptive (black female) senders (mean difference=0.810,
se=0.332, p=0.095). The significant mean differences were between the deceptive (white
male) sender and all other senders in video stimuli. He was assessed as the least honest
among the four senders. The results of our tests indicate that the veracity judges did not
demonstrate any racial or gender bias in their assessment.
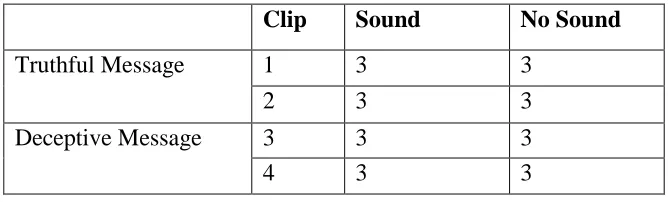
We created four additional new video snippets from these videos by removing sound
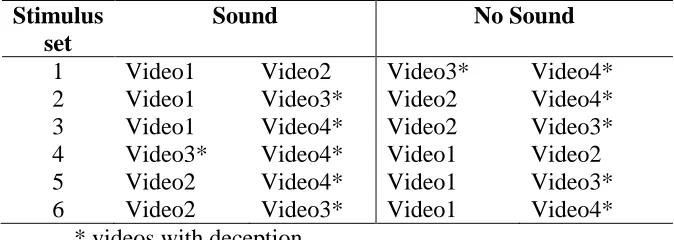
from them. Of these eight video snippets, we created six stimulus sets shown in Table 2-5.
The arrangement in stimuli sets is organized in such a way that each study participant should
see four videos, half with sound and half without sound, half with truthful and the other half
with deceptive statements. Moreover, participants should not be assigned to treatments
whereby they see the same interviewee with sound and later without sound, i.e., they should
assess each interviewee only once. While 16 variations of four stimulus combinations sets are
possible to arrange (Table 2-4), our design necessitated that each set include exactly two
honest and exactly two dishonest videos, while exactly two of those had sound and two did
[image:43.612.87.543.580.657.2]not.
Table 2-4. Stimulus sets selected
Clip 1 2 3 4 5 6 7 8 9 10 11 12 13 14 15 16
Honest Video1 S N S N S N S N S N S N S N S N
Honest Video2 S S N N S S N N S S N N S S N N
Deception Video1 S S S S N N N N S S S S N N N N