maintenance of a vacuum. Vacuum pumps are, in gen-eral, not amenable to miniaturization, since they must possess the physical means to transport molecules from inside the system to the outside environment. The only restriction is the insistence on maintaining vacu-um, with the assumption that many samples will be analysed by the same mass spectrometer. If a miniatur-ized mass spectrometer has a total evacuated volume of 1 mL (not outside the reasonable scale), then a va-cuum reservoir of 100 mL sufRces for pumping by virtue of expansion. Essentially the vacuum is a rechar-geable resource. Removing of the vacuum hardware as a physical limitation to the size of the mass spectro-meter will be a genuine innovation in theReld. Hope-fully, this same overview written ten years from now will document the applications of new miniaturized chromatography}mass spectrometry systems.
See Colour Plate 12.
Further Reading
Brakstad F (1995)Chemometrics and Intelligent Laborat-ory Systems29(2): 157}176.
Cole RB (ed.) (1997)Electrospray Ionization Mass Spectro-metry: Fundamentals, Instrumentation, and Applica-tions. New York: Wiley-Interscience.
Demir C and Brereton RG (1997) Calibration of gas chromatography}mass spectrometry of two-component
mixtures using univariate regression and two- and three-way partial least squares.Analyst122: 631}638.
Demir C, Hindmarch R and Brereton RG (1996) Procrustes analysis for the determination of number of signiRcant masses in gas chromatography}mass spectrometry.
Analyst121: 1443}1449.
Harrison AG (1992) Chemical Ionization Mass Spectro-metry, 2nd edn. Boca Raton: CRC Press.
Hillenkamp F, Karas M, Beavis RC and Chair BT (1991) Matrix-assisted laser desorption/ionization mass spec-trometry of biopolymers. Analytical Chemistry 63: 1193A}1203A.
Karjalainen EJ and Karjalainen UP (1996)Data Analysis for Hyphenated Techniques. Amsterdam: Elsevier Science. Martinsen DP and Song BH (1985) Mass Spectrometry
Reviews4(4): 461}490.
Owens KG (1992)Applied Spectroscopy Reviews 27(1): 1}49.
Smith RD, Olivares JA, Nguyen NT and Udseth HR (1998)
Analytical Chemistry40: 436}441.
Vairamani M, Mirza UA and Srinivas R (1990)Mass Spec-trometry Reviews9(2): 235}258.
Van der Greef J and Niessen WMA (1992) Int. J.Mass Spectrom.Ion Proc. 118}119: 857}873.
Zenobi R and Knochenmuss R (1999)Mass Spectrometry Reviews17: 337}336.
Zhang Z and McElvain JS (1999) Optimizing spectroscopic signal-to-noise ratio in analysis of data collected by a chromatographic/spectroscopic system. Analytical Chemistry71(1): 39}45.
MEMBRANE SEPARATION
R. W. Baker, Membrane Technology & Research Inc. (MTR), Menlo Park, CA, USA
Copyright^ 2000 Academic Press
Introduction
Since the 1970s industrial membrane separation tech-nology has developed into a US$1}2 billion per year business. The market is fragmented, but can be divided into six principal industrial process areas: microRltration, ultraRltration, reverse osmosis, elec-trodialysis, gas separation and pervaporation. Dialy-sis, another membrane separation technique, is lim-ited to two biomedical processes, haemodialysis
(arti-Rcial kidneys) and blood oxygenators (artiRcial lungs). The market for these two biomedical applica-tions is another US$2;109 per year. Further mem-brane separation applications, including memmem-brane contactors, membrane reactors and coupled and facil-itated transport, are under development. Although
similar membranes and membrane module designs are used in all of these process areas, the ways by which the separations are performed and the process applications are very different. A brief overview of each process is given here; more detailed descrip-tions of the individual processes are given elsewhere in the encyclopedia.
History
By the 1930s, microporous membranes were produc-ed commercially on a small scale. The Rrst ion ex-change membranes were made at about the same time; these were used by Teorell, Meyer and Seivers to develop their theory of ion transport. This work led eventually to the development of electrodialysis.
By the 1960s, therefore, the elements of modern membrane science had been developed, but mem-branes were only used in laboratories and in a few small, specialized industrial applications. There was no signiRcant membrane industry, and total sales for all applications probably did not exceed US$10 mil-lion. Membrane processes suffered from three problems that prohibited their widespread use: they were too slow, too expensive and too unselective. Partial solutions to each of these problems have since been developed, and sales of membranes and mem-brane separation equipment have grown several hun-dred-fold. Currently, several tens of millions of square metres of membranes are produced each year, and a membrane industry has been created.
The problem of slow permeation rates through membranes was largely overcome in the late 1960s and early 1970s by the development of imperfection-free ultrathin membranes. These membranes are an-isotropic structures and consist of a thin selective surfaceRlm supported by a much thicker micropor-ous substrate to provide mechanical strength. Because the selective surface Rlm is very thin, these mem-branes have highSuxes.
The problem of packing a large membrane area into a low-cost module has also been solved since the 1980s. The earliest module designs were plate-and-frame or tubular units similar to conventional heat exchangers. These designs are still used in some pro-cesses, such as ultraRltration, in which the ability to clean fouling deposits from the membrane surface is important. However, the cost of both designs is rela-tively high, and in most processes they have been displaced by capillary, hollow-Rne-Rbre and spiral-wound module designs.
The problem of low selectivity remains one of the principal limitations of membrane processes. No gen-eral solution has been found, although substantial improvements have been made since the 1950s.
Ultrathin Membranes
The Rrst useful ultrathin membranes were cellulose acetate reverse osmosis membranes produced by Loeb and Sourirajan, two researchers at the Univer-sity of California at Los Angeles. The development of these thin, and hence highSux, membranes led to the reverse osmosis industry in the 1960s. In the Loeb}Sourirajan technique, a solution containing
ap-proximately 20% polymer is cast as a thin Rlm on a nonwoven fabric web and is then precipitated by immersion in a bath of water. The water very rapidly precipitates the top surface of the castRlm, forming the selective skin. This skin then slows down the entry of water into the underlying polymer solution, which precipitates much more slowly, forming a more por-ous substructure. A scanning electron micrograph showing the porous substructure and the selective skin of a Loeb}Sourirajan membrane is shown in Figure 1. The selective layer thickness is typically less than 0.2m.
About one-third of the reverse osmosis and almost all ultraRltration membranes currently produced are made by the Loeb}Sourirajan technique. This type of membrane is also widely used in gas separation pro-cesses.
In recent years, new approaches have been de-veloped to produce anisotropic membranes with even thinner selective layers than those made by the Loeb}Sourirajan method. Selective layers only a few tens of nanometers in thickness, and effectively free of imperfections, have been claimed for these so-called thin-Rlm composite membranes. Thin-Rlm composite membranes can be made by a number of methods, of which two are particularly important: coating with a dilute polymer solution and interfacial polymeriz-ation. In the coating method, which was developed
Rrst, a very dilute solution of the polymer is prepared in a volatile solvent, such as hexane. A thinRlm of this polymer solution is deposited on the microporous support surface by immersing and then slowly with-drawing the support from the solution. As the solvent evaporates, an extremely thin polymerRlm is left be-hind. This technique is used to manufacture ultrathin membranes for gas separation and pervaporation.
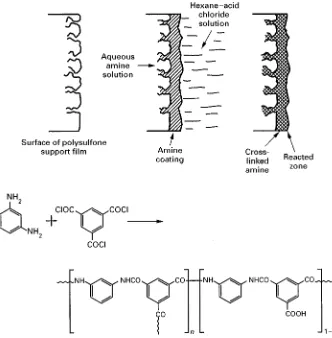
The second important method for preparing com-posite membranes is interfacial polymerization. In this method, an aqueous solution of a reactive mono-mer, such as a diamine, is deposited in the pores of a microporous support membrane. The membrane is then immersed in a water-immiscible solvent solution containing a multivalent reactant, such as a triacid chloride in hexane, which causes the monomer to polymerize and cross-link. Polymerization is conRned to the interface of the two immiscible solutions, so a thin, highly selective layer is formed. The procedure is illustrated in Figure 2. The interfacial polymeriz-ation technique is used to produce most of today’s reverse osmosis membranes.
Membrane Modules
Figure 2 Preparation of ultrathin composite membranes by reaction of an amine dissolved in water and an acid chloride dissolved in hexane. The chemistry shown is widely used to prepare seawater desalination reverse osmosis membranes. (Reproduced with permission from Roselle LTet al. (1977). In: SouriraHjan (ed.)Reverse Osmosis and Synthetic Membranes.)
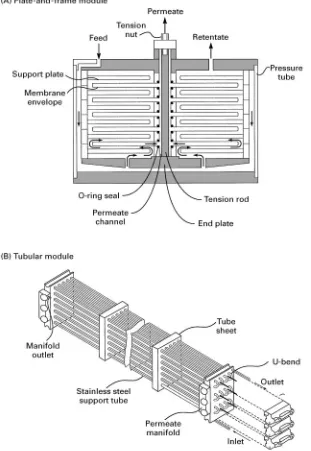
Figure 3 Schematic of a reverse osmosis plate-and-frame module (A) and a tubular ultrafiltration membrane module (B). These two module designs were used in the first large industrial membrane systems but are now limited to a few niche applications.
in Figures 3 and 4. In the plate-and-frame design shown in Figure 3A a series of membrane discs separ-ated by spacers and support plates are held between two end plates connected by a tension rod. The ge-ometry of the plates is such that solution entering one end of the module passes sequentially over all the membrane area. Solution that permeates the mem-brane is collected in a permeate collection channel. Tubular modules shown in Figure 3B consist of a por-ous support tube, which is coated on the inside sur-face with the selective membrane. The porous sup-port tube nests inside steel or strong plastic tubes that
can support the applied pressure. Each tube is be-tween 0.5 and 2 cm in diameter and up toRve tubes can be housed in a single support tube. Tubular mod-ules are now only used in ultraRltration applications for which goodSow distribution across the membrane surface with no stagnant areas is required to control membrane fouling. In this application up to 20 tubes are connected in series as shown in Figure 3B.
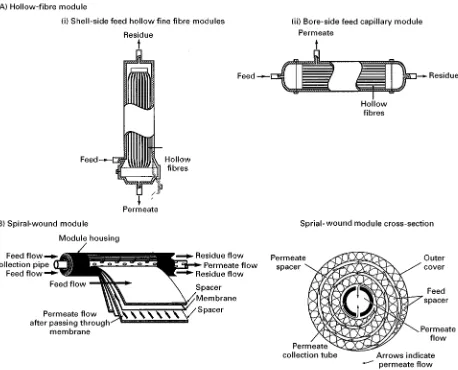
Figure 4 Schematic illustrating hollow-fibre (A) and spiral-wound (B) membrane modules. Most large-scale membrane processes use one of the designs shown.
modules, which are much less expensive to produce per square metre of membrane area. Capillary and hollow-Rne-Rbre membranes are quite similar, dif-fering principally in the diameter of the Rbre used. Both types are produced by a spinning process much like conventionalRbre spinning. As a result, the cost of producing the membrane per square metre is quite low. Most of the cost of producing hollow-Rbres is incurred in theRbre potting operation whenRbres are mounted inside the module shell. Currently, in capil-lary modules, the feedSuid circulates through theRbre lumen (bore side) as shown in Figure 4A. In
hollow-Rbre modules, the feedSuid circulates around the outer surface (shell side) of theRbres as shown in Figure 4B. Spiral-wound modules were originally developed for reverse osmosis applications but are now used in ultraRltration and gas separation processes as well. This work, carried out by Fluid Systems Inc. under sponsorship of the OfRce of Saline Water
(later the OfRce of Water Research and Techno-logy), resulted in a number of spiral-wound module designs. The design shown in Figure 4 is the most common, consisting of a membrane envelope wound around a perforated central collection tube. The mod-ule is placed inside a pressure vessel, and feed solution is circulated axially down the module across the mem-brane envelope. A portion of the feed permeates into the membrane envelope, spirals towards the centre of the module and exits through the collection tube.
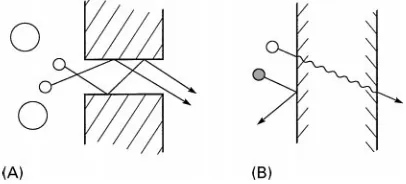
Figure 5 Schematic illustrating the two principal types of mem-brane separation mechanisms. (A) Microporous memmem-branes sep-arate by molecular filtration. (B) Dense solution-diffusion mem-branes separate because of differences in the solubility and mobility of permeant in the membrane material.
Membrane Selectivity
Improving membrane selectivity is still an area of active research. In some applications such as desalina-tion of water, progress has been made, and mem-branes have the required selectivity to compete with other processes such as distillation. The Rrst reverse osmosis membranes had salt rejections of approxim-ately 96}97% and could only produce potable water from low concentration brackish water feeds. The best current membranes have salt rejections of up to 99.7% and can produce potable water from sea-water. Further improvements in membrane selectivity are not required in this application.
In other applications, the low selectivity of membranes remains a problem. UltraRltration mem-branes, for example, cannot separate dissolved macromolecules, such as albumin (Mr 60 000) and
-globulin (Mr150 000). Therefore, ultraRltration is limited to the separation of very large molecules from very small ones, such as macromolecules from dis-solved micro-ions. Selectivity problems also exist in electrodialysis, gas separation and pervaporation.
Mechanism of Membrane Separation
The property of membranes used in separation pro-cesses is their ability to control the permeation of different species. Most membranes fall into one of the two broad categories illustrated inFigure 5. In microporous membranes, permeants are separated by pressure-drivenSow through tiny pores. A separation is achieved between different permeants because one of the permeants is excluded (Rltered) from some of the pores through which the smaller permeants move. In solution-diffusion membranes the membrane material is a dense polymer layer and contains no Rxed pores. Permeants dissolve in the membrane material as in a liquid and then dif-fuse through the membrane down a concentration gradient. Separation of different permeants
oc-curs because of differences in the solubility of the permeant in the membrane material and the rate at which the permeant diffuses through the mem-brane.
The difference between the pore-Sow and the solution-diffusion mechanisms lies in the relative size and lifetime of pores in the membrane. In dense polymeric solution-diffusion membranes, no per-manent pores exist. However, tiny free volume ele-ments, a few tenths of a nanometre in diameter, exist between the polymer chains from which the mem-brane is made. These free-volume elements are pres-ent as statisticalSuctuations that appear and disap-pear on a timescale only slightly slower than the motion of molecules traversing the membrane. Per-meating molecules diffuse from free-volume ele-ment to free-volume eleele-ment at a rate determined by the thermal motion of the polymer chains from which the membrane is made. In contrast, in a pore-Sow membrane the pores areRxed and do notSuctuate in position or size on the timescale of molecular motion. The larger the individual free-volume elements are, the more likely they are to be present long enough to produce pore-Sow characteristics in the membrane. As a rule of thumb the transition between permanent (pore-Sow) and transient (solution-diffusion) pores appears to be in the range 0.5}1.0 nm diameter. This means that the processes of gas separation, reverse osmosis and pervaporation, all of which involve sep-aration of permeants with molecular weights of less than 200, use solution-diffusion membranes. On the other hand, microRltration and ultraRltration, which involve separation of macromolecular or collo-idal material, useRnely microporous pore-Sow mem-branes.
Commercial Membrane Separation
Processes
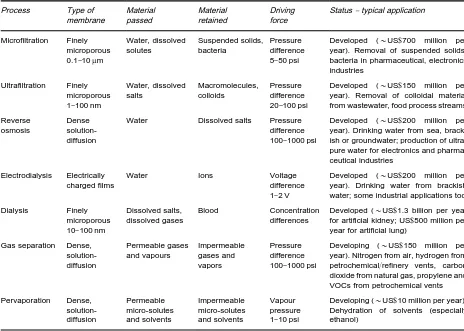
The current status of membrane separation techno-logy is summarized inTable 1. There are seven com-mercial membrane separation processes. Of these, the
Table 1 Summary of the established membrane separation technologies
Process Type of membrane Material passed Material retained Driving force
Status}typical application
Microfiltration Finely microporous 0.1}10m
Water, dissolved solutes Suspended solids, bacteria Pressure difference 5}50 psi
Developed (&US$700 million per year). Removal of suspended solids, bacteria in pharmaceutical, electronics industries
Ultrafiltration Finely microporous 1}100 nm
Water, dissolved salts Macromolecules, colloids Pressure difference 20}100 psi
Developed (&US$150 million per year). Removal of colloidal material from wastewater, food process streams
Reverse osmosis
Dense solution-diffusion
Water Dissolved salts Pressure difference 100}1000 psi
Developed (&US$200 million per year). Drinking water from sea, brack-ish or groundwater; production of ultra-pure water for electronics and pharma-ceutical industries
Electrodialysis Electrically charged films
Water Ions Voltage
difference 1}2 V
Developed (&US$200 million per year). Drinking water from brackish water; some industrial applications too
Dialysis Finely microporous 10}100 nm
Dissolved salts, dissolved gases
Blood Concentration differences
Developed (&US$1.3 billion per year for artificial kidney; US$500 million per year for artificial lung)
Gas separation Dense, solution-diffusion Permeable gases and vapours Impermeable gases and vapors Pressure difference 100}1000 psi
Developing (&US$150 million per year). Nitrogen from air, hydrogen from petrochemical/refinery vents, carbon dioxide from natural gas, propylene and VOCs from petrochemical vents
Pervaporation Dense, solution-diffusion Permeable micro-solutes and solvents Impermeable micro-solutes and solvents Vapour pressure 1}10 psi
Developing (&US$10 million per year). Dehydration of solvents (especially ethanol)
the laboratory or early commercial stage. In the fol-lowing sections each of these membrane technology areas is described brieSy. More detailed descriptions of the more important processes are given elsewhere in the encyclopedia.
Micro\ltration
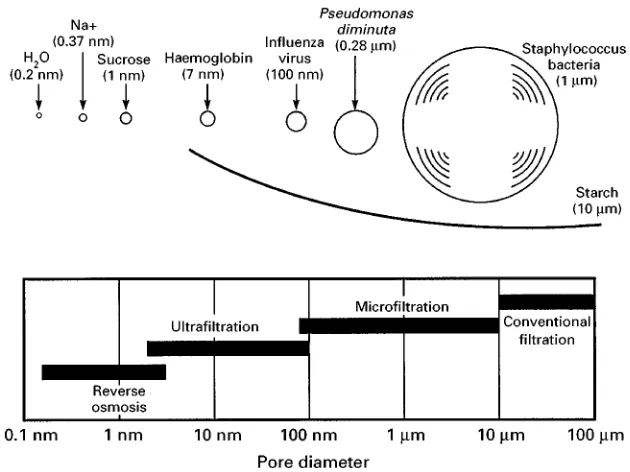
The process MicroRltration, ultraRltration and re-verse osmosis are related membrane processes dif-fering in the size of the material retained by the membrane. As shown in Figure 6, reverse osmosis membranes can generally separate dissolved micro-solutes with a molecular weight below 500 by a solu-tion-diffusion mechanism. When the molecular weight of the solute exceeds 500, the separation mechanism of the membrane is molecularRltration, in which separation characteristics are determined by the size of the particles in the mixture and the dia-meter of the pores in the membrane. By convention, membranes having pore sizes up to approximately 0.1m in diameter are considered to be ultraRltration membranes. MicroRltration membranes are those with pore diameters in the range of 0.1 to 10m.
Above 10m the separation medium is considered to be a conventionalRlter.
UltraRltration/microRltration membranes fall into two broad categories: screen membrane and depth membraneRlters, as shown inFigure 7. ScreenRlters are anisotropic with small surface pores on a more open substructure. The surface pores in screen mem-brane Rlters are uniform and show a sharp cutoff between material that is completely retained by the membrane and material that penetrates the brane. Retained material accumulates on the mem-brane surface. Depth memmem-braneRlters have a much wider distribution of pore sizes and usually have a more diffuse cutoff than screen membrane
Figure 6 Pore sizes of reverse osmosis, ultrafiltration, microfiltration and conventional filtration membranes.
Figure 7 Separation of particulates can take place at the membrane surface according to a screen filtration mechanism (A) or in the interior of the membrane by a capture mechanism as in depth filtration (B).
feed solution permeates the membrane as a clean
Rltrate. The remaining solution containing the rejec-ted material is collecrejec-ted as a concentrarejec-ted residue.
Depth Rlters are usually used in microRltration applications. The surface membrane pores can be quite large, on the order of 1}10m in diameter, but many smaller restrictions occur in the interior of the membrane. This means that bacteria or virus particles as small as 0.2m in diameter are completely pre-vented from penetrating the membrane. MicroR ltra-tion membranes are usually used as an in-line Rlter. All of the feed solution is forced through the mem-brane by an applied pressure. Retained particles are collected on or in the membrane.
The lifetime of microRltration membranes is often improved by using a more open preRlter membrane
directly before theRnal membrane. PreRlters are not absoluteRlters, but trap most of the very large partic-ulates and many of the smaller ones before the feed solution reaches the Rner membrane Rlter. This re-duces the particle load that theRner membrane must handle, and thus increases its useful life.
Applications The primary market for microR ltra-tion membranes is disposable cartridges for sterile
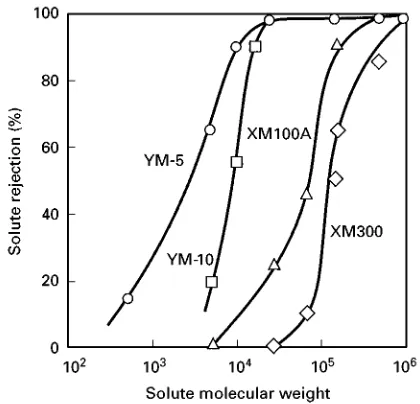
[image:8.568.58.522.522.680.2]Figure 8 Molecular weight cuttoff curves of various ultrafiltra-tion membranes. (Amicon Corporaultrafiltra-tion trade literature.)
Figure 9 Schematic of ultrafiltration illustrating the dynamic process of deposition and removal of particulate and colloidal material from the surface of the membrane.
bacteria from theRltrate. This process was introduc-ed on a commercial scale in the 1960s. Although not generally accepted at that time, the process has be-come common in recent years.
Ultra\ltration
The process UltraRltration is intermediate between microRltration and reverse osmosis. The most reten-tive ultraRltration membrane has a substantial rejec-tion to microsolutes, such as rafRnose (Mr 504), while the most open ultraRltration membrane will be just able to retain a molecule of relative molecular mass one million. In practice, the distinction between ultraRltration, reverse osmosis and microRltration is vague, and it is possible to prepare membranes cover-ing the entire range of reverse osmosis, ultraRltration and microRltration by making small changes in mem-brane preparation procedures.
Essentially all ultraRltration membranes are screen
Rltration membranes and separate the retained mater-ial because of the small pores in their top surface layer (see Figure 7A). Membranes are characterized by their molecular weight cutoff, which is usually deRned as the molecular weight at which the mem-brane retains more than 95% of the test solute. The deRnition is ambiguous, becauseSexible-backboned, linear molecules can penetrate membranes more eas-ily than rigid, globular molecules, such as dissolved proteins. In addition, despite the claims of the manu-facturers, no ultraRltration membrane has a perfectly sharp molecular weight cutoff. All membranes contain a range of pore sizes and the passage of molecules through the pores is completely unhindered only for very small molecules. Typical molecular weight cutoff curves for a series of commercial membranes are shown inFigure 8.
UltraRltration systems generally operate at pres-sures of 20}100 psi (140}690 kPa). Osmotic pressure effects are not signiRcant in ultraRltration, and high operating pressures are not required to produce highSuxes. Moreover, because of their porous struc-ture, ultraRltration membranes compact under pres-sures above 100 psi (690 kPa).
The most important problem associated with
ultra-Rltration membranes is surface fouling. The problem is illustrated in Figure 9. Material unable to pass through the membrane accumulates at the surface, forming a solid gel-like Rlm that acts as a barrier to the Sow of permeate through the membrane. The thickness of the fouling Rlm is controlled by the sweeping action of the feed solution past the mem-brane surface. This circulating Sow of solution hydrodynamically scrubs the membrane surface, con-tinuously removing the surfaceRlm. Thus a balance is
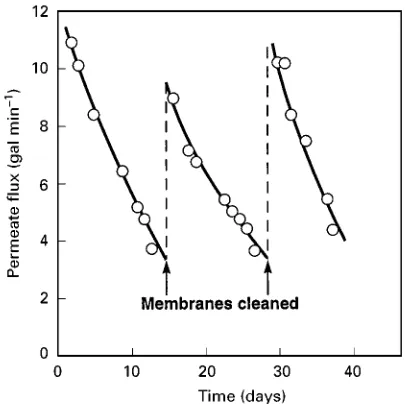
[image:9.568.291.518.381.673.2]Figure 10 Ultrafiltration flux as a function of time for an electro-coat paint latex solution. Fouling causes flux decline in a matter of days. Periodic cleaning is required to maintain high fluxes. solution permeates the membrane; the remaining solution, containing the retained material, is removed as a concentrated residue stream.
If the feed solution circulation rate across the mem-brane surface is increased, the thickness of the fouling layer on the membrane surface decreases, and higher permeateSuxes through the membrane are obtained. However, at some point the increased energy cost involved in recirculating the feed solution offsets the savings produced by the higher membraneSuxes. With highly fouling solutions, energy consumption of 30}100 kWh per 1000 gallons (30}100 MJ m\3) of permeate produced is typical. The resulting electric energy expense represents a large fraction of the oper-ating cost of an ultraRltration plant. Increasing the operating pressure of the membrane system to force more permeate through the membrane is not a viable method of increasing the membraneSux because this only produces a thicker gel layer on the membrane surface so that the Sux remains constant or even declines.
Even when most of the layer of deposited material on the membrane surface is continuously removed, a portion remains and gradually densiRes. This results in decreased permeate Sux through the membrane with time. Periodically, ultraRltration membrane modules are cleaned by washing with a membrane-cleaning solution. This restores theSux to almost its original value, after which theSux begins to decline again. The process is illustrated inFigure 10. Unfor-tunately, cleaning of badly fouled membranes does not completely restore theSux to the starting value so that a proportion of the membraneSux is
permanent-ly lost. This permanent loss results from deposits of fouling material inside the membrane, which cannot be removed even by vigorous cleaning. The fouling material gradually accumulates until even theSux of a freshly cleaned membrane is less than 50% of the original value. At this time, the membrane is due for replacement. A typical ultraRltration membrane life-time is 1}3 years.
Because of membrane fouling, theSux of ultraR l-tration membranes depends highly on the composi-tion of the feed solucomposi-tion and the process operating conditions. In the removal of trace particulates for the preparation of ultrapure water, the feed solution is already clean, andSuxes higher than 50}100 gal per ft2per day (85}170 L per m2per day) are achieved. With more concentrated and contaminated solutions, such as food processing streams, industrial waste-waters, or electrocoat paint wastes, typicalSuxes are 10}30 gal per ft2per day (17}50 L per m2per day).
Applications UltraRltration membranes were ori-ginally developed for the laboratory market and found an application in the concentration and desalt-ing of protein solutions. Later, Abcor and Romicon developed the industrial ultraRltration market. The
Rrst major application was the ultraRltration of elec-trocoat paint. The process is illustrated inFigure 11. In electrocoat paint operations metal parts are im-mersed in a tank containing 15}20% of the paint emulsion. After coating, the piece is removed from the tank and rinsed to remove excess paint. The ultraRltration system removes ionic impurities from the paint tank carried over from earlier operations and provides clean rinse water for the countercurrent rinsing operation. The concentrated paint emulsion is recirculated back to the tank. Tubular and capillary
Rbre membrane modules are generally used in these plants because the feed solution easily fouls the mem-brane. Other large applications of ultraRltration are the concentration of milk whey in the food industry to recover milk proteins and to remove lactose and salts in the membraneRltrate, and the concentration of oil emulsions in the metal Rnishing industry. Al-though some ultraRltration plants treat industrial waste streams, this is not a common application be-cause the process is expensive. The preparation of ultrapure water by ultraRltration for the electronics industry is a newer, but growing, application. Bio-technology applications are, as yet, small.
Figure 11 Flow schematic of an electrocoat paint ultrafiltration system. The ultrafiltration system removes ionic impurities from the paint tank carried over from the chromate/phosphate cleaning steps and provides clean rinse water for the countercurrent rinsing operation.
Figure 12 Osmotic effects across a semipermeable membrane. (Reprinted with permission from Roper and Lightfoot (1995)Journal of Chromatography 702: 3I26, with permission from Elsevier Science.)
Therefore, ultraRltration is limited to the type of high-value streams listed above. Development of more fouling-resistant membranes and better module designs could allow wider use of the process.
Reverse Osmosis
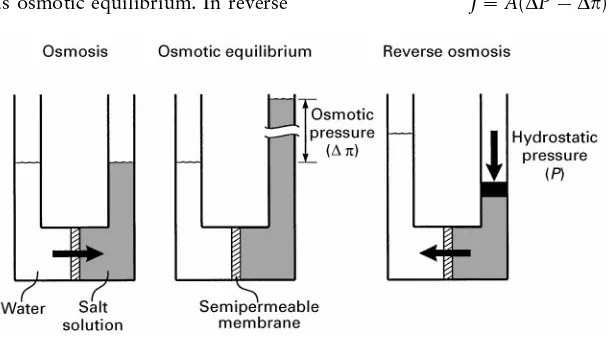
The process The processes of osmosis and reverse osmosis are illustrated inFigure 12. In normal osmo-sis, a membrane is used to separate water from a salt solution. If the membrane is semipermeable, that is, it allows the passage of water but does not pass salt, the small difference in water concentration (salt solu-tion) will cause water toSow into the salt side of the membrane. ThisSow will continue until the hydros-tatic pressure head on the salt solution exactly bal-ances the Sow of water across the membrane. This balance is known as osmotic equilibrium. In reverse
osmosis, a pressure is applied to the salt solution that is even higher than the osmotic pressure of the solu-tion. This applied pressure reverses the osmotic water
Sow, and water Sows from the salt solution to the pure water side of the membrane. Therefore, reverse osmosis is a method of desalting saltwater solutions. Equilibrium osmotic pressures are directly propor-tional to salt concentration and are surprisingly large. For example, the osmotic pressure for sodium chloride is approximately 100 psi (690 kPa) for a 1% salt solution.
Two parameters affect the performance of re-verse osmosis membranes. TheRrst is theSux orSow per unit area per time,J, of water through the mem-brane, usually described by the equation:
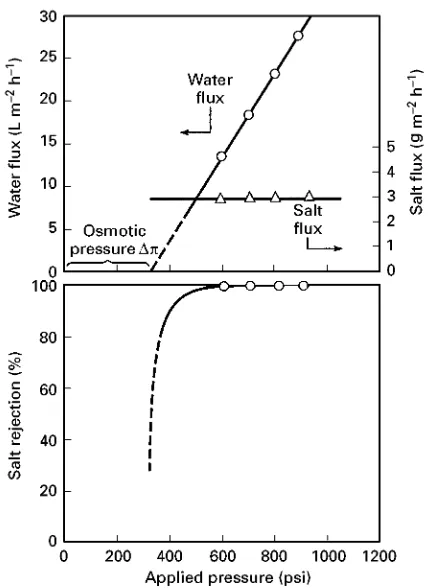
[image:11.568.134.442.514.685.2]Figure 13 Flux and rejection data for a model seawater solu-tion (3.5%sodium chloride) in a good quality reverse osmosis membrane (FilmTec Corp. FT 30 membrane) as a function of pressure. The salt flux, in accordance with eqn [2], is essentially constant and independent of pressure. The water flux, in accord-ance with eqn [1], increases with pressure, and, at zero flux, meets the pressure axis at the osmotic pressure of seawater &350 psi. (Reprinted from Wijmans JG and Baker RW (1995) The solution-diffusion model: a review. Journal of Membrane Science 107: 1}21, with permission of Elsevier Science.) where A is the hydrodynamic water permeability
parameter, P is the pressure difference across the membrane, and is the osmotic pressure dif-ference across the membrane. Thus, once the osmotic pressure of the salt solution has been overcome, the water Sux increases linearly with applied pressure. The saltSux through reverse osmosis membranes,Js, is proportional to the salt concentration differ-ences (C) across the membrane, but is independent of the applied pressure. Thus:
Js"B(C) [2] where B is the salt permeability factor. This means that the performance of reverse osmosis membranes, as measured by the salt rejection, improves as the applied pressure increases. Therefore, reverse osmosis membranes are usually operated at high pressures to obtain the maximum throughput commensurate with reasonable capital and energy costs. With current membranes, operating pressures are usually between 200 (1380) and 800 psi (5520 kPa).
The second parameter that affects membrane performance is the salt passage through the mem-brane. Ideally, the membrane should be completely selective for salt. This is never the case, and a small fraction of the salt passes through the membrane. The fraction that appears in the product is usually mea-sured in terms of the rejection coefRcient of the membrane, deRned as:
R"[(salt concentration in feed
!salt concentration in product)/
salt concentration in feed];100% [3] Thus, a completely selective membrane has a rejec-tion of 100%, whereas a completely nonselective membrane has a rejection of 0%. A typical plot of
Sux and rejection versus operating pressure is shown inFigure 13.
The Rrst successful reverse osmosis membranes were made by Loeb and Sourirajan and had rejections in the range 97}98%. These membranes produced potable water (less than 500 ppm salt) from feed water containing up to 1% salt. This salt concentra-tion is typical of many brackish groundwaters, so these membranes found an immediate application in the desalination of such waters. However, production of potable water from seawater requires a membrane with a salt rejection of greater than 99%. Loeb} Sourirajan cellulose acetate membranes can be
modi-Red to obtain this rejection, but only by reducing membraneSux to uneconomically low values. In the mid-1970s, Du Pont produced improved polyamide hollow-Rbre membranes (the B10 Permeator) which had greater than 99% rejection. At about the same
time, interfacial polymerization composite mem-branes were produced by Cadotte at North Star Re-search. These composite membranes had salt rejec-tions greater than 99%, and subsequent improve-ments have raised these rejections to 99.5}99.8%. Interfacial composite membranes have now become the industry standard; three-quarters of current re-verse osmosis membranes are of this type.
Reverse osmosis membranes are produced in several module conRgurations. Most of the modules used are of the spiral-wound type, which has 80% of the mar-ket. Hollow-Rbre membrane modules are generally limited to seawater reverse osmosis plants. A few plate-and-frame and tubular modules are used in food processing and the treatment of industrial wastewater, which usually contain high levels of suspended solids and require this type of nonfouling module.
Figure 14 Flow schematic of a brackish water reverse osmosis plant. The plant contains seven pressure vessels each containing six membrane modules. The pressure vessels are arranged in a Christmas tree array to maintain a high feed velocity through the modules as treated water is removed in the permeate.
brackish water or seawater. Another 40% are used to produce ultrapure water for electronics, pharmaceut-icals and power generation. The remainder are used in small niche applications such as pollution control and food processing.
Brackish water desalination The salinity of
brack-ish groundwater is usually between 1500 and 5000 mg L\1. The World Health Organization rec-ommends that drinking water should contain less than 500 mg L\1salt, so up to 90% of the salt must be removed from these waters. This is easily achieved by reverse osmosis. A typical processSow scheme is shown in Figure 14. Frequently brackish water is contaminated with suspended solids, soSocculation, sandRltration, and aRnal cartridgeRlter are used to remove these components Rrst. Adjustment of pH and addition of antiscalants may also be necessary to prevent calcium, magnesium or silica precipitating on the membrane as water is removed and the feed becomes more concentrated. The water may also be sterilized by addition of chlorine to prevent bacterial growth on the membrane. Even when these elaborate and costly feed water pretreatment steps are used, some fouling of the membrane still occurs. Therefore, periodically the plant is taken off-line and the membranes are cleaned by circulating a hot cleaning solution. Typical operating pressures for these sys-tems are in the 200}300 psig range. Plant capital costs are in the range US$1.00}2.00 per gal per day (plant) capacity, and operating costs are about
US$1}2 per 1000 gal of treated water produced. Well-maintained plants have useful membrane life-times of 3}5 years.
Seawater desalination Seawater contains about
3.5% dissolved salt, which means membranes with salt rejections above 99.3% are required to produce potable water. Today’s membranes can easily meet these targets, and many seawater desalination plants are now operating. Because of the high osmotic pres-sure of seawater (&350 psi (2415 kPa)) these plants operate at pressures of 800}1000 psi (5520} 6900 kPa). Typical seawater reverse osmosis plants have a capital cost of US$4}5 gal per day capacity and produce desalted water for a cost of about US$5 per 1000 gal of product. These costs mean the process is most competitive for systems below 10 million gal per day capacity. Above this range economies of scale tend to favour multi-effect evaporation plants often built to use the waste heat from electric power stations.
Ultrapure water With the development of the
Figure 15 Schematic diagram of a plate-and-frame electrodialysis stack. Alternating cation- and anion-permeable membranes are arranged in a stack of up to 100 cell pairs.
water. Carbon adsorption and ion exchange units are used to remove the remaining contaminants.
Electrodialysis
The process Electrodialysis is a process in which electrically charged membranes are used to separate ions from aqueous solutions under the driving force of an electrical potential difference. The process, illustrated in Figure 15, utilizes an electrodialysis stack built on the Rlter press principle. The stack consists of 200}400 alternate cationic and anionic membranes between two electrodes; the aqueous feed solutionSows through the cells between each pair of membranes. When an electrical potential differ-ence is applied between the two electrodes, positively charged cations in the feed solution move toward the cathode. These ions easily pass through the negatively charged cation exchange membranes, but are retained by the positively charged anion exchange membranes. Similarly, negatively charged anions migrate towards the anode, pass through the anion exchange brane and are retained by the cation exchange mem-brane. Because of the arrangement of ion-selective
membranes, the migrating ions become concentrated in each alternate cell in the stack. Thus, ions removed from the aqueous feed solution are concentrated into two separate streams.
Applications
Brackish water Brackish water desalination is the
largest application of electrodialysis. The competitive technologies are ion exchange for very dilute tions (below 500 ppm) and reverse osmosis for solu-tions above 2000 ppm salt. In the 500}2000 ppm range, electrodialysis is almost always the lowest cost process. One advantage of electrodialysis when ap-plied to brackish water desalination is that a large fraction, typically 80}95% of the brackish feed, is recovered as potable water. However, these high re-coveries mean that the concentrated brine stream produced is 5}20 times more concentrated than the feed. Precipitation of insoluble salts in the brine can limit the water recovery.
Figure 16 Flow scheme of a typical electrodialysis process used in a seawater salt concentration plant.
electrodialysis plants have been installed around the world. Modern electrodialysis units are generally fully automated and require only periodic operator attention. This has encouraged installation of many small trailer-mounted plants. However, a number of very large plants with production rates of 10 mil-lion gal per day or more have also been produced.
The power consumption of an electrodialysis plant is directly proportional to the salt concentration in the feed water, and varies from 4 kWh per 1000 gal (4 MJ m\3) for 1000 ppm feed water to 10}15 kWh per 1000 gal (10}15 MJ m\3) for 5000 ppm feed water. About one-quarter to one-third of this power is used to drive the feed water recirculation pumps.
Seawater A second major application of
elec-trodialysis is the production of table salt by concen-tration of seawater. This process is only practised in Japan, which has no other domestic salt supply. The process is heavily subsidized by the government. Total production is approximately 1.2 million tons per year of salt, with more than 500 000 m2of mem-brane used in the plants.
ASow scheme for one such seawater salt-produc-tion plant is shown in Figure 16. A cogeneration power plant produces the power required for the electrodialysis operation, which concentrates the salt in seawater to about 18}20 wt%. Waste steam from
the power plant is then used to concentrate the salt further by evaporation.
Gas Separation
The process The study of gas permeation through membranes has a long history dating back to the work of Thomas Graham in the mid-nineteenth cen-tury. However, theRrst systematic studies with poly-mers of the type used today did not begin until 100 years later.
The mechanism of gas permeation developed in the 1950s and 1960s was the solution-diffusion model. In this model, the rate of diffusion through the polymer membrane is governed by Fick’s law of diffu-sion. For simple gases, it can be shown that Fick’s law leads to the expression
J"Dkp
l [4]
whereJis the membraneSux (cm3(STP)/cm2s),kis the Henry’s law sorption coefRcient linking the concentration of gas in the membrane material to the pressure of the adjacent gas (cm3(STP)/cm Hg),pis the partial difference across the membrane, l is the membrane thickness (cm), andDis the permeant diffusion coefRcient (cm2s\1), a measure of the permeant’s mobility in the membrane. This expres-sion can be further simpliRed to
J"Pp
l [5]
wherePis a permeability, equal to the productDk, and is a measure of the rate at which a particular gas moves through the membrane of a standard thickness (1 cm) under a standard driving pressure (1 cm Hg). The permeability unit, 1;10\10cm3 (STP) cm/ cm2s cm Hg, is called a Barrer, after R.M. Barrer, a pioneer in membrane permeation studies.
A measure of the ability of a membrane to separate two gases (1) and (2) is the ratio of their permeabili-ties, called the membrane selectivity,:
1,2"
P1
P2"
D1
D2;
k1
k2
[6]
Table 2 Membrane gas separation applications
Separation Status
H2/N2, CO, CH4, etc. &500 units installed. Various hydrogen recovery applications in refineries, petrochemical and
ammonia plants
CO2/CH4 &200 units installed, some very large (5000}50 000 scfm) to separate carbon dioxide from
natural gas
N2/air &5000 units installed, most small in the 50}500 scfm range (98}99.5%nitrogen)
Organic solvent vapour/air, N2 &100 units installed. Diverse applications include gasoline vapour recovery at oil terminals,
recovery of monomers from reactor vents
[image:16.568.50.520.603.710.2]H2O/air Many thousands of small modules sold for drying compressed air
Figure 17 Flow scheme of (A) a one-stage and (B) a two-stage membrane gas separation system for the separation of carbon dioxide from natural gas.
coefRcient of gases increases with the condensa-bility of the gas. Normally, the sorption coefR c-ient also correlates with molecular diameter, larger molecules being more condensable than smaller mol-ecules, and the Henry’s law sorption coefRcient increases with increasing permeant diameter. Thus, the effect of increasing permeant size on per-meability is a balance between the opposing ef-fects of diffusion coefRcient, which decreases with increasing size, and solubility, which increases with increasing size. This balance determines the selectivity of a membrane for any pair of gases and is a function of the membrane material.
In glassy, rigid polymers such as polysulfone or polyimides, permeant diffusion coefRcients are most important. Therefore, these polymers preferen-tially permeate the small, noncondensable gases, hy-drogen, nitrogen and methane, over the larger, con-densable gases, propane and butane. On the other hand, in rubbery polymer such as silicone rub-ber (polydimethylsiloxane), permeant solubility
coef-Rcients are most important. Therefore, these poly-mers preferentially permeate the larger, more con-densable gases, propane and butane, over the smaller, noncondensable gases, hydrogen, nitrogen and methane.
Applications The principal developed gas separ-ation processes are listed inTable 2. TheRrst large-scale commercial application of gas separation was the separation of hydrogen from nitrogen in ammo-nia purge gas streams. The process, launched in 1980 by Permea, then a Division of Monsanto, was fol-lowed by a number of similar applications, such as hydrogen/methane separation in reRnery off-gases and hydrogen/carbon monoxide adjustment in oxo-chemical synthetic plants.
Following Permea’s success, several US companies produced membrane systems to treat natural gas streams, particularly to remove carbon dioxide. The goal is to produce a stream containing less than 2% carbon dioxide to meet the national pipeline
speci-Rcations and a permeate enriched in carbon dioxide
Figure 18 In the pervaporation process, a liquid contacts the membrane, which preferentially permeates one of the liquid com-ponents as a vapour. The vapour, enriched in the more per-meable component, is cooled and condensed, spontaneously generating a vacuum that drives the process.
Figure 19 Fraction of benzene in permeate as a function of feed mixture composition for pervaporation at the reflux temper-ature of a binary benzene/cyclohexane mixture. (Reprinted with permission fromIndustrial and Engineering Chemical Research 22 (1983) 313. Copyright 1983 American Chemical Society.) the years and more than 200 natural gas treatment
plants have now been installed}some quite large. By far the largest gas separation process in current use is the production of nitrogen from air. TheRrst membranes used for this process were based on poly-sulfone, poly(trimethylpentane) and ethyl cellulose. These polymer materials had oxygen/nitrogen selec-tivities of 4 to 5, and the economics of the process were marginal. The second-generation materials now used have selectivities in the range 6 to 7. With these membranes, the economics of nitrogen production from air are very favourable, especially for small plants producing 50}500 scfm of nitrogen; 5000 of these small systems are now in operation. In this range, membranes are the low-cost process, and most new nitrogen plants use membrane systems.
A growing application of membrane systems is the removal of condensable organic vapours from air and other streams. Unlike the process described above, organic vapour separation uses rubbery membranes, which are more permeable to the organic vapour. More than 100 organic vapour recovery plants have been installed. In Europe, most of the plants recover gasoline vapours from air vented during transfer op-erations; in the USA, most plants recover chlorinated and Suorinated hydrocarbons from refrigeration or chemical processing streams. Separation of propylene from nitrogen in polyoleRn plants is an emerging application worldwide.
Pervaporation
The process Pervaporation is a membrane process used to separate liquid mixtures. The feed liquid contacts one side of a membrane, which selectively permeates one of the feed components, as shown in Figure 18. The permeate, enriched in this component, is removed as a vapour from the other side of the membrane. The driving force for the process is the low vapour pressure on the permeate side of the membrane, which is generated by cooling and con-densing the permeate vapour. The separation achieved is proportional to the differences in rates of permeation of the components of the mixture through the membrane.
Pervaporation offers the possibility of separat-ing solutions, mixtures of components with close boiling points, or azeotropes that are difRcult to separate by distillation or other means. An illustra-tion of the ability of pervaporaillustra-tion membranes to break azeotropes is shown inFigure 19for the separ-ation of benzene/cyclohexane mixtures. The va-pour}liquid equilibrium for the mixture shows that benzene/cyclohexane mixtures form an azeotrope at approximately 50% benzene. Distillation is unable to
separate a feed stream of this composition. However, pervaporation treatment of this mixture produces a vapour permeate containing more than 95% benzene.
[image:17.568.304.502.465.653.2]Figure 20 Flow scheme of an integrated distillation/pervaporation plant for ethanol recovery from fermentors. GmbH, Germany) installed theRrst commercial
per-vaporation plant. That plant separated water from concentrated alcohol solutions; GFT has since instal-led more than 50 such plants. The ethanol feed to the membrane generally contains &10% water. The pervaporation process removes the water as the per-meate, producing pure ethanol with less than 1% water, and avoiding all the problems of azeotropic distillation.
Spurred on by this success, a great deal of ef-fort is being made to apply pervaporation to other difRcult separations. Exxon, for example, pur-sued the separation of hydrocarbon mixtures contain-ing aromatics and aliphatics, a major separation problem in reRneries. Another application is the sep-aration of dissolved volatile organic compounds (VOCs) from water, developed by Membrane Tech-nology and Research, Inc.
Applications To date, the largest application of per-vaporation is the dehydration of ethanol or iso-propanol. This process has been pioneered by GFT, now a division of Sulzar, using polyvinyl alcohol composite membranes that are far more permeable to water than alcohol. A Sow scheme of a GFT plant combining distillation and pervaporation to produce dry alcohol is shown in Figure 20. The distillation column produces an ethanol overhead stream con-taining 85}90% ethanol which is fed to the per-vaporation system. To maximize the vapour pressure driving force across the membrane the pervaporation module usually operates at a temperature of 105}1303C, corresponding to a need stream vapour pressure of 2}6 atm. The permeate vapour is cooled and condensed at 0 to !103C. The permeate con-tains 40}50% ethanol which is recycled to the distil-lation column; the residue stream is better than 99.5 wt% ethanol. Most of the installed solvent
de-hydration systems have been for ethanol dede-hydration, but applications to other solvents, including iso-propanol, glycols, acetone and methylene chloride, have also been studied.
The only other commercial pervaporation applica-tion is the separaapplica-tion of dissolved VOCs from water. Relatively hydrophobic composite membranes, such as silicone rubber coated on a microporous polyimide support membrane, are used. Extremely high separ-ation factors can be obtained for the more hydropho-bic VOCs such as toluene, benzene, chlorinated solvents, esters and ethers. Frequently the VOC in the condensed permeate is enriched 100- to 1000-fold over the feed. Target applications include removal of VOCs from industrial wastewater streams and the recovery of volatileSavour and aroma components in the food processing industry. The GC traces in Figure 21illustrate the concentration and recovery of orange juiceSavours from the water evaporated from orange juice obtained by pervaporation.
Figure 21 HPLC traces showing recovery of flavour and aroma components from orange juice evaporation condensate by per-vaporation.
Figure 22 The separation of sodium hydroxide from hemicel-lulose by dialysis. This separation became important in the
pro-duction of rayon in the 1930s and 1940s. Figure 23 Schematic of a hollow-fibre haemodialyser. aromatic/aliphatic mixtures, using polyimide/
poly-urethane block copolymer membranes.
Dialysis
The process Dialysis was the Rrst membrane pro-cess to be used on an industrial scale with the devel-opment of the Cerini dialyser in Italy. The production of rayon from cellulose expanded rapidly in the 1930s, and a need arose to recover sodium hydroxide from hemicellulose/sodium hydroxide solution by-product streams formed in the process. A Rnely microporous membrane was used to separate the con-centrated hemicellulose solution from water. The smaller sodium hydroxide molecules diffuse across the membrane down a concentration gradient to produce an uncontaminated product stream, as shown inFigure 22.
With the development of ultraRltration and
micro-Rltration membranes in the 1960s and 1970s, indus-trial applications of dialysis largely disappeared be-cause dialysis membranes were slow and unselective compared to the newer technologies. However, in the medical area, two very large applications have been
developed, namely the dialysis of blood } haemodialysis } in the artiRcial kidney, and the related process used to exchange oxygen and carbon dioxide in blood in the artiRcial lung. Both processes use the low-pressure, mild conditions of dialysis.
Applications
Haemodialysis (artiTcial kidney) The kidney is
a key component in the body’s waste disposal and acid}base regulation mechanism. Approximately 1 in every 10 000 persons will suffer irreversible kid-ney failure, which before 1960 was invariably fatal. Now a number of treatments, of which haemodialysis is by far the most important, can maintain these patients. As many as 800 000 patients worldwide are treated by haemodialysis devices. Each patient is di-alysed two to three times per week with a dialyser that contains about one square metre of membrane area. Economies of scale allow the membrane mod-ules to be produced at about US$15 each. The devices are generally disposed of after one or two uses. As a result the market is about US$1.3;109 per year, making this the largest membrane separation process in terms of sales per year and membrane area used.
TheRrst successful artiRcial kidney was construc-ted by Kolf and Berk in Holland in 1945. Over the next 20 years Kolf and others developed a number of improved devices, and by the 1960s the process began to be widely used. Early dialysers used coiled tubes or plate-and-frame designs. The development of
hollow-Rbre dialysers reduced costs considerably, making widespread use of the process possible. Each Rbre dialyser contains 0.5}2.0 m2of membrane formed as
[image:19.568.50.278.627.671.2]Figure 24 Schematic examples of (A) facilitated and (B) coupled transport of gas and ions. The facilitated transport example shows the transport of oxygen across a membrane using haemoglobin as the carrier. The coupled transport example shows the transport of copper ions across the membrane using a liquid ion exchange reagent as the carrier.
slowly to avoid shock to the patient; typically 2}4 h are required to eliminate all of the accumulated toxins.
Blood oxygenators (artiTcial lungs) Blood
oxygen-ators are used during heart surgery. Until the early 1980s direct oxygenation of blood was used to main-tain patients during surgery. Rotating discs or small countercurrent contacting towers delivered oxygen to the blood and removed carbon dioxide. This proced-ure required a large volume of blood to prime the units and damaged the blood during long surgeries. The introduction of hollow-Rbre membrane contac-tors largely solved both of these problems and was one reason for the dramatic expansion of open-heart surgery in the 1980s. Currently, about one million procedures are performed annually world-wide. A successful heart-lung must normally deliver about 250 cm3(STP) per min of oxygen and remove about 200 cm3(STP) per min of carbon dioxide. Micropor-ous polyoleRn hollow-Rbre membrane modules with a membrane area of 2}10 m2 are generally used.
Other Membrane Separation
Processes
The seven processes described above represent the majority of commercial membrane separation tech-nologies. However, a number of processes are still in the laboratory or early commercial stage and may yet become important. These processes are described brieSy below.
Carrier-Assisted Transport
Carrier-assisted transport usually employs liquid membranes containing a complexing or carrier agent. The carrier agent reacts with one permeating com-ponent on the feed side of the membrane and then diffuses across the membrane to release the per-meant on the product side of the membrane. The carrier agent is then reformed and diffuses back to the feed side of the membrane. Thus, the carrier agent acts as a shuttle to transport selectively one component from the feed to the product side of the membrane.
Facilitated transport membranes can be used to separate gases; membrane transport is then driven by a difference in the gas partial pressure across the membrane. In the example shown in Figure 24, the carrier is haemoglobin, used to transport oxygen. On the upstream side of the membrane, haemoglobin reacts with oxygen to form oxyhaemoglobin, which then diffuses to the downstream membrane
in-terface. There, the reaction is reversed } oxygen is liberated to the permeate gas and haemoglobin is reformed. The haemoglobin then diffuses back to the feed side of the membrane to pick up more oxygen. In this process haemoglobin acts as the shuttle, transporting oxygen selectively through the membrane. Other gases, such as nitrogen, which do not react with the carrier, are left behind.
Figure 25 Schematic of a membrane reactor to separate butadiene fromn-butane.
Figure 26 Schematic showing application of a membrane con-tactor to remove dissolved oxygen from water. This process is used to prepare power plant boiler feed water.
hydrogen ions are picked up. The reformed oxime molecules diffuse back to the feed side of the membrane. Metal ions can also be selectively trans-ported across a membrane, driven by aSow of hydro-gen or hydroxyl ions in the other direction.
Because the facilitated and active transport pro-cesses employ a reactive carrier species, very high membrane selectivities can be achieved } often far larger than those achieved by other membrane pro-cesses. This has maintained interest in facilitated transport since the 1980s, yet no signiRcant commer-cial applications exist or are likely to exist in the immediate future. The principal limitations are the physical instability of the liquid membrane and the chemical instability of the carrier agent.
Membrane Reactors
In membrane reactors, the membrane is used to shift a chemical equilibrium or separate the products of a reaction. A wide variety of processes have been suggested, and a few have reached the commercial stage. A simple example is shown inFigure 25}the reaction of n-butane to butadiene and hydrogen: C4H10BC4H6#2H2.
This is an equilibrium reaction and in a conven-tional process a mixture of components is withdrawn from the reactor, separated, and the unreacted n -butane recirculated to the feed. In the membrane reactor, hydrogen is removed through the membrane so that the chemical equilibrium in the reactor is shifted to the right and the conversion ofn-butane to butadiene is increased. Essentially pure butadiene leaves the reactor. This type of process is the subject of a considerable research effort, mostly using ceramic membranes operating at high temperatures. The development of these devices for the production of syngas (a mixture of carbon monoxide and hydro-gen) is the focus of very large research programmes at Air Products and Standard Oil. Promising results have been obtained in the laboratory, but scale-up to an economical process is still far off.
Membrane Contactors
In the membrane separation processes discussed so far, the membrane acts as a selective barrier allowing
relatively free passage of one component while retain-ing another. In membrane contactors the membrane function is to provide an interface between two phases but not to control the rate of passage of per-meants across the membrane. An example of this technology, in which the membrane is used in a pro-cess to deoxygenate water, is shown inFigure 26.
1This article does not deal with the important particle
separ-ation techniques of filtrsepar-ation, flotsepar-ation and the use of membranes which are dealt with elsewhere in the Encyclopedia.
plants. The long-term goal of the process is to replace packed towers in conventional absorber}stripper operations. Practical problems related to membrane fouling and lifetime are the principal limitations.
The Future
Since the 1970s there has been a period of very rapid growth for the membrane separation industry. Total sales for all membrane applications have grown ap-proximately 400-fold to the US$3}4;109 per year level. In the areas of microRltration, ultraRltration, reverse osmosis, electrodialysis and dialysis, the tech-nology is relatively mature. SigniRcant growth is still occurring, however, as membranes continue to dis-place more conventional separation techniques. The most rapidly expanding area is gas separation, which has grown to a US$150;106per year business in just a few years. Gas separation is poised to grow a fur-ther two- or three-fold as the technology is used more widely in the reRnery, petrochemical and natural gas processing areas. If the development of ceramic oxy-gen-permeable membranes for syngas membrane re-actors is successful, a membrane process that could change the basis of the chemical industry would then be available.
Further Reading
Amjad Z (1993)Reverse Osmosis. New York: Van Nos-trand-Reinhold.
Baker RW, Cussler EL, Eykamp Wet al. (1991)Membrane Separation Systems. Park Ridge, NJ: Noyes Data Corp. Bakish R (ed.) (1991) Proceedings of the International Conference on Pervaporation Processes in the Chemical Industry, Heidelburg. Englewood, NJ: Bakish Materials Corp.
Bakish R (ed.) (1992) Proceedings of the International Conference on Pervaporation Processes in the Chemical Industry, Ottawa. Englewood, NJ: Bakish Materials Corp.
Bakish R (ed.) (1995)Proceedings of the International Co-nference on Pervaporation Processes in the Chemical In-dustry, Reno, NV. Englewood, NJ: Bakish Materials Corp. Brock TD (1983)Membrane Filtration. Madison, WI: Sci.
Tech. Inc.
Cheryan M (1986) UltraTltration Handbook. Lancaster, PA: Tecnomic Pub. Company.
Crespo JG and BoKddeker KW (eds) (1994)Membrane Pro-cesses in Separation and PuriTcation. Dordrecht: Kluwer Academic.
Ho WS and Sirkar KK (eds) (1992)Membrane Handbook. ew York: Van Nostrand Reinhold.
Mulder M (1991)Basic Principles of Membrane Techno-logy. Dordrecht: Kluwer Academic.
Parekh BS (ed.) (1988)Reverse Osmosis Technology. New York: Marcel Dekker.
Paul DR and Yampol’skii YP (eds) (1994)Polymeric Gas Separation Membranes. Boca Raton, FL: CRC Press. Porter MC (ed.) (1990)Handbook of Industrial Membrane
Technology. Park Ridge, NJ: Noyes Publications. Rautenbach R and Albrecht R (1989)Membrane Processes,
Chichester: John Wiley&Sons.
Toshima N (ed.) (1992)Polymers for Gas Separation. New York: VCH.
PARTICLE SIZE SEPARATIONS
J. Janc\a, Universite& de La Rochelle, La Rochelle, France
Copyright^ 2000 Academic Press
Historical Development
In 1556, an extraordinary book entitledDe Re
Metal-lica, Libri XII appeared in Basel. The author was
a German physician, naturalist and mineralogist, call-ing himself Georgius Agricola (originally called Georg Bauer), living in JaHchymov, Bohemia, from 1494 to 1555. Agricola described, in a fascinating manner, the contemporary advances in metals and
minerals recovery and gave us a very detailed report on the sophisticated technologies of his epoch. This late medieval period saw a true expansion of science and technology in Europe. Winston Churchill once said: ‘2from this date, 1492, a new era in the history of mankind takes its beginning’. As many metal re-covery processes used at that time were based on various separations of particulate matter andDe Re
Metallica, Libri XII seems to be the Rrst printed
review of separation technologies, it isRtting to ac-knowledge Agricola’s publication priority in thisReld and to consider his book as the beginning of a modern scientiRc approach to particle size separations.