Abstract— The Jamaica Stock Exchange (JSE) has been defined by Standard and Poor's as a frontier market. It has undergone periods where trading gains exceeded that of major markets such as the London Stock Exchange. This paper focuses on machine learning algorithms including decision trees, neural networks and support vector machines used to predict the JSE. Selected algorithms were applied to trading data over a 22 month period for price and trend forecasting and a 12-year period for volume forecasts. Experimental results show 90% accuracy in the movement prediction and 0.95 correlation coefficient for price prediction. Volume predictions were enhanced by a discretization method and support vector machine to yield over 70% accuracy.
Index Terms— machine learning, stock prediction, Jamaica
I. INTRODUCTION
This paper describes machine learning approaches such as Naive Bayes (NB), artificial neural networks (ANN), decision trees (DT) and support vector machines (SVM) used to predict indices of the Jamaica Stock Exchange (JSE). The predictions include trend of the seven indices; volume and prices of blue chip stocks trading on the JSE. Only one previous work [1] describes neural network approaches used to predict the Jamaican financial market which focused on forecasting core inflation rate from oil prices, treasury bills, exchange rate and base money. Stocks were not included in that study.
A. Background
Legislation for the Jamaican dollar (J$) was passed in 1968 and the currency went into circulation the following year. The JSE was incorporated as a private limited company in August 1968 and the stock market began operations in February 1969. While the JSE is not a major market, it has been defined by Standard & Poor’s as a frontier market.
B. Contribution
Manuscript received March 3, 2015; revised April 21, 2015.
S. A. Bogle is a lecturer at the University of Technology, Jamaica 237 Old Hope Road, Kingston 6 JAMAICA (corresponding author phone: 876-927-1680; e-mail: sbogle@ utech.edu.jm). She is also a PhD candidate of the University of Georgia.
W. D. Potter is a professor with University of Georgia, Athens, GA 30601 USA. He is also head of the Artificial Intelligence Institute (e-mail: [email protected]).
Although the JSE is a frontier market, there have been periods when it has outperformed the London and New York markets such as 1981-1985 [2]. In 1992, it was ranked among the top ten world equity markets by the International Finance Corporation based on the performance of the common index in 1991. At the end of trading on December 29, 1991 market capitalization grew 245 percent over the previous year, closing at US$3.45 billion [3]. Previous studies on the JSE have only used statistical approaches to test the efficiency of the JSE in relation to the efficient market hypothesis (EMH). Reference [3] used the serial correlation of stock returns to test efficiency of the JSE while [2] gave a historical analysis of the market between 1969 and 1985 focusing on returns with associated risk as per beta coefficient in comparison with the US and UK markets. Reference [4] tested for randomness of returns in the earlier years. The experimental results in this study have far exceeded those of the statistical models used in previous works which did not focus on prediction accuracy. This study will be the first published work on applying machine learning approaches to the JSE data. It shows that supervised learning algorithms such as SVM and ANN are more accurate than generic statistical models such as regression and presents a more accurate stock prediction model on the JSE dataset [5].
II. LITERATUREREVIEW
This section reviews keys concepts such as the efficient market hypothesis and gives a review and appraisal of the various types of stock forecasting approaches used to predict other stock markets.
A. Efficient Market Hypothesis
The efficient market hypothesis (EMH) asserts that it is futile to use historical data or public economic forecasts to predict future security prices including stocks [6]. Studies have shown that the financial market is not random and the efficient market hypothesis is a subset of the chaotic market hypothesis[7].
The three versions of the efficient market hypothesis are defined by [8]: i)Weak form stock hypothesis, where prices already reflect all information that can be derived by examining market trading data; ii) Semi-strong form hypothesis, all publicly available information as it relates to the future prospects of the firm must be already reflected in the stock price; iii) Strong form hypothesis, the stock price
A Machine Learning Predictive Model for the
Jamaica Frontier Market
S. A. Bogle,
Member, IAENG
W. D. Potter
reflects all information relevant to the firm, including information that is available only to company insiders. Based on the definitions above, it is virtually impossible to predict a strong form market and almost impossible to predict a semi-strong form market unless you have inside information. It is for this reason that many countries have laws to prevent elected officials from trading stocks based on inside information since it gives them an unfair advantage.
This study assumes that the JSE is weak form efficient and the high prediction accuracy from experiments confirm this. In the strictest sense, the EMH implies a study like the one proposed herein, is futile unless the market is not efficient. It also asserts that the existing inefficiencies will not last for a prolonged period, as the market will correct itself over time. Hence, the EMH has been viewed skeptically by many researchers in the recent past [9].
The efficient market theory also suggests that the job of market speculators is obsolete. However, it is consistent in asserting that it is difficult to predict the market accurately in a consistent manner. Therefore, the experts will be wrong at times and lose money for both themselves and those they advise [10] .
Forecasting Methods used by Jamaican Financial Firms In forecasting blue chip stocks, historical data for three to five years is usually used to project one to three years. The forecasting methods employed by financial firms in predicting the JSE main and combined indices are relatively simple. Most use a form of annual earnings projection due to the small market as opposed to advanced statistical or machine learning methods.
B. Financial Forecasting Approaches
Financial Forecasting approaches include mathematical, economic and machine learning methods. Data mining methods used for financial analysis and forecasting include regression, neural networks, genetic algorithms, k-nearest neighbors, Markov chains, decision trees, univariate models, hybrid methods and relational data mining [7]. The learning paradigms used in machine learning approaches are neural networks, classifier systems, instance based learning, genetic algorithms, rule induction paradigms and analytical learning based on rules in first order logic such as Prolog horn clauses. This section focuses on machine learning methods that have been used in previous studies which form the core of the experimental framework used in this study; that is, Naive Bayes, neural networks, decision trees and support vector machines. It will therefore examine neural networks and how they compare to other machine learning methods, support vector machines and a comparison of statistical approaches and machine learning algorithms.
Appraisal of neural net and other machine learning methods for Stock Prediction
The use of neural nets as a successful financial predictor has been suggested by [10], [11] and [12]. Reference [12] used neural networks and genetic algorithms to predict the Korea composite stock exchange index with 82% accuracy. Ten years of data covering 2,928 trading days from January 1989 to December 1998 was used. A genetic algorithm was used to reduce dimensionality by feature discretization to enhance the generalizability of the classifier from the empirical
results. Reference [13] used neural networks and genetic algorithms to predict the movement of the Singapore Stock Exchange index with 81% accuracy.
Reference [9] suggest neural networks are suitable for extracting patterns and detecting trends that are too complex to be identified by humans and other computing techniques. They also suggest they have good generalization capability and are noise tolerant. Probabilistic neural networks are also cited. However, these are not frequently used due to their bulky nature inherent to the large training data needed. Reference [12] mentions a few limitations of artificial neural networks in learning stock patterns because of the high noise, non-stationary characteristics and complex dimensionality of stock market data. The large amounts of data sometimes inhibit pattern learning. This can be overcome by feature discretization which uses thresholds to convert continuous values to discrete ones.
Reference [14] compared procedural neural networks (PNN), back propagation neural networks (BNN), hidden markov models (HMM) and support vector machines (SVM). The PNN outperformed BNN, HMM and SVM in predicting daily stock price and was more time efficient. The stock volume was found to be more dependent on the previous day’s price than partial data for the current day. The training process of PNN was similar to BNN although PNN had larger input dimensions. There remains scope for improvement in the ability of PNN to generalize. Reference [7] highlights limitations of neural networks for forecasting stock prices with regards to explicability, usage of logical relations, scalability and tolerance for sparse data. The scalability issue has been handled by combining with genetic algorithms to improve the tractability. There are mixed views on the suitability of neural networks for generalizations. While they are robust at identifying non-linear trends, their generalization ability can be enhanced by preprocessing techniques such as discretization or combination with genetic algorithms.
Support Vector Machines
Reference [15] developed a hybrid stock trend prediction model based on support vector machines and an f-score supported sequential forward search. It used 29 technical indices as the whole feature set to predict the daily direction of the NASDAQ index. According to [14], the SVM has been the best individual classifier in forecasting weekly movement direction. Reference [16] analyzed the impact of headline news text on stock price returns using a Naïve Bayesian classifier and stock price return analysis by Welch test. This analysis is helpful in determining how information is reflected in the stock price and ultimately the level of efficiency in the market. It could also be used as part of a qualitative - quantitative hybrid model to determine the impact a future news item will have on a stock.
from raw stock data, this can be boosted by clustering. Temporal models such as genetic algorithms with neural networks preserve time sequence but limit system performance due to lack of clustering [17].
A range of statistical and machine learning approaches has been used to successfully predict various stock exchanges worldwide. ARIMA is the most dominantly used statistical approach. While several machine learning methods have been used, ranging from ANNs to SVM, neural networks have been the most popular due to noise tolerance and their ability to handle the complicated data that is chaotic in nature. Neural networks and genetic algorithms have gained over 80% accuracy in predicting the Singapore and Korean indices [12], [13]. Prediction of movement (or trend) has generally had a high level of accuracy due to its binary output. Genetic Algorithms have been proven to reduce computational complexity and run time. Hybrid approaches have also been very successful as they combine the strengths of multiple methods while reducing weakness such as over fitting and computational complexity.
III. EXPERIMENTAL DESIGN
Machine learning approaches used in the JSE predictions include neural networks, support vector machines and linear regression for continuous data prediction as well as decision trees, neural networks and Naïve Bayes for binary predictions and multiclass discrete data. Trading data over the 22 month period from January 2010 - October 2011 was formatted to do three types of predictions: prices, movement and volume.
i. Closing ask prices of companies and their respective shares- This dataset includes 44 companies that trade 59 instruments on the JSE. Some companies trade up to 4 securities. The trading period is from January 10, 2010 to November 11, 2011 totaling 29,877 instances. The predictions were done using linear regression and neural networks; 8-fold cross validation was used. The results are shown in Table 1.
ii. Movement of seven indices. This binary prediction was done using decision trees, neural networks and Naïve Bayes. This is shown in Tables II and III. iii. Volume of ten blue chip stocks: There are 14 blue
[image:3.595.298.542.62.281.2]chips stocks in a select index fund that are deemed to be most liquid by brokerage firm JMMB as shown in Table IV. Data was only available for ten of these stocks and the result is shown in Table VI.
Table I
Price Prediction of Various Companies on the JSE Linear
Regression
Multilayer Perceptron
CC MAE RMSE
RAE RRSE
0.93 7.065 19.859 25.1907 % 36.7683 %
0.9703 5.5473 13.6965 19.458 % 24.5658 %
KEY
CC-Correlation coefficient MAE- Mean absolute error
RMSE-Root mean squared error RAE-Relative absolute error RRSE-Root relative squared error
Table II
Movement prediction of various indices of all and main JSE index.
Index Scheme Test mode M N Accuracy (%)
All* DT 10 fold
cross validation
0 2589 100
All* ANN 10 fold cross validation
0.431 2589 38
1 DT 5 fold cross
validation
0.995 476 99.8
1 DT 10 fold
cross validation
0.002 476 99.8
1 ANN split 66.0%
train,
0.141 476 91.9
1 ANN 10 fold
cross validation
0.452 476 59
1 NB 10 fold
cross validation
0.248 476 76
KEY
*All refers to all seven indices M -Mean absolute error N- number of Instances
IV. RESULTS
In order to avoid over fitting, neural network experiments unless otherwise stated had the following parameters: learning rate: 0.3, momentum: 0.2, training time: 500, and validation threshold: 20.
A. Price prediction
[image:3.595.304.521.550.765.2]Table I shows the results of the closing ask price prediction of all companies that trade on the JSE for the period January 2010 to November 2011. The data set includes 29,876 instances and uses the following 14 attributes: Stock-Code, Value-Date, Close-Price, Last-Price, Previous-Price, Price-Change, Percentage-Price-Change, Volume-Traded, Todays-High, Todays-Low, Year-High, Year-Low, Closing-Bid and Closing-Ask.
Table III
Movement prediction of JSE Select (2), All Jamaican Composite (3), Cross Listed Index(4), Junior Market Index(5), Combined Index (6) and US
Equities Index (7)
Index
Scheme Instances Mean Absolute Error
Correctly Classified Instances (%)
2 NB 476 0.1336 82
2 DT 476 0.0028 99.8
2 ANN 476 0.1608 83.4
3 NB 476 0.1794 84.9
3 DT 476 0.0021 99.8
3 ANN 476 0.1419 88.4
4 NB 476 0.0507 93
4 DT 476 0 100
4 ANN 476 0.1138 91
5 NB 476 0.1357 84.2
5 DT 476 0.0014 99.8
5 ANN 476 0.4255 46
6 NB 161 0.1458 89.4
6 DT 161 0 100
6 ANN 161 0.1248 91
7 NB 48 0.1082 85.4
7 DT 48 0 100
[image:3.595.59.276.626.775.2]B. Movement prediction
The seven indices on the JSE are:
1 JSE Market Index (Main Index ) 2 JSE Select Index (JSE Select) 3 JSE All Jamaican Composite (All Jamaican ) 4 JSE Cross Listed Index (Cross Listed) 5 JSE Junior Market Index (JSE Junior ) 6 JSE Combined Index (Combined Index) 7 JSE US Equities Index (US Equities )
For each of the indices the following 12 attributes were used: Value-Date, Value, Value-Change, Percentage-Change, Volume-Traded, Year-High, Year-Low, YearToDate, QuarterToDate, MonthToDate, WeekToDate and Movement.
Table II shows the results of the movement prediction of companies on all seven indices as well as the main index. Table III shows Neural Network on all remaining indices using tenfold cross validation. Two hidden layers were used for the neural network experiments in Table III.
C. Predicting Company Volume
The volume was predicted for ten blue chip stocks on the JSE shown below in Table IV.
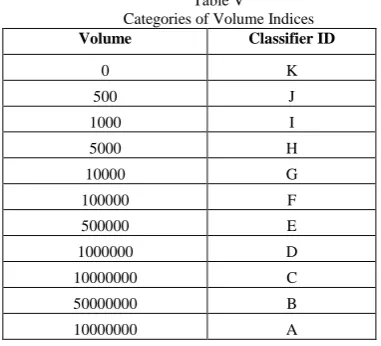
Since the prediction accuracy was a mere 18% on the continuous data, Table V was used to discretize the continuous volume data to gain an improvement on the prediction accuracy. As shown in Section II, feature discretization uses thresholds to convert continuous values to discrete ones.
There were 261 instances and 6 attributes: Number (incrementally replaces date), LastPrice, ClosePrice, Change dollar value, ChangePercent, VolumeDisc (Discretized volume as shown in Table V). The results are shown in Table VI.
V. ANALYSIS OF RESULTS
In this study the decision trees were found to have 99% accuracy in predicting movements of all seven indices. Naïve Bayes’ accuracy ranged from 76% to 93% and neural networks had 91% on the combined index and only 46% on the junior market index. Neural networks outperformed decision trees and linear regression in predicting price and volume trades, whereas decision trees and Naïve Bayes were more accurate in the binary movement prediction.
A. Price Prediction
In price prediction, neural network had a higher correlation coefficient (0.97) than linear regression and a lower mean absolute error, as shown in Table I.
B. Movement Prediction
Decision trees have 99 to 100 percent accuracy on predicting movement on all seven indices. Naïve Bayes had 82-93% accuracy on index 2 to 7 and 76% on the main index. Neural networks had 91% on the combined index and only 46% on the junior market index.
Tables II and III indicate that while neural networks had lower prediction accuracy on the movement of the indices, the mean absolute error was also higher making it a weaker predictor than Naïve Bayes and decision tree.
C. Volume Prediction
[image:4.595.48.242.65.164.2]Table VI reveals that of the ten blue chip companies analyzed with neural networks, the lowest volume prediction accuracy was Carreras 30% and the highest was Desnoes & Geddes 55%. Both companies are conglomerates.
Table IV
JMMB Select Blue Chip stocks
Registered Company
Trading Symbol
Sector Sharesholding
*Bank Of Nova Scotia Jamaica Ltd.
BNSJ Investment 3,630,464
Cable & Wireless Jamaica Limited
CWJA Communication 10,943,953
Caribbean Cement Company Limited
CCC Production 1,059,917
Carreras Group Limited
CAR Conglomerate 604,516
*Courts Jamaica Limited
CRTS Furniture & Appliance Retailer
2,976,582
Desnoes & Geddes Limited
DG Conglomerate 3,498,249
*Dehring, Bunting & Golding Limited
DBG Investment 357,296
Gleaner Company Limited
GLNR Communication 1,508,356
GraceKennedy GK Conglomerate 403,225 Jamaica
Broilers Group Limited
JBG Production 1,493,454
Jamaica Money Market Brokers
JMMB Investment 2,107,780
Jamaica Producers Group Limited
JP Production 232,820
*Life of Jamaica
LOJ Investment 3,511,516
NCB Jamaica Limited
NCBJ Investment 3,067,441
Source [18] Reproduced with the kind permission of JMMB
[image:4.595.300.537.159.554.2]* Data were unavailable for these four companies. DBG merged with BNSJ
Table V
Categories of Volume Indices
Volume Classifier ID
0 K
500 J
1000 I
5000 H
10000 G
100000 F
500000 E
1000000 D
10000000 C
50000000 B
[image:4.595.317.508.595.768.2]Table VI
Results of Ten Blue Chip Company Volume Predictions using Neural Networks with Tenfold Cross Validation
Company Hidden layers
MAE Correctly Classified Instances (%)
GK 4 0.1729 34
GK 2 0.1732 33
NCB 2 0.1557 40
NCB 4 0.1 567 37
CWJA 2 0.1934 32
CCC 2 0.1685 51
CAR 2 0.1961 30
DG 2 0.1446 55
GLNR 2 0.1436 50
JBG 2 0.1651 43
JMMB 2 0.1653 36
[image:5.595.42.269.73.239.2]JP 2 0.1654 51
Table VII
Volume Predictions of Blue Chip Companies Using SMO SVM Polykernel
Kernel Evaluations
Accuracy (%)
Precision Recall MAE
CCC 3089 68.3 0.821 0.683 0.177
GK 12030 58 0.762 0.585 0.179
DG 105 64.6 0.803 0.646 0.164
GL 1685 61.9 0.651 0.619 0.178
SLJ 120 56.3 0.665 0.563 0.164
JP 45449 72.8 0.863 0.728 0.193
CWJ 2278 41.8 0.41 0.419 0.165
NCB 630 50 0.451 0.501 0.154
Table VII shows the SVM results for predicting company volume. CCC had an accuracy of 68% with a precision of .821 and recall of 0.683. Fivefold cross validation was used on the 12 year data set from 2001-2013 with over 3,000 instances for each company. DG had an accuracy of 65% with a precision of 0.8. Among the blue chip companies, only CWJ had an accuracy of less than 50%.
VI. CONCLUSION
The results reveal that neural networks are better at predicting continuous data such as prices and volume traded and less accurate at binary prediction of stock movement. Other predictors such as decision trees and Naïve Bayes were more accurate at predicting the movement of the stock based on historical data.
The movement prediction accuracy of almost 100% by decision trees and price prediction of 0.97 correlation coefficient for 22 month dataset seem reasonable. SVM volume prediction accuracy of up to 72% on a 12 year dataset is promising.
The success of a stock is also dependent on the number of investors. Hence the importance of volume predictions. The discretization method used proved quite effective in increasing the accuracy of volume predictions. While the prediction accuracy was a mere 18% on the continuous data, after using Table V to discretize the continuous volume data, the prediction accuracy improved to above 50% for seven of the eight blue chip stocks listed Table VII. The 41.8% accuracy for the CWJ stock could be attributed to competition faced by CWJ after the government lifted the decades old monopoly for telecommunications which they previously enjoyed.
Future work will include a weighted approach for market stimulus such as the recent Jamaica Debt Exchanges, and a semantic web model which takes real time data on social
and economic factors to further improve accuracy of the model in prediction.
APPENDIX
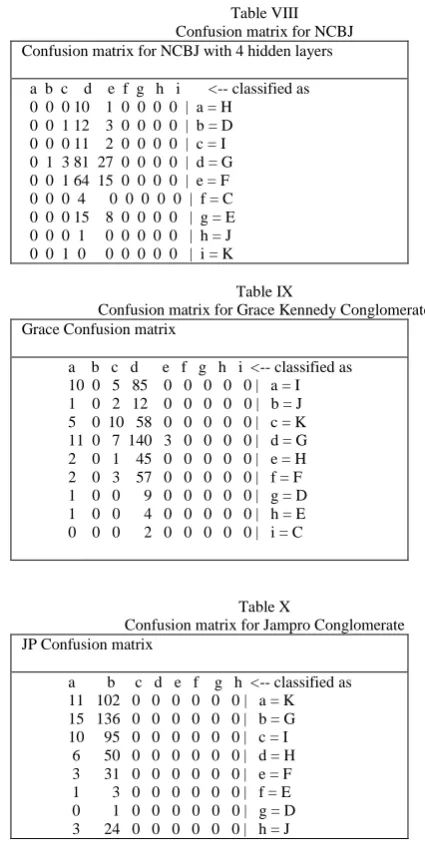
[image:5.595.294.507.185.619.2]The confusion matrices shown in Tables VIII, IX and X of the Appendix indicate that errors dominate in two adjacent categories. It is anticipated the errors can be reduced by merging both categories. In converting the continuous type volume predictions to discrete form, the same range was used for all companies. Some companies trading have a lower range than others.
Table VIII Confusion matrix for NCBJ Confusion matrix for NCBJ with 4 hidden layers
a b c d e f g h i <-- classified as 0 0 0 10 1 0 0 0 0 | a = H
0 0 1 12 3 0 0 0 0 | b = D 0 0 0 11 2 0 0 0 0 | c = I 0 1 3 81 27 0 0 0 0 | d = G 0 0 1 64 15 0 0 0 0 | e = F 0 0 0 4 0 0 0 0 0 | f = C 0 0 0 15 8 0 0 0 0 | g = E 0 0 0 1 0 0 0 0 0 | h = J 0 0 1 0 0 0 0 0 0 | i = K
Table IX
Confusion matrix for Grace Kennedy Conglomerate Grace Confusion matrix
a b c d e f g h i <-- classified as 10 0 5 85 0 0 0 0 0 | a = I 1 0 2 12 0 0 0 0 0 | b = J 5 0 10 58 0 0 0 0 0 | c = K 11 0 7 140 3 0 0 0 0 | d = G 2 0 1 45 0 0 0 0 0 | e = H 2 0 3 57 0 0 0 0 0 | f = F 1 0 0 9 0 0 0 0 0 | g = D 1 0 0 4 0 0 0 0 0 | h = E 0 0 0 2 0 0 0 0 0 | i = C
Table X
Confusion matrix for Jampro Conglomerate JP Confusion matrix
a b c d e f g h <-- classified as 11 102 0 0 0 0 0 0 | a = K 15 136 0 0 0 0 0 0 | b = G 10 95 0 0 0 0 0 0 | c = I 6 50 0 0 0 0 0 0 | d = H 3 31 0 0 0 0 0 0 | e = F 1 3 0 0 0 0 0 0 | f = E 0 1 0 0 0 0 0 0 | g = D 3 24 0 0 0 0 0 0 | h = J
ACKNOWLEDGMENT
SA Bogle thanks Jamaica Money Market Brokers (JMMB) for granting permission to use Table IV in the paper.
REFERENCES
[1] Serju, P.( 2000). “Monetary Conditions & Core Inflation: An Application of NeuralNetworks”, Bank of Jamaica Working Paper. Retrieved on 10/25/2013
from
[2] Kitchen, R. (1986). The role of the Jamaican stock exchange in the capital market. Caribbean Finance and Management, 2(2 1-23 [3] Agbeyegbe, T. D. (1994). Some stylised facts about the
Jamaica stock market. Social and Economic Studies, 143-156. [4] Koot, R., Miles, J., & Heitmann, G.(1989). Security risk and market
efficiency in the Jamaican stock exchange. Caribbean Finance and Management, 5(2), 18-33.
[5] JSE (2011) Jamaica Stock Exchange Retrieved 12/2012 from http://www.jamstockex.com/controller.php?action=about_exchange [6] Merton, R.C. (1995). Influence of mathematical models in
finance on practice: past, present and future. In Howison, S., Kelly, F.P. & Wilmott, P. Mathematical Models in Finance (1st ed., pp. 1-14). London: Chapman & Hall.
[7] Kovalerchuk, B., & Vityaev, E. (2000). Data mining in finance: Advances in relational and hybrid methods Springer.
[8] Bodie, Z., Kane, A., & Marcus, A. (2011). Investments (ninth ed.) McGraw-Hill Irwinn.
[9] Padhiary, P. K., & Mishra, A. P. (2011). Development of improved artificial neural network model for stock market prediction. International Journal of Engineering Science, 3 pop
[10] Harding D. (1995). Making Money from
mathematical models. In Howison, S., Kelly, F.P. & Wilmott, P. Mathematical Models in Finance (1st ed., pp. 61-66). London: Chapman & Hall.
[11] Chakraborty, S., Sharma, S.K.(2007) Prediction of
corporate financial health by ArtificialNeural Network International Journal of Electronic Finance, 1( 4) 442-459, Inderscience
[12] Kim, K., & Han, I. (2000). Genetic algorithms approach to feature discretization in artificial neural networks for the prediction of stock price index .Expert Systems with Applications,19(2), 125-132.
[13] Phua, P., Ming, D., & Lin, W. (2001). Neural network with genetically evolved algorithms for stocks prediction. Asia- Pacific Journal of Operational Research, 18, 103-107.
[14] Liang, J., Song, W., & Wang, M. (2011). Stock price prediction based on procedural neural networks.
Advances in Artificial Neural Systems, 2011, 6.
[15] Lee, M. C. (2009). Using support vector machine with a hybrid feature selection method to the stock trend prediction. Expert Systems with Applications ,36(8),0896- 10904.
[16] Takahashi, S., Takahashi, M., Takahashi, H., & Tsuda, K. (2007). Analysis of the relation between stock price
returns and headline news using text categorization Knowledge- Based Intelligent Information and Engineering Systems, 1339-1345. [17] Srinivasa, K., Venugopal, K., & Patnaik, L. (2006). An efficient fuzzy based neuro-genetic algorithm for stock market prediction. International Journal of Hybrid Intelligent Systems, 3(2), 63-81.