Original Article
Identification of differentially expressed genes between
male and female patients with acute myocardial
infarction based on microarray data
Huaqiang Zhou1,2*, Kaibin Yang2*, Shaowei Gao1, Yuanzhe Zhang2, Xiaoyue Wei2, Zeting Qiu1, Si Li2, Qinchang Chen2, Yiyan Song2, Wulin Tan1#, Zhongxing Wang1#
1Department of Anesthesiology, The First Affiliated Hospital of Sun Yat-sen University, Guangzhou, China; 2Zhongshan School of Medicine, Sun Yat-sen University, Guangzhou, China. *Equal contributors and co-first
au-thors. #Equal contributors.
Received May 31, 2018; Accepted August 4, 2018; Epub March 15, 2019; Published March 30, 2019
Abstract: Background: Coronary artery disease has been the most common cause of death and the prognosis still needs further improving. Differences in the incidence and prognosis of male and female patients with coronary artery disease have been observed. We constructed this study hoping to understand those differences at the level
of gene expression and to help establish gender-specific therapies. Methods:We downloaded the series matrix file of GSE34198 from the Gene Expression Omnibus database and identified differentially expressed genes between
male and female patients. Gene ontology, Kyoto Encyclopedia of Genes and Genomes pathway enrichment analy-sis, and GSEA analysis of differentially expressed genes were performed. The protein-protein interaction network
was constructed of the differentially expressed genes and the hub genes were identified. Results: A total of 215
up-regulated genes and 353 down-regulated genes were identified. The differentially expressed pathways were
mainly related to the function of ribosomes, virus, and related immune response as well as the cell growth and proliferation. The protein-protein interaction network of all differentially expressed genes contained 4 hub genes,
FOS, UTY, KDM6A, and SMARCA4, whose function in acute myocardial infarction is related to the sex hormone and sex chromosomes. Conclusion: Our study provides a global view of the gene expression differences between male and female patients with acute myocardial infarction, including differentially expressed genes and related pathways. However, further studies are still needed to verify our results.
Keywords: Coronary artery disease, gender, gene ontology, pathway analysis, protein-protein interaction network
Introduction
Coronary artery disease (CAD), also referred to as ischemic heart disease, is the most com-mon cause of death, especially in middle and high-income countries. The imbalance in the ratio of myocardial blood supply to myocardial oxygen demand in the heart caused by CAD leads to angina and other clinical symptoms. In many cases, there can be an acute drop in the blood flow to the heart, resulting in acute myo -cardial infarction (AMI) that can be fatal within several minutes [1].
Although great progress has been made in the management of AMI, there need to be better management and preventative strategies to improve the overall outcomes in individuals
Gene expression microarray has become a useful tool to identify differentially expressed genes (DEGs) and networks as prognosis asso-ciated biomarkers and therapy targets. Periph- eral blood has become one of the most com-mon materials in microarray analysis, because of its critical role in communication between organs and the simplicity of sample collection. Several studies have focused on the biomark-ers in peripheral blood of patients with CAD [6, 7]. However, there has been no study on the gene expression differences between male and female patients with AMI based on microarray data. Here, we reanalyzed the public data in the Gene Expression Omnibus (GEO, available at: https://www.ncbi.nlm.nih.gov/geo/) microarray data repositories, GSE34198, to identify DEGs and differentially expressed pathways between male and female patients with AMI as well as the interaction of the proteins encoded by these genes. Such differences in gene expres-sion may not only explain the differences be- tween men and women in the incidence and the prognosis of AMI, but also will help to take the gender of the patients into consideration while planning a management to achieve better outcome.
Materials and methods
Affymetrix microarray data
Using the keywords “myocardial ischemia”, “cardiac ischemia” and “coronary artery dis-ease”, eligible microarray gene expression datasets were searched in the Gene Express- ion Omnibus microarray data repositories, and selected GSE34198 for subsequent studies. Others were excluded because the phenotype data didn’t contain gender information, the numbers of the samples were too small, the samples were obtained from the cell lines. Zdenek Valenta et al. submitted GSE34198, based on Illumina GPL6102 platform (Illumina human-6 v2.0 expression beadchip). There were 97 samples in total in the dataset, in- cluding 7 technical replicates, 45 patients and 45 controls. The diagnosis of the patients was based on the clinical criteria, ECG outcome and laboratory findings according to medical guide -lines. The cases were less than 80 years old and had never been treated for cancer. The controls were matched to the patients based on gender, age, status of diabetes mellitus, and smoking status [7]. Venous blood samples we- re collected from both patients and controls. Notably, Valenta et al. had also divided pati-
ents into those who did (AMI: 41 patients, 13 females and 28 males) and did not survive the 6 months follow-up period following the AMI (AMID6: 4 patients, 2 females and 2 males) [7]. It requires at least 3 samples per group to have sufficient power to detect any differentially ex-pressed genes, so we didn’t adopt Valenta’s groups (AMI and AMID6) and converged all pa- tients into the same AMI group [8, 9]. Of those, 15 female patients and 30 male patients with AMI were finally enrolled in our study. Their basic characteristics are shown in Table 1. The comparisons between the two group were made using the log-rank test for categorical variables and k-test for continuous variables. Data preprocessing
R software (available at: http://www.R-project. org/) and packages in Bioconductor (available at: http://www.bioconductor.org/) were used to analyze the data. First, the GEOquery package was used to download the series matrix files from the Gene Expression Omnibus database and acquired the express matrix and pheno-typic data [10]. The probe-set expression levels were then converted into gene expression lev-els using the illuminaHumanv2.db package [11]. If multiple probes mapped to a gene, the mean of the probe effect size was selected. Missing values were filled based on the aver -age of non-missing neighboring values of its neighbor using the k-nearest neighbors meth-od [12].
Identification of DEGs
Differential expression analysis in GSE34198 was performed using the limma package [13]. After dividing the samples in the dataset into two groups based on the gender, the download-ed express matrix of each dataset was sent to limma to compute the p-value and log2 fold change of each gene and picked up the signifi -cantly DEGs under the threshold of p-value < 0.01 and |log2 fold change| > 1.5. Among them, those with log2 fold change > 1.5 were defined as upregulated genes while others were defined as downregulated genes.
GO and KEGG pathway enrichment
https://david.ncifcrf.gov/) to investigate the functions of these gene signatures [15, 16]. The pathway analyses of these gene signa- tures based on Kyoto Encyclopedia of Genes and Genomes database (KEGG, available at: http://www.genome.jp/kegg/) were also per-formed [17] using DAVID. A p value less than 0.01 was selected as the threshold.
GSEA analysis
As a second generation method for pathway enrichments, GSEA derives a score from all ge- nes that belong to a given gene set based on the expression matrix and group list input [18].
Identification of DEGs
According to our threshold in this research, 568 significant DEGs were detected in male patients compared with female patients, among which there were 215 upregulated genes and 353 downregulated genes (Supplementary Table 1). The ratio of upregulated gene counts to down-regulated genes counts was 1:1.64.
GO enrichment
[image:3.612.92.337.85.531.2]The results of GO and KEGG enrichment of the DEGs are shown in Table 2, respectively.
Table 1. Baseline characteristics of patients
Characteristic Male patients (N = 30) n* Female patients (N = 15) n* P value
Age (year) 61.90 (7.46) 69.39 (10.49) 0.008
Height (cm) 171.93 (7.22) 155 (5.86) < 0.001
Weight (kg) 92.85 (12.59) 68.08 (16.91) < 0.001
Sbp (mmhg) 135.63 (14.34) 130.83 (20.98) 0.456
Dbp (mmhg) 80.38 (9.04) 73.83 (11.14) 0.137
Diabetes status 0.111
Yes 7 (23.3%) 7 (46.7%) No 23 (76.7%) 8 (53.3%)
Smoking status 0.076
Yes 9 (30.0%) 1 (6.7%)
No 21 (70.0%) 14 (93.3%)
Acei 0.833
Yes 15 (50.0%) 7 (46.7%)
No 15 (50.0%) 8 (53.3%)
Betablockers 0.138
Yes 11 (36.7%) 9 (60.0%)
No 19 (63.3%) 6 (40.0%)
Diuretics 0.153
Yes 10 (33.3%) 2 (13.3%)
No 20 (66.7%) 13 (86.7%)
Ca blockers 0.180
Yes 12 (40.0%) 3 (20.0%)
No 18 (60.0%) 12 (80.0%)
Statins 0.128
Yes 9 (30.0%) 8 (53.3%)
No 21 (70.0%) 7 (46.7%)
Fibrates 0.041
Yes 0 (0.0%) 2 (13.3%)
No 30 (100.0%) 12 (86.7%)
Other medication 0.035
Yes 12 (40.0%) 11 (73.3%)
No 18 (60.0%) 4 (26.7%)
*For continuous variables: mean (sd).
Thus, it eliminates the arbitrary in determining the threshold of signifi -cantly DEGs and has many advantag- es over GO and KEGG. Here, we per-formed GSEA analyses between male patients and female patients based on GO gene sets and curated gene sets downloaded from Molecular Signatur- es Database (available at: http://soft-ware.broadinstitute.org/gsea/msigdb) respectively [19]. Gene sets with gene ratio ≥ 0.9 and p-value < 0.01 in each analysis were recognized as signifi -cantly differentially expressed path-ways and visualized in the dot plot gen-erated using the ggplot2 packages in R software (available at: http://www.R-project.org/). The ES score plots of the top 3 significantly differentially ex-pressed pathways in each analysis according to the net ES score were also shown.
PPI network construction
To comprehend the interaction of the proteins encoded by the DEGs is very important. Thus, we first obtained functional interactions between the DEGs using STRING database [20]. The protein-protein interaction (PPI) networks were visualized by Cytoscape (version 3.4.0) based on this informa-tion [21]. Only nodes with combined score > 0.400 and nodes degree ≥ 10 were reserved in the PPI networks. In the PPI network of all differentially genes, genes with nodes degree ≥ 25 were considered as hub genes.
According to GO analysis, differentially expre- ssed genes between male and female patients were significantly enriched in positive regula -tion of interferon-beta produc-tion, response to light stimulus, response to virus, negative regu-lation of cell growth, positive reguregu-lation of in- terferon-alpha production, positive regulation of synaptic transmission, establishment of pro-tein localization, intracellular transport of viral protein in host cell and cilium assembly in Biological Process category, cytoplasm, cyto-sol, nucleoplasm and host cell in Cell Compo- nent category, as well as protein binding, heli-case activity, poly(A) RNA binding in Molecular Function category. RNA degradation pathway was also significantly differentially expressed between male and female patients according to the results of KEGG enrichment. Supple- mentary Table 2 demonstrates DEGs in each GO terms and KEGG pathways.
GSEA analysis
The results of GSEA analyses based on GO gene sets and curated gene sets are shown in
Figures 1 and 2, respectively. The top 3 signifi -cantly differentially expressed pathways identi-fied in the analysis based on GO gene sets included GO T CELL MEDIATED IMMUNITY (NES = 1.86, p-value < 0.001), GO RRNA BINDING (NES = 1.81, p-value = 0.006) and GO SULFUR COMPOUND TRANSPORT (NES = 1.81, p-value
= 0.004), while those identified in the analysis based on curated gene sets were HOWLIN CITED1 TARGETS 1 UP (NES = -2.04, p-value < 0.001), AMIT EGF RESPONSE 40 HELA (NES = -1.98, p-value < 0.001) and CHEN ETV5 TAR- GETS SERTOLI (NES = -1.95, p-value = 0.002). PPI network and hub-genes
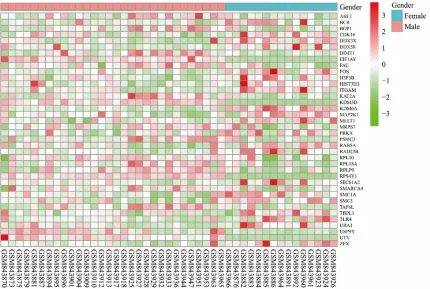
The PPI networks of all DEGs, are shown in
Figure 3. There were 39 nodes and 137 edges in the PPI network of all DEGs. Supplementary Table 3 demonstrates the significantly differen -tially expressed GO terms and KEGG pathways that contained the nodes in PPI network. The heatmap of the nodes in PPI network is shown in Figure 4. The PPI network of all differential- ly genes contained 4 hub genes according to our criterion, including FOS, UTY, KDM6A, and SMARCA4.
Discussion
Currently, CAD has become the leading cause of death in the world due to the unhealthy lifestyles. There are significant differences in the incidence, prognosis pathophysiology, clini-cal presentation, and cliniclini-cal outcomes of AMI between men and women [4]. However, the management of AMI are same for male and female patients, which mainly includes revas-cularization (thrombolytic therapy, primary PCI and CABG Surgery) and medical therapy
(anti-Table 2. Significantly enriched GO terms and KEGG pathway
Category GO ID/ KEGG ID GO term/ KEGG pathway Total gene counts countsGene p value
Biological Process GO:0032728 Positive regulation of interferon-beta production 31 6 < 0.001 GO:0009416 Response to light stimulus 275 5 0.0012 GO:0009615 Response to virus 247 11 0.0013 GO:0030308 Negative regulation of cell growth 168 11 0.0027 GO:0032727 Positive regulation of interferon-alpha production 22 4 0.0043 GO:0050806 Positive regulation of synaptic transmission 312 4 0.0055 GO:0045184 Establishment of protein localization 1860 6 0.0056 GO:0019060 Intracellular transport of viral protein in host cell 6 3 0.0079 GO:0042384 Cilium assembly 283 10 0.0099 Cell Component GO:0005737 Cytoplasm 10415 179 0.0015
GO:0005829 Cytosol 2982 119 0.0031
GO:0005654 Nucleoplasm 2392 100 0.0074
GO:0043657 Host cell 19 3 0.0075
Molecular Function GO:0005515 Protein binding 8578 297 < 0.001
GO:0004386 Helicase activity 142 9 0.0031
GO:0044822 Poly(A) RNA binding 1617 49 0.0044
[image:4.612.94.522.85.320.2]platelet agents, β-blockers, ACE inhibitors, an-giotensin receptor blockers, and statins) [22]. Treated by similar therapy, male and female patients achieved different outcome [23]. Th- erefore, the American Heart Association has urged us to pay attention to sex disparities in patients with AMI in 2016 [4].
In this study, the gene expression profile GSE34198 was re-analyzed to identify DEGs and differentially expressed pathways between male and female patients with AMI. The base-line characteristics shown in Table 1 were
simi-lar between the two groups, so it was reason-able for us to perform this analysis. A total of 568 DEGs were detected in male patients com-pared to female patients with AMI, including 215 upregulated genes and 353 downregulat-ed genes.
[image:5.612.97.514.73.504.2]female patients with those between normal
[image:6.612.92.515.73.626.2]male and female. Our results shown in Table 3 show that only a little part of genes and path-ways were overlapping. It suggests that the Figure 2. Significantly differentially expressed pathways identified by GSEA analyses based on curated gene sets. A. The dot plot of significantly differentially expressed pathways identified by analysis based on curated gene sets; B. The ES score plots of the top 3 significantly differentially expressed pathways identified by analysis based on
Figure 3. PPI network of all DEGs. The upregulated genes were shown in red while downregulated ones are shown in blue.
[image:7.612.93.523.400.689.2]gene expression differences we detected may help us illustrate gender differences better and provide some evidence for gender-specific tar -get therapy, even though to date we have not found any of present drugs mentioned above targets the hub genes and pathways detected by us.
Most of the significantly up-regulated pathways were related to the function of the ribosomes, including biosynthesis, transportation and lo- calization of the proteins. Several studies have reported that ribosomes increase significantly in cardiomyocytes of the MI rats and may con-tribute to the reparation and compensatory hypertrophy [24]. In recent studies, the role of ribosomal biogenesis in reducing cardiomyo-cyte apoptosis as well as protecting and repair-ing the myocardium has been proved, and func-tion of ribosome has been used as a marker for myocardial reparation and stem cell activation [25, 26]. From our perspective, the differential-ly expressed pathways related to the function of ribosome indicates that male patients pos-sess stronger repair and compensatory capac-ity than female patients in the early stage of CAD, which is corresponding to the phenome-non that the initial presentation of CAD is often angina in women under 70 years old and MI in men at the same age. However, some studies have argued that the numbers of ribosomes were decreased or highly variable in AMI pa- tients and the expression of pathways related to the ribosome were down-regulated or uncer-tain [9, 27-29]. The possible explanation for this conflict is that patients or animal models with different stages and severity of the disease
endothelium and migrate into the intima, which can intensify the inflammatory response and thus worsen disease development [30, 31]. However, the conclusions are still conflicting [32-34]. Two pathways pertaining to the cell growth and proliferation including negative reg-ulation of cell growth and Amit EGF response 40 HeLa were also differentially expressed. They may be related to abnormal proliferation of the smooth muscle cells of the media and the regeneration of the cardiomyocytes that are of great importance in the progression and recovery of CAD.
Four hub genes were identified in the PPI net -work according to our threshold, including FOS, UTY, KDM6A, and SMARCA4. Among them, FOS has been reported to be up-regulated in the smooth muscle cells in atherosclerotic plaque and related to abnormal proliferation of the smooth muscle cells of the media [35] as well as the vascular calcification [36]. As a tran -scription factor related to immune response, FOS also facilitates the expression of tissue factor that promote the inflammatory process, which plays a crucial role in myocardial lesions and is involved in the pathogenesis of AMI as well [37, 38]. When considering the gender dif-ferences in AMI, some researchers attribute them to sex hormones, especially estrogen. Hormonal influence on the expression of FOS has been observed. Estrogen can downregu-late the expression of FOS and protect the heart in female patients [39]. Interestingly, FOS was overexpressed among our female patients, the average age of whom were 61.9 years. Postmenopausal females have insuffi
-Table 3. Number of differentially expressed genes and pathways
Items Numbers in control
group Numbers in patients group Numbers of overlapping ones
Differentially Expressed Genes 333 568 59
GO Enrichment 7 16 0
GO BP 3 9 0
GO MF 2 3 0
GO CC 2 4 0
KEGG Analysis 5 1 0
GSEA 369 115 13
Curated gene sets 43 70 7
GO gene sets 326 45 6
Nodes of PPI network 22 39 9
[image:8.612.92.349.97.264.2]cient estrogen, so its impact on FOS were rever-sal, which is corresponding to our results. In addition, estrogen can provide female with pro-tection in many other aspects. For example, ER-β can mediate PI3K/Akt and anti-apoptotic signaling in the myocardium which upregulated Bcl-2 and downregulated Bax, caspase-3 and caspase-8. It can also suppress apoptosis of myocardiocytes [40]. Furthermore, estrogens can stimulate the expression of endothelial NO synthase (eNOS). Through releasing of nitric oxide, coronary arteries can be relaxed and endothelial function of peripheral resistance arteries can be restored directly [41]. Higher content of eNOS also suppresses L-type calci-um channels and thus prevents calcicalci-um over-load, one of the main causes of ischemia/ reperfusion injury [42]. Notably, the action of estrogen is controlled by Class II histone de- acetylases which works through direct interac-tion with estrogen receptor repressing MEF2 to decrease the expression of estrogen receptor [43].
Not only sex hormones, but sex chromosomes can also cause sex differences in patients with AMI. KDM6A, a gene on the human X chromo-some, is one of two histone demethylases known as the X escapees. Therefore, expres-sion of KDM6A is generally higher in female compared with male [44] and it has been thought to be responsible for more severe is- chemia/reperfusion injury in female patients compared with male. Since the risk of MI is much higher in young men than women at the same age, it may be a very useful protection mechanism in men. UTY is a male-specific gene located on male-specific region of the human Y chromosome, and its down-regulation together with PRKY in macrophages was observed in haplogroup I [45]. UTY encodes one of the his-tocompatibility antigens recognized by T cells [46], while PRKX, functional homolog on the X chromosome, encodes one of cAMP-dependent kinases and is thought to be involved in matu-ration of macrophage and development of kid-ney [47]. They increase the risk of CAD throu- gh depressing adaptive immunity pathway and activating proinflammatory response pathway in haplogroup I.
As for SMARCA4, the relation between its genetic polymorphisms and CAD has been extensively studied [48, 49]. Some SNPs in the SMARCA4 like rs11879293, rs12232780,
rs4300767, rs10417578 and rs1122608 have been associated with a decreased risk of CAD. Recently Nakatochi et al. identified a DNA methylation site in SMARCA4 (cg17218495) that is associated with MI [50]. That means the development of AMI may be influenced by changes in these methylation site in SMARCA4. However, there are also some limitations in our study. First, the number of the samples enrolled was too small and no information on when the samples were collected is provided. Second, the characteristics of male and female patients other than gender was not strictly the same, and other covariates may also affect the patient’s gene expression. Third, because of the limited sample size (< 3) in AIMD6 group who did not survive 6 months, all patients were regarded as the same AMI group rather than being divided into two groups based on 6-month follow up period as Valenta et al. did. That means we couldn’t explore gender specific dif -ferences in both cases (AMI vs AMID6) in detail. Fourth, our study was only carried out based on bioinformatics methods and the experimental evidences to prove our conclusions was lack-ing. Moreover, the mechanisms of those path-ways and hub genes identified in our study on AMI were not clearly understood so more stud-ies are still needed to further understand the differences between men and women in terms of AMI.
In conclusion, our bioinformatics analysis of public microarray data, GSE34198, provides a global view of the gene expression differences between male and female patients with AMI, including DEGs and their interaction. The differ-entially expressed pathways are mainly involved in the function of ribosomes, virus, and related immune response as well as the cell growth and proliferation, and the function of the identi-fied hub genes in AMI were related to the sex hormone and sex chromosomes. Our study can help explain differences between men and women in the incidence and the prognosis of AMI. This might be useful in clinical practice to establish gender-specific therapy for AMI. However, our study also has some limitation, so further studies are still needed to verify our results and clarify the relevant mechanisms.
Acknowledgements
qiang Zhou and Kaibin Yang acquired and ana-lyzed the data; Yuanzhe Zhang, Xiaoyue Wei, and Yiyan Song worked with the figures and tables; Zeting Qiu, Si Li, Qinchang Chen and Wulin Tan revised the paper; Huaqiang Zhou, Kaibin Yang and Shaowei Gao wrote the pa- per. All authors listed have approved the final article.
Disclosure of conflict of interest
None.
Abbreviations
CAD, Coronary artery disease; AMI, acute myo-cardial infarction; DEGs, differentially expre- ssed genes; GEO, Gene Expression Omnibus; GO, Gene ontology database; DAVID, Database for Annotation, Visualization, and Integrated Discovery; KEGG, Kyoto Encyclopedia of Genes and Genomes database; PPI, protein protein interaction; eNOS, endothelial NO synthase.
Address correspondence to: Drs. Wulin Tan and Zhongxing Wang, Department of Anesthesiology,
The First Affiliated Hospital of Sun Yat-sen
Univer-sity, 58 Zhongshan 2 Road, Guangzhou 510080, China. Tel: +86-135-703-04705; E-mail: [email protected] (WLT); Tel: +86-136-000-49116; E-mail: [email protected] (ZXW)
References
[1] Ambrose JA and Singh M. Pathophysiology of coronary artery disease leading to acute coro-nary syndromes. F1000Prime Rep 2015; 7: 08.
[2] Matsuzawa Y and Lerman A. Endothelial dys-function and coronary artery disease: assess-ment, prognosis, and treatment. Coron Artery Dis 2014; 25: 713-724.
[3] Benjamin EJ, Blaha MJ, Chiuve SE, Cushman M, Das SR, Deo R, de Ferranti SD, Floyd J, For-nage M, Gillespie C, Isasi CR, Jimenez MC, Jor-dan LC, Judd SE, Lackland D, Lichtman JH, Lisabeth L, Liu S, Longenecker CT, Mackey RH, Matsushita K, Mozaffarian D, Mussolino ME, Nasir K, Neumar RW, Palaniappan L, Pandey DK, Thiagarajan RR, Reeves MJ, Ritchey M, Rodriguez CJ, Roth GA, Rosamond WD, Sasson
C, Towfighi A, Tsao CW, Turner MB, Virani SS,
Voeks JH, Willey JZ, Wilkins JT, Wu JH, Alger HM, Wong SS and Muntner P. Heart disease and stroke statistics-2017 update: a report from the American heart association. Circula-tion 2017; 135: e146-e603.
[4] Mehta LS, Beckie TM, DeVon HA, Grines CL, Krumholz HM, Johnson MN, Lindley KJ, Vacca-rino V, Wang TY, Watson KE and Wenger NK. Acute myocardial infarction in women: a
scien-tific statement from the American heart asso -ciation. Circulation 2016; 133: 916-947. [5] Lerner DJ and Kannel WB. Patterns of coronary
heart disease morbidity and mortality in the sexes: a 26-year follow-up of the Framingham population. Am Heart J 1986; 111: 383-390. [6] Kim J, Ghasemzadeh N, Eapen DJ, Chung NC,
Storey JD, Quyyumi AA and Gibson G. Gene
ex-pression profiles associated with acute myo -cardial infarction and risk of cardiovascular death. Genome Med 2014; 6: 40.
[7] Valenta Z, Mazura I, Kolář M, Grünfeldová H, Feglarová P, Peleška J, Tomečková M, Kalina J,
Slovák D and Zvárová J. Determinants of ex-cess genetic risk of acute myocardial infarc-tion-a matched case-control study. Eur J Bio- med Inform 2012; 8: 34-43.
[8] Soneson C and Delorenzi M. A comparison of methods for differential expression analysis of RNA-seq data. BMC Bioinformatics 2013; 14: 91.
[9] Gavrish AS, Piatova ZhA. [Cardiomyocyte
ultra-structure in nonextreme coronary insufficien -cy]. Kardiologiia 1979; 19: 75-79.
[10] Davis S and Meltzer PS. GEOquery: a bridge between the Gene Expression Omnibus (GEO) and BioConductor. Bioinformatics 2007; 23: 1846-1847.
[11] Mark Dunning AL, Matthew Eldridge. Illumina-Humanv2.db: Illumina HumanWG6v2 annota-tion data (chip illuminaHumanv2). R package version 1.26.0. 2015.
[12] Troyanskaya O, Cantor M, Sherlock G, Brown P, Hastie T, Tibshirani R, Botstein D and Altman RB. Missing value estimation methods for DNA microarrays. Bioinformatics 2001; 17: 520-525.
[13] Ritchie ME, Phipson B, Wu D, Hu Y, Law CW, Shi W and Smyth GK. limma powers differen-tial expression analyses for RNA-sequencing and microarray studies. Nucleic Acids Res 2015; 43: e47.
[14] Ashburner M, Ball CA, Blake JA, Botstein D, Butler H, Cherry JM, Davis AP, Dolinski K, Dwight SS, Eppig JT, Harris MA, Hill DP, Issel-Tarver L, Kasarskis A, Lewis S, Matese JC, Richardson JE, Ringwald M, Rubin GM and
Sherlock G. Gene ontology: tool for the unifica -tion of biology. The gene ontology consortium. Nat Genet 2000; 25: 25-29.
[15] Huang da W, Sherman BT and Lempicki RA. Systematic and integrative analysis of large gene lists using DAVID bioinformatics resourc-es. Nat Protoc 2009; 4: 44-57.
the comprehensive functional analysis of large gene lists. Nucleic Acids Res 2009; 37: 1-13. [17] Kanehisa M, Furumichi M, Tanabe M, Sato Y
and Morishima K. KEGG: new perspectives on genomes, pathways, diseases and drugs. Nu-cleic Acids Res 2017; 45: D353-D361. [18] Tarca AL, Bhatti G and Romero R. A
compari-son of gene set analysis methods in terms of
sensitivity, prioritization and specificity. PLoS
One 2013; 8: e79217.
[19] Subramanian A, Tamayo P, Mootha VK, Muk- herjee S, Ebert BL, Gillette MA, Paulovich A, Pomeroy SL, Golub TR, Lander ES and Mesirov JP. Gene set enrichment analysis: a knowl-edge-based approach for interpreting
genome-wide expression profiles. Proc Natl Acad Sci U
S A 2005; 102: 15545-15550.
[20] Shannon P, Markiel A, Ozier O, Baliga NS, Wang JT, Ramage D, Amin N, Schwikowski B and Ideker T. Cytoscape: a software environ-ment for integrated models of biomolecular interaction networks. Genome Res 2003; 13: 2498-2504.
[21] Smoot ME, Ono K, Ruscheinski J, Wang PL and Ideker T. Cytoscape 2.8: new features for data integration and network visualization. Bioinfor-matics 2011; 27: 431-432.
[22] Shavelle DM. Almanac 2015: coronary artery disease. Heart 2016; 102: 492-499.
[23] Regitz-Zagrosek V, Schubert C and Kruger S. [Sex differences in cardiovascular drug target-ing]. Internist (Berl) 2008; 49: 1383-1386, 1388-1390.
[24] Larsen TH, Hesketh JE, Rotevatn S, Greve G and Saetersdal T. Ribosome distribution in normal and infarcted rat hearts. Histochem J 1994; 26: 79-89.
[25] Zhao S, Xia Y, Zhang F, Xiong Z, Li Y, Yan W, Chen X, Wang W, Wang H, Gao E, Lee Y, Li C, Wang S, Zhang L and Tao L. Nucleostemin dys-regulation contributes to ischemic vulnerability of diabetic hearts: role of ribosomal biogene-sis. J Mol Cell Cardiol 2017; 108: 106-113. [26] Dutta P, Sager HB, Stengel KR, Naxerova K,
Courties G, Saez B, Silberstein L, Heidt T, Se-bas M, Sun Y, Wojtkiewicz G, Feruglio PF, King K, Baker JN, van der Laan AM, Borodovsky A, Fitzgerald K, Hulsmans M, Hoyer F, Iwamoto Y, Vinegoni C, Brown D, Di Carli M, Libby P, Hiebert SW, Scadden DT, Swirski FK, Weissled-er R and Nahrendorf M. Myocardial infarction activates CCR2(+) hematopoietic stem and progenitor cells. Cell Stem Cell 2015; 16: 477-487.
[27] Gudbjarnason S, Deschryver C, Chiba C, Ya-manaka J and Bing RJ. Protein and nucleic acid synthesis during the reparative processes following myocardial infarction. Circ Res 1964; 15: 320-326.
[28] Li H, Zhong XL, Li CM, Peng LJ, Liu W, Ye MX and Tuo BX. Analysis of pathways and networks
influencing the differential expression of genes
in coronary artery disease. Archives of Biologi-cal Sciences 2014; 66: 983-988.
[29] Maskoliunas RK, Lekis AV, Kovalenko MI, El’skaia AV and Lukoshiavichius L. [Various characteristics of protein-synthesizing appara-tus of the myocardium during total ischemia]. Vopr Med Khim 1990; 36: 7-10.
[30] Ait-Oufella H, Taleb S, Mallat Z and Tedgui A. Recent advances on the role of cytokines in atherosclerosis. Arterioscler Thromb Vasc Biol 2011; 31: 969-979.
[31] Ilhan F and Kalkanli ST. Atherosclerosis and the role of immune cells. World J Clin Cases 2015; 3: 345-52.
[32] Domont F and Cacoub P. Chronic hepatitis C virus infection, a new cardiovascular risk fac-tor? Liver Int 2016; 36: 621-627.
[33] Petta S. Hepatitis C virus and cardiovascular: a review. J Adv Res 2017; 8: 161-168.
[34] Wijarnpreecha K, Thongprayoon C, Panjawata- nan P and Ungprasert P. Hepatitis B virus in- fection and risk of coronary artery disease: a meta-analysis. Ann Transl Med 2016; 4: 423. [35] Lavezzi AM, Milei J, Grana DR, Flenda F,
Basel-lini A and Matturri L. Expression of c-fos, p53 and PCNA in the unstable atherosclerotic ca-rotid plaque. Int J Cardiol 2003; 92: 59-63. [36] Doherty TM, Fitzpatrick LA, Shaheen A,
Raja-vashisth TB and Detrano RC. Genetic
determi-nants of arterial calcification associated with
atherosclerosis. Mayo Clin Proc 2004; 79: 197-210.
[37] Liu Y, Pelekanakis K and Woolkalis MJ. Throm-bin and tumor necrosis factor alpha synergisti-cally stimulate tissue factor expression in hu-man endothelial cells: regulation through c-Fos and c-Jun. J Biol Chem 2004; 279: 36142-36147.
[38] Zhang S, Zhang M, Goldstein S, Li Y, Ge J, He B and Ruiz G. The effect of c-fos on acute
myo-cardial infarction and the significance of meto -prolol intervention in a rat model. Cell Biochem Biophys 2013; 65: 249-55.
[39] Ueyama T, Kasamatsu K, Hano T, Tsuruo Y and Ishikura F. Catecholamines and estrogen are involved in the pathogenesis of emotional stress-induced acute heart attack. Ann N Y Acad Sci 2008; 1148: 479-485.
[40] Wang M, Wang Y, Weil B, Abarbanell A, Her-rmann J, Tan J, Kelly M and Meldrum DR. Estro-gen receptor beta mediates increased activa-tion of PI3K/Akt signaling and improved myo- cardial function in female hearts following acute ischemia. Am J Physiol Regul Integr Comp Physiol 2009; 296: R972-978.
[41] Piro M, Bona RD, Abbate A, Biasucci LM and Crea F. Sex-related differences in myocardial remodeling. J Am Coll Cardiol 2010; 55: 1057-65.
as-pects. Exp Biol Med (Maywood) 2009; 234: 1011-1019.
[43] van Rooij E, Fielitz J, Sutherland LB, Thijssen VL, Crijns HJ, Dimaio MJ, Shelton J, De Windt LJ, Hill JA and Olson EN. Myocyte enhancer fac-tor 2 and class II histone deacetylases control
a gender-specific pathway of cardioprotection
mediated by the estrogen receptor. Circ Res 2010; 106: 155-165.
[44] Li J, Chen X, McClusky R, Ruiz-Sundstrom M, Itoh Y, Umar S, Arnold AP and Eghbali M. The
number of X chromosomes influences protec -tion from cardiac ischaemia/reperfusion injury in mice: one X is better than two. Cardiovasc Res 2014; 102: 375-384.
[45] Bloomer LD, Nelson CP, Eales J, Denniff M,
Christofidou P, Debiec R, Moore J; Cardiogen -ics Consortium, Zukowska-Szczechowska E, Goodall AH, Thompson J, Samani NJ, Charchar
FJ, Tomaszewski M. Male-specific region of the
y chromosome and cardiovascular risk: phylo-genetic analysis and gene expression studies. Arterioscler Thromb Vasc Biol 2013; 33: 1722-7.
[46] Warren EH, Gavin MA, Simpson E, Chandler P, Page DC, Disteche C, Stankey KA, Greenberg PD and Riddell SR. The human UTY gene en-codes a novel HLA-B8-restricted H-Y antigen. J Immunol 2000; 164: 2807-2814.
[47] Li X, Li HP, Amsler K, Hyink D, Wilson PD and Burrow CR. PRKX, a phylogenetically and func-tionally distinct cAMP-dependent protein ki-nase, activates renal epithelial cell migration and morphogenesis. Proc Natl Acad Sci U S A 2002; 99: 9260-9265.
[48] Guo X, Wang XH, Wang Y, Zhang CY, Quan XH, Zhang Y, Jia S, Ma WD, Fan YJ and Wang CX. Variants in the SMARCA4 gene was associated with coronary heart disease susceptibility in Chinese han population. Oncotarget 2017; 8: 7350-7356.
[49] Fujimaki T, Oguri M, Horibe H, Kato K, Matsuo-ka R, Abe S, Tokoro F, Arai M, Noda T, Wata-nabe S and Yamada Y. Association of a tran-scription factor 21 gene polymorphism with hypertension. Biomed Rep 2015; 3: 118-122. [50] Nakatochi M, Ichihara S, Yamamoto K, Naruse
Supplementary Table 2. DEGs in each GO terms and KEGG pathways
Category Term Differentially expressed genes
GO BP GO:0032728~positive regulation of
interferon-beta production DDX58, HMGB2, DDX3X, ZC3HAV1, TBK1, TLR4 GO:0009416~response to light
stimulus FOS, SLC4A10, SLC1A3, DUSP1, POLG
GO:0009615~response to virus DDX58, IFIT2, CCDC130, IFIT1, DDX3X, ZC3HAV1, TBK1, XPR1, DHX36, IVNS1ABP, CHUK GO:0030308~negative regulation
of cell growth RTN4, ACVRL1, DDX3X, SFRP1, NAIF1, FRZB, GNG4, SMARCA4, ADAM15, SERTAD2, SLIT3
GO:0032727~positive regulation of
interferon-alpha production DDX58, ZC3HAV1, TBK1, TLR4 GO:0050806~positive regulation of
synaptic transmission SYT1, SLC1A3, CLSTN3, LGI1
GO:0045184~establishment of
protein localization DERL1, RCC2, WDPCP, DZIP1, SMYD3, ABL1
GO:0019060~intracellular
transport of viral protein in host cell IFIT1, DERL1, DYNLT1
GO:0042384~cilium assembly SNAP29, SCLT1, CEP162, WDPCP, IFT20, TTC26, DZIP1, CCDC113, RAB3IP, FUZ
GO CC GO:0005737~cytoplasm FAM200B, LDHA, ZC3HAV1, CHMP4B, TUFT1, TBK1, DZIP1, FAM110B, DSTYK, CCT2, TLR4, MED22, TXLNA, PRKX, MAGEC2, CRYGC, MCOLN3, RPLP0, PHTF1, DHX36, TGS1, CUTC, SDR9C7, TBPL1, NCBP3, NUDT16, GTPBP6, MADD, ZHX2, MLXIPL, PNPLA1, BASP1, KIAA0753, AHR, FAAP100, NABP1, CEP162, SPAG6, ARRB1, TNFAIP8, PUDP, CNTROB, SNTG1, HARS, SLU7, HAS2, CELF1, PIDD1, TRAPPC2, RAD23B, ZFAND5, COASY, MRPS16, HMGB2, MPLKIP, LITAF, TDRD6, LCE1B, BOP1, CCNG2, FUZ, FAM65A, T, ARG1, BLOC1S4, PSMB7, AGGF1, DDX3X, RASAL3, ZDHHC9, SCARB1, DNAAF5, ERCC6L, CRIP1, CARD9, OSGEP, MAP2K1, EPAS1, OSBPL9, SMYD3, SAP18, BRIP1, TOMM40, GCN1, AIM2, DDX6, FXR1, TNKS1BP1, DDX58, TNFSF11, SYNE2, PSMC3, UBA1, ETS2, DDX59, GRK5, FBXO34, ABL1, SMC1A, AHSA1, BTBD11, DNAL4, LRRC8E, RITA1, ELF2, EDC4, PAWR, CDK16, CCDC106, CHUK, NT5C, SERTAD2, RAMP2, ANKS1A, HERC6, FLNB, ECT2, NLRP2, C6ORF89, NAPRT, EML3, XPC, MAST2, TNFSF13B, TAF15, DACT2, BNIP2, WRAP53, CARD17, UBE2M, RAB5A, AICDA, FOXC1, TMSB4Y, MAPRE3, KPNA1, SRGAP1, CAPS, SNAP29, IRX3, USP9Y, EPB41L4A, IVNS1ABP, DT-NBP1, TRIB1, DIMT1, EXOSC10, WDR18, MTMR1, WDPCP, POU2F2, SPATA2, TEKT2, MLLT1, AATF, MAGEA11, GPS1, DGKQ, GSTA5, LRRC41, OTULIN, SPATA5L1, ETF1, EXO5, SMC3, IRF9, IFIT2, ATXN2, MEF2D, NDOR1, IFIT1, DUSP1, CCDC113, MAPK8IP2, ATP6V0A1, SPG11, RBM14, GCA, ACTR10
GO:0005654~nucleoplasm FAM200B, DZIP1, CBX4, KDM1A, HOXC8, FAU, HIST3H3, TGS1, CCNA1, NUDT16, POLE, ZHX2, MLXIPL, SP140, AHR, NVL, NABP1, FAAP100, CEP162, ARRB1, SLU7, CELF1, PIDD1, SMARCA4, COASY, RAD23B, HMGB2, MPLKIP, LITAF, BOP1, PLAGL1, PSMB7, DDX49, ERCC6L, EPAS1, SMYD3, SAP18, BRIP1, TOMM40, MSL3, TNKS1BP1, SYNE2, PSMC3, ETS2, POLD2, H3F3B, FBXO34, ABL1, SMC1A, NCOR1, HIST1H3I, NBN, KDM6A, ELF1, ELF2, UTY, TIMM17A, EDC4, FOS, MCM8, DNAJC14, CCDC106, CHUK, PSMD8, KDM5D, ANKS1A, RRP36, SNAPC4, PRPF4, SENP2, XPC, TAF15, NAIF1, RPS4Y1, FOXC1, CPSF4, KPNA1, PPP2R2A, SNU13, IVNS1ABP, EXOSC10, DIMT1, WDR18, ERCC6, POU2F2, MLLT1, CC2D1B, MAGEA11, GPS1, KAT2A, PHF12, EXO5, SMC3, SF3A3, IRF9, MEF2D, ATXN2, CCDC113, ATP6V0A1, RBM14
GO:0043657~host cell IFIT1, DERL1, DYNLT1
GO MF GO:0005515~protein binding SYT1, LDHA, STAR, DZIP1, VPS54, CCT2, CD53, MED22, SLC52A2, PRKX, MAGEC2, IFT20, EIF1AX, RPLP0, EIF1AY, RPL10, DHX36, GNG4, CCNA1, TBPL1, MVB12B, BCR, POLG, ZHX2, PTPRS, TAF6L, GCC2, MRM3, FAAP100, CCDC130, CEP162, RCC2, F5, CNTROB, PIDD1, NUP43, SURF1, TRAPPC2, RAD23B, COASY, MAGEA8, CCDC92, BOP1, FAM19A4, TJAP1, HADHA, FUZ, AGGF1, KBTBD6, KBTBD7, TNKS, STX11, TCF25, MAP2K1, SPHK2, ATP11B, TREX1, FXR1, DDX6, FAM90A1, CD55, SYNE2, RPL18A, SFRP1, UBA1, CSRNP2, ETS2, IGFL1, H3F3B, GRK5, SPNS1, AHSA1, NCOR1, RTN4, ELF1, SPG7, ELF2, ACVRL1, AP2S1, GOLGA7, P4HA3, HIST1H1E, SLC25A6, FUNDC1, ERLIN1, SLC3A1, MAPK1IP1L, FLNB, NAPRT, MXD4, SENP2, MAST2, TAF15, BNIP2, RAB5A, NAIF1, ZSCAN16, AICDA, FOXC1, SEMA4D, TMSB4Y, C10ORF62, SRGAP1, PRPF38A, ADAM15, SNAP29, CAB39L, WASH1, SNU13, ABHD1, WDR18, CFAP58, COL7A1, SPATA2, MLLT1, APBA2, CC2D1B, AATF, PHLDA1, ZNF564, IL18R1, SLC8A1, DGKQ, SPSB1, AIMP2, AFF1, PHF12, ETF1, MARCH5, SF3A3, MRPL23, RASSF4, MEF2D, DUSP1, ATP6V0A1, LRP8, PXYLP1, RBM14, SPG11, ZC3HAV1, CHMP4B, CEP76, TUFT1, TBK1, TSPAN4, IL18, CBX4, TLR4, CSPG5, TXLNA, CNOT4, KDM1A, CRYGC, RALB, RABGEF1, AKR7A2, ASPH, LGI1, LONRF1, TGS1, HIST3H3, CUTC, NCBP3, SARAF, MADD, TNFRSF14, BASP1, KIAA0753, AHR, SP140, NVL, ASCL1, NABP1, ARRB1, FBXO18, CST5, CT55, TNFAIP8, SLU7, CELF1, PRPS2, SMARCA4, ZFAND5, TMEM199, HMGB2, MRPS16, MPLKIP, DERL1, LITAF, SNX5, LCE1B, ITGAM, ZNF330, PSMB7, BLOC1S4, TCERG1, DDX3X, PRR3, NUMB, FBXW4, DNAJA1, SCARB1, SSX3, B4GALT7, SRGN, ERCC6L, GABRD, CARD9, EPAS1, GALT, TOMM40, BRIP1, SAP18, AIM2, DDX58, MLK4, PSMC3, POLD2, MYH11, FBXO33, SMC1A, ABL1, FBXO34, DNAL4, HIST1H3I, ZKSCAN7, LRRC8E, SAT1, RITA1, NBN, EDC4, PAWR, RAB3IP, SLA, NDUFS7, FOS, MCM8, KIAA0040, LBP, CDK16, KIRREL2, CCDC106, CHUK, ARL2, RAMP2, ANKS1A, MIEF1, COX4I1, DYNLT1, ALK, PRPF4, ECT2, NLRP2, C6ORF89, XPC, TNFSF13B, BTG2, WRAP53, SLC41A3, UBE2M, TXNRD2, KLHL12, CPSF4, MAPRE3, KPNA1, PPP2R2A, GDAP2, ECHS1, PF4, DTNBP1, TRIB1, EXOSC10, PATL1, ERCC6, SHISA5, TOR1B, MAGEA11, SCNN1D, GPS1, KAT2A, WDTC1, OTULIN, TSPAN15, SMC3, ATXN7L3, IRF9, IFIT2, NDOR1, ATXN2, IFIT1, TMEM43, CCDC113, CSGALNACT2, MAPK8IP2, DSC2, GCA, ACTR10
GO:0004386~helicase activity DDX58, MCM8, ERCC6, DDX3X, FBXO18, DHX36, SMARCA4, ERCC6L, DDX6
GO:0044822~poly(A) RNA binding RTN4, HMGB2, ZC3HAV1, SNU13, BOP1, CNOT4, EXOSC10, DIMT1, PATL1, TRMT1L, TCERG1, PRR3, DDX49, DDX3X, RPLP0, EIF1AX, ZCCHC9, MRPL37, RPL10, FAU, AATF, DHX36, NCBP3, SPOUT1, HIST1H1E, RRP36, SAP18, MRPS7, ETF1, SAMSN1, GCN1, FLNB, SF3A3, FXR1, MRM3, DDX6, NVL, IFIT2, ATXN2, RPL18A, RCC2, TAF15, UBA1, CELF1, CPSF4, SMC1A, RBM14, ALKBH5, PRPF38A
Supplementary Table 3. Significantly differentially expressed GO terms and KEGG pathways that contained the nodes in PPI network
Nodes in protein-protein-interaction network Category Term
BOP1 CC GO:0005737~cytoplasm
CC GO:0005654~nucleoplasm
MF GO:0005515~protein binding
MF GO:0044822~poly(A) RNA binding
USP9Y CC GO:0005737~cytoplasm
UTY CC GO:0005654~nucleoplasm
CDK16 MF GO:0005515~protein binding
TAF6L MF GO:0005515~protein binding
DDX3X MF GO:0005515~protein binding
TLR4 MF GO:0005516~protein binding
FOS BP GO:0009416~response to light stimulus
KAT2A CC GO:0005654~nucleoplasm
SEC61A2 CC GO:0005829~cytosol
HIST3H3 CC GO:0005654~nucleoplasm
KDM5D CC GO:0005655~nucleoplasm
SMARCA4 MF GO:0005515~protein binding
RPLP0 MF GO:0005516~protein binding
RPL18A MF GO:0044822~poly(A) RNA binding
PSMC3 CC GO:0005737~cytoplasm
MRPS7 MF GO:0044822~poly(A) RNA binding
TBPL1 CC GO:0005737~cytoplasm
FAU CC GO:0005829~cytosol
MAP2K1 CC GO:0005829~cytosol
RPS4Y1 CC GO:0005830~cytosol
RAD23B CC GO:0005654~nucleoplasm
ABL1 CC GO:0005655~nucleoplasm
BCR MF GO:0005515~protein binding
MLLT1 MF GO:0005516~protein binding
DDX58 MF GO:0004386~helicase activity
KDM6A CC GO:0005654~nucleoplasm
UBA1 MF GO:0005515~protein binding
PRKX MF GO:0005516~protein binding
DIMT1 MF GO:0044822~poly(A) RNA binding
RAB5A CC GO:0005737~cytoplasm
ITGAM MF GO:0005515~protein binding
H3F3B MF GO:0005516~protein binding
RPL10 MF GO:0044822~poly(A) RNA binding
SMC3 CC GO:0005737~cytoplasm
EIF1AY MF GO:0005519~protein binding