To determine the rate of water erosion on ag-ricultural soils and to evaluate the efficiency of appropriate response practices, as in other coun-tries the Universal Soil Loss Equation (USLE) devised by WISCHMEIER and SMITH (1978) is used in the Czech Republic. The Revised Universal Soil Loss Equation (RUSLE), proposed by RENARD et al. (1997), is at the testing stage. Both empirical models, USLE and RUSLE, are based on the prin-ciple of tolerable soil loss per standard plot, the parameters of which are defined and derived from the measurements of standard elementary runoff parcels (plots) 22 m in length and of 9% gradient;
the surface of these parcels is kept without vegeta-tion and is mechanically cultivated up or down the slope gradient after each storm. Tolerable soil loss is defined as the maximum soil loss by erosion that permits to maintain a sufficient and sustainable level of soil productivity at acceptable costs. Soil loss is calculated from the equation:
G = R × K × L × S × C × P (t/ha/year)
where:
G – average annual soil loss R – rainfall erosivity factor K – soil erodibility factor
Supported by the Ministry of Agriculture of the Czech Republic, Project No. QF 3098 and by Research Institute for Soil and Water Conservation, Research Plan No. 0002704901.
Revised Determination of the Rainfall-runoff Erosivity
Factor
R
for Application of USLE in the Czech Republic
MILOSLAV JANEČEK
1, ELIŠKA KUBÁTOVÁ
2and MARTIN TIPPL
11
Research Institute for Soil and Water Conservation, Prague, Czech Republic;
2
Department of Land Use and Improvement, Faculty of Forestry and Environment,
Czech University of Agriculture in Prague, Prague, Czech Republic
L – slope length factor S – slope steepness factor
C – factor of the conservation effect of canopy cover P – support practice factor
The erosivity factor R for the USA was derived from a large quantity of data on precipitation. From these data it is possible to deduce that, keeping the factors other than rainfall constant, the soil loss from a cultivated field is directly proportion-ate to the following characteristics of a storm: the product of total kinetic energy of rainfall (E) and its peak 30-minute intensity (I30):
R = E × I30/100
where:
R – rainfall erosivity factor (MJ/ha.cm/h) I30 – peak 30-minute intensity of rainfall (cm/h) E – total kinetic energy of rainfall (J/m²) n
E = ∑ Ei i=1
Ei – kinetic energy of the i-th segment of rainfall (n – number of rainfall segments)
Ei = (206 + 87 logIsi) × Hsi where:
Isi – intensity of the i-th segment of rainfall (cm/h) Hsi – rainfall amount in the i-th segment (cm)
The appearance of deep erosion furrows, also called rills, and the amount of accumulated sedi-ment after unusually intensive rainfall events made researchers draw conclusions that signifi-cant erosion phenomena were connected with several storms only and were the function of peak intensities. However, according to WISCHMEIER (1959, 1962), more than 30-year measurements in many localities in the USA indicated that this conclusion does not hold good. Data on the rainfall factor used to determine the average annual soil loss should involve the cumulative effect of both extraordinary rainfall events (intensive storms) and many rainfall events of medium-intensity.
The average annual value of factor R is calculated from long-term records of precipitation, and it is the sum of the annual erosivity of particular storms, whilst not all events are considered; those of smaller precipitation sum than 0.5 inch, i.e. 12.5 mm, separated from preceding and successive rainfall events by rainless periods longer than 6 h, are omitted if at least 0.25 inch (6.25 mm) of rain did not fall in the course of 15 min.
[image:2.595.101.503.494.742.2]Hence the rainfall erosivity factor R depends on the frequency of occurrence of rainfalls, and on their kinetic energy, intensity and amount. The values of the R factor were processed statistically and presented in the form of isoerodent maps. For the Czech Republic, the average rainfall erosivity factor R = 20 MJ/ha.cm/h was calculated from a
long-term series of rainfall observations for the Prague-Klementinum, Tábor and Bílá Třemešná stations of the Czech Hydrometeorological Institute (CHMI) (JANEČEK 1992). Applying the newly proc-essed long-term series of ombrographic records from other stations of CHMI made it possible to analyse the method of R factor determination for the Czech Republic in more detail.
Methodical approach
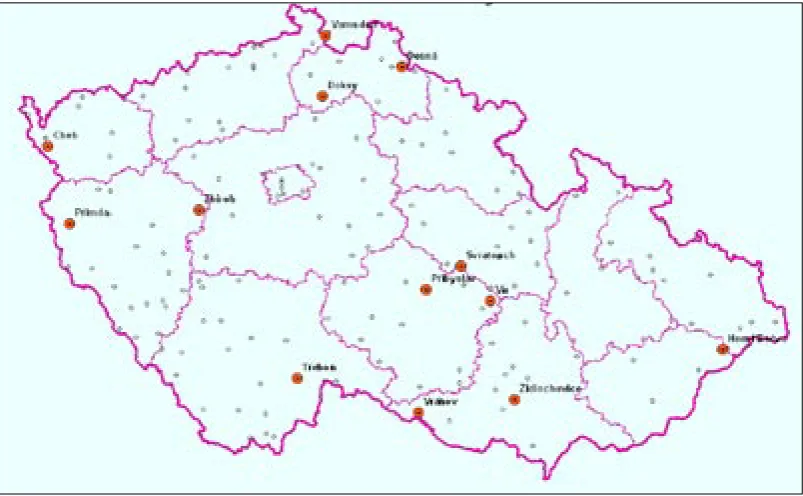
Ombrographic records for the particular sta-tions of CHMI (Figure 1) with sufficiently long periods of observations were used in a digital form with 1-min time steps. Before the calcula-tion of the R factor, the data provided by CHMI were selected according to the criteria defined by WISCHMEIER and SMITH (1978). As the CHMI data on precipitation have numerical codes indicating the record quality, it was possible to evaluate the reliability of these background data, taking into account their completeness, their having or not having been completed a posteriori and the vari-ability of beginnings and ends of records in the particular years.
RESULTS
The values of R factor were calculated for 2 var-iants.
Variant A: for all rainfall events either with the sum > 12.5 mm OR with the intensity > 6 mm per 15 min (Table 1).
Variant B: for all rainfall events with the sum > 12.5 mm AND with the intensity > 6 mm per 15 min (Table 2).
The results for the CHMI stations were used to determine:
– annual sums of the R factors over all events in the particular years,
– annual maxima of R factors for particular events.
These data for the particular stations were proc-esses further to obtain:
– long-term average annual sums of the R fac-tor,
– long-term average annual maximum of the
R factor.
[image:3.595.65.532.445.754.2]According to WISCHMEIER and SMITH (1978), the long-term average annual sum of the R fac-tor is calculated from long-term precipitation
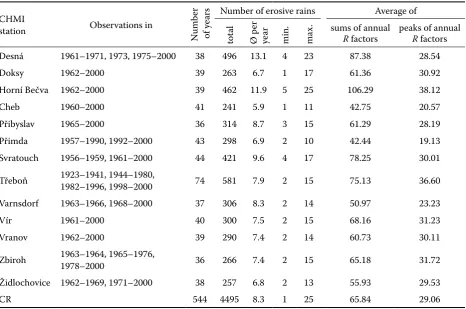
Table 1. Long-term averages of the sums of annual values of R factor and long-term averages of annual peaks of R factor for amounts of rains above 12.5 mm or for rain intensity 6 mm/15 min (variant A)
CHMI
station Observations in
N
umb
er
of ye
ars Number of erosive rains Average of
tot
al
Ø
per
ye
ar
min. max.
sums of annual
R factors peaks of annual R factors
Desná 1961–1971, 1973, 1975–2000 38 496 13.1 4 23 87.38 28.54
Doksy 1962–2000 39 263 6.7 1 17 61.36 30.92
Horní Bečva 1962–2000 39 462 11.9 5 25 106.29 38.12
Cheb 1960–2000 41 241 5.9 1 11 42.75 20.57
Přibyslav 1965–2000 36 314 8.7 3 15 61.29 28.19
Přimda 1957–1990, 1992–2000 43 298 6.9 2 10 42.44 19.13
Svratouch 1956–1959, 1961–2000 44 421 9.6 4 17 78.25 30.01
Třeboň 1923–1941, 1944–1980, 1982–1996, 1998–2000 74 581 7.9 2 15 75.13 36.60
Varnsdorf 1963–1966, 1968–2000 37 306 8.3 2 14 50.97 23.23
Vír 1961–2000 40 300 7.5 2 15 68.16 31.23
Vranov 1962–2000 39 290 7.4 2 14 60.73 30.11
Zbiroh 1963–1964, 1965–1976, 1978–2000 36 266 7.4 2 15 65.18 31.72
Židlochovice 1962–1969, 1971–2000 38 257 6.8 2 13 55.93 29.53
records. Each year, the sum of erosivity of individual storms excluding rainfall events with sums less than 12.5 mm (except for those during which at least 6.25 mm fell in the course of 15 min). Hence the annual value of R factor should be the sum of the values of the R factor for all rains that exceeded 12.5 mm, i.e. including long-duration rains with relatively low intensities or short-term rainfalls with relatively small sums but with intensities exceeding > 6.25 mm per 15 min.
The evaluation of data from 13 stations for more than 30 years indicated that applying the criterion of the variant A, there were on average 8 erosive rainfall events per station, the number varying from 1 to 25. The long-term average annual sums of the R factor were in the range 42 to 106 (aver-age 66), the long-term aver(aver-age annual maxima ranging from 19 to 38 (average 29) for individual stations. Applying the criterion of the variant B, there were on average 2 erosive rainfall events per station per year, the number varying from 0 to 12. The long-term average annual sums of the
R factor ranged from 25 to 67 (average 45), with the long-term average annual maxima ranging from 17 to 36 (average 27.5) for individual stations (Tables 1 and 2).
The long-term 9-year observations (1997–2005) of rains and consequent soil losses from the stand-ard runoff parcels in Třebsín (Prague-West dis-trict), characterised by the soil erodibility factor K
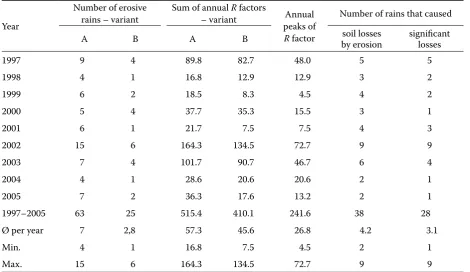
between 0.47 and 0.52, indicated that out of the 63 rainfall events satisfying at least one of the criteria (i.e. selected according to the variant A), 38 caused soil losses by erosion on the bare soil parcels and, out of these, 28 events caused significant losses. In most cases, the significant soil loss occurred when both conditions were satisfied simultane-ously as required by the variant B.
[image:4.595.62.533.102.374.2]Significant soil losses were caused by only 12 rainfall events below 12.5 mm during which the intensity exceeded 6.25 mm in 15 min, but in these cases the soil had been previously saturated or the previous rainfall exceeded 12.5 mm and its intensity was close to the 6.25 mm limit. In the remaining 26 such events (below 12.5 mm with intensities above 6.25 mm in 15 min) the soil losses were very small or none. The annual R factor sums according to the variant A ranged from 16.8 to 164.3, with an average of 57.23, and according to the variant B from 7.5 to 134.5, with an average of 45.6. The annual maxima ranged from 4.5 to 72.7 (average 26.8) – Table 3.
Table 2. Occurrence of erosive rains on experimental runoff plots near Třebsín (Prague-West district)
Year
Number of erosive
rains – variant Sum of annual R factors – variant peaks of Annual R factor
Number of rains that caused
A B A B by erosionsoil losses significantlosses
1997 9 4 89.8 82.7 48.0 5 5
1998 4 1 16.8 12.9 12.9 3 2
1999 6 2 18.5 8.3 4.5 4 2
2000 5 4 37.7 35.3 15.5 3 1
2001 6 1 21.7 7.5 7.5 4 3
2002 15 6 164.3 134.5 72.7 9 9
2003 7 4 101.7 90.7 46.7 6 4
2004 4 1 28.6 20.6 20.6 2 1
2005 7 2 36.3 17.6 13.2 2 1
1997–2005 63 25 515.4 410.1 241.6 38 28
Ø per year 7 2,8 57.3 45.6 26.8 4.2 3.1
Min. 4 1 16.8 7.5 4.5 2 1
69 DISCUSSION AND CONCLUSIONS
The evaluation of R factor for 13 stations of CHMI shows that on average per station there are more than two erosive rainfall events per year at each station, the number varying from none to 12
[image:5.595.61.533.114.404.2]events per year (Horní Bečva) when both condi-tions (according to the variant B) were satisfied, and that the long-term averages annual sums of the R factor for individual stations range from 25 (Přimda) to 67 (H. Bečva), with the average for the Czech Republic being 45. This is more than
Table 3. Long-term averages of the sums of annual values of R factors and long-term averages of annual peaks of R factors for amounts of rains above 12.5 mm and rain intensity higher than 6 mm/15 min (variant B)
CHMI
station Number of years
Peak R factor determined over the years of observations
Number of erosive rains Average of sums of annual R
factors
Average of annual peaks of
R factors Total Ø per year min. max.
Desná 38 144.8 97 2.6 0 7 44.39 24.16
Doksy 39 149.8 89 2.3 0 6 44.93 29.79
Horní Bečva 39 137.7 113 2.9 1 12 67.24 36.23
Cheb 41 72.7 66 1.6 0 6 30.24 19.05
Přibyslav 36 113.5 90 2.5 0 7 47.89 26.69
Přimda 43 88.0 71 1.7 0 4 25.39 17.41
Svratouch 44 176.9 103 2.3 0 9 49.64 27.99
Třeboň 74 359.1 195 2.6 0 6 56.76 35.77
Varnsdorf 37 83.2 75 2.0 0 6 33.01 20.90
Vír 40 125.6 99 2.5 1 9 51.23 30.60
Vranov 39 141.7 90 2.3 0 5 44.98 29.47
Zbiroh 36 197.2 76 2.1 0 6 46.73 30.09
Židlochovice 38 127.5 76 2.0 0 5 40.86 29.36
CR 544 147.5 1240 2.3 0 12 44.87 27.50
Figure 2 : Relation between average annual sums of R-factor and long-term annual precipitation sums
y = 0.0337x + 39.093
R = 0.56
30 40 50 60 70 80 90 100 110 120
[image:5.595.64.535.520.758.2]300 500 700 900 1100 1300 1500
Figure 2. Relation between average annual sums of R-factors and long- term annual precipitation sums
Wischmeier Schwertmann
Long-term annual amount of rain (mm)
Av
er
ag
e
an
nu
al
su
m
s o
f
R
-f
ac
to
a double of the value of the R factor previously recommended for the Czech Republic. The long-term annual maxima of the R factor vary from 17 (Přimda) to 36 (H. Bečva), with the average for the Czech Republic being 27.50. The latter figure is not far from the previously recommended aver-age value (20).
However, considering the finding of WISCHMEIER (1962) that the R factor used to determine the average annual soil loss by erosion must involve
the cumulative effect not only of the storms with maximal R but also of the other, medium-inten-sity rains satisfying the criteria defined above, we think that the results obtained according to the variant A should be regarded as more indicative. These results tell us that on average there were 8 erosive rains per year per station, varying from 1 to 25, and the long-term average annual sums of the R factor for individual stations ranged from 42 (Přimda) or 43 (Cheb) to 106 (H. Bečva) with the
3 precipitation sums
y = 0.0997x + 21.459
R = 0.66
30 40 50 60 70 80 90 100
[image:6.595.67.512.80.277.2]300 350 400 450 500 550 600 650 700
Table 4. Long-term annual amounts of rain and amounts of rain for the growing season (V–X) for CHMI stations (1961–2000)
CHMI stations Height above sea level (m) Long-term annual amount of rain (mm) the growing season (V–X) (mm)Long-term amount of rain over
Desná 772 1348 659.5
Doksy 279 658.9 391.3
Cheb 471 564.5 343.1
Přibyslav 530 674.4 425.9
Přimda 742 696.5 403.5
Svratouch 737 766.2 475.8
Třeboň 429 613.3 403.5
Varnsdorf 338 788.7 428.4
Vír 480 607.3 371.6
Vranov 354 529.4 338.8
Zbiroh 480 585.3 386.4
Židlochovice 180 487.8 308.5
CR average 482.7 693.4 411.4
Figure 3. Relation between average annual sums of R-factor and long- term growing-season precipitation sums
Wischmeier Schwertmann
Long-term annual amount of rain over growing-season V–X (mm)
Av
er
ag
e
an
nu
al
su
m
s o
f
R
-f
ac
to
[image:6.595.69.532.491.758.2]Corresponding author:
Prof. Ing. MILOSLAV JANEČEK, DrSc. Výzkumný ústav meliorací a ochrany půdy, Žabovřeská 250, 156 27 Praha 5-Zbraslav, Česká republika
tel.: + 420 257 921 947, fax: + 420 257 921 246, e-mail: [email protected]
whole-country average 66. This average is more than three times the value of the R factor value recommended previously – JANEČEK (2005).
Therefore, it is necessary to reassess the value of the R factor recommended hitherto for the prac-tical application of USLE in the Czech Republic; namely R = 20. Our results indicate that R = 45 or
R = 66 should be used, depending on the criteria used for selection of the erosive rain events. These revised values of the standard R factor correspond more closely with the values specified for the parts of Germany adjacent to the Czech Republic (SCHWERTMANN et al. 1987). On the other hand, the regression (recommended by SCHWERTMANN
et al. 1987) between the values of R factor and the average precipitation sums over the growing season (May to October) or the average annual precipitation sums were not found to be statistically significant for the CHMI stations studied (Table 4, Figure 2 and 3). In addition, the number of stations (13) studied is not sufficient to generate regional values of the R factor for the Czech Republic. Therefore, the revised R factor values should be proposed as constitutive standards for the whole country. This change will result in more efficient conservation practices and will lead in future to better protection of soil from erosion.
References
JANEČEK M. (1992): Ochrana zemědělské půdy před erozí. Metodiky pro zavádění výsledků výzkumů do praxe, č. 5. ÚVTIZ, Praha.
JANEČEK M. (2005): Ochrana zemědělské půdy před erozí. ISV, Praha.
RENARD K.G., FOSTER G.R., WEESIES G.A., MCCOOL D.K., YODER D.C. (1997): Predicting Soil Erosion by Water: A Guide to Conservation Planning with the Revised Universal Soil Loss Equation (RUSLE). Agricultural Handbook No. 703, USDA, Washington.
SCHWERTMANN V., VOGEL W., KAINZ M. (1987): Boden-erosion durch Wasser. E. Ulmer GmbH Co, Stuttgart. WISCHMEIER W. H. (1959): A rainfall erosion index for
universal soil loss equation. Proceedings – Soil Science Society of America, 23: 246–249.
WISCHMEIER W.H. (1962): Storm and soil conservation. Journal of Soil and Water Conservation, 17: 55–59. WISCHMEIER W.H., SMITH D.D. (1978): Predicting Rainfall
Erosion Losses: A Guide to Conservation Planning. Agriculture Handbook No. 537. USDA, Hyatsville, Maryland.