Supplemental Material
Figure S1. Consort construction
Figure S2. Study design for identifying cinacalcet discontinuation Figure S3. Study design for identifying cinacalcet reinitiation Table S1. Baseline covariates
Table S2. Time-varying covariates
Table S3. Baseline characteristics overall and stratified by race and gender Table S4. Time-dependent covariates by follow-up months
Table S5. Predictors of discontinuation and reinitiation Table S6: Predictors of reinitiation sensitivity analysis
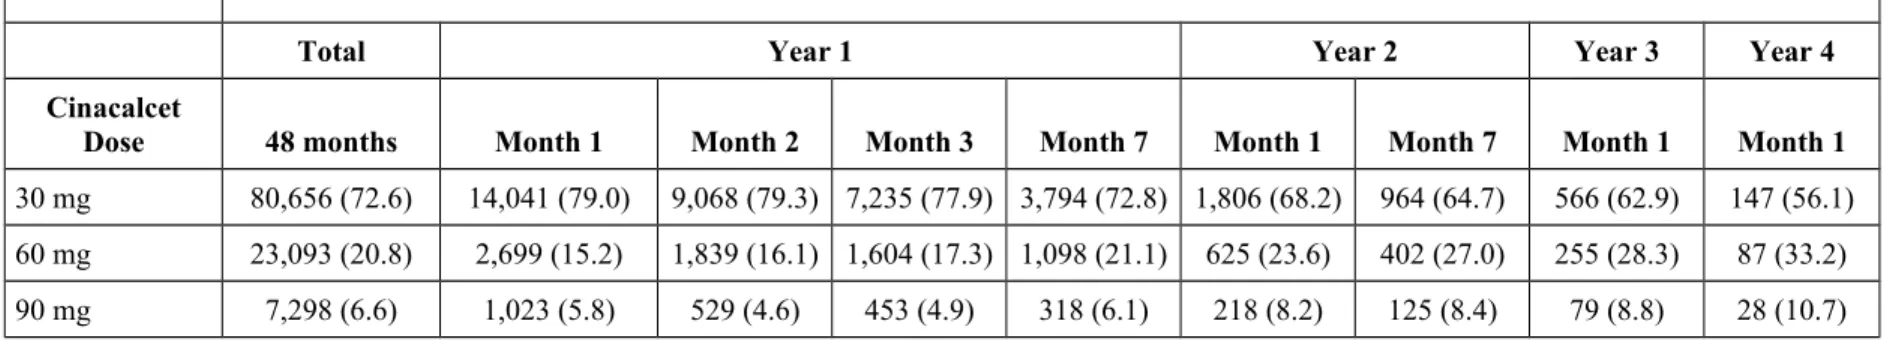
Table S7: Time-dependent cinacalcet dose by follow-up months
Figure S4. Vitamin D trends following cinacalcet initiation and discontinuation
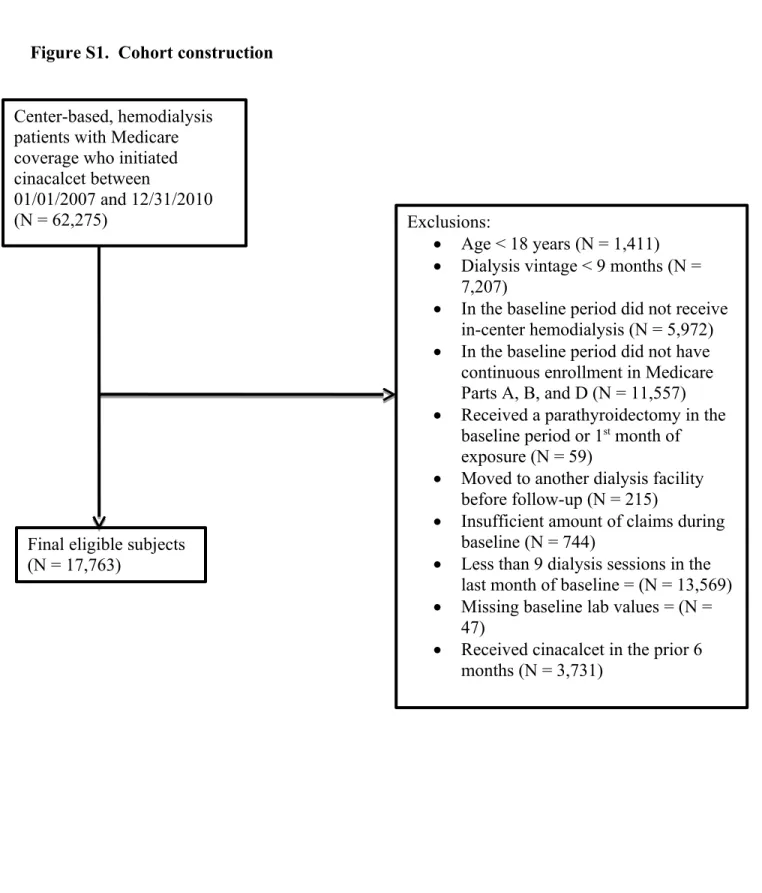
Figure S1. Cohort construction
Final eligible subjects (N = 17,763)
Center-based, hemodialysis patients with Medicare coverage who initiated cinacalcet between
01/01/2007 and 12/31/2010
(N = 62,275) Exclusions:
Age < 18 years (N = 1,411)
Dialysis vintage < 9 months (N = 7,207)
In the baseline period did not receive in-center hemodialysis (N = 5,972)
In the baseline period did not have continuous enrollment in Medicare Parts A, B, and D (N = 11,557)
Received a parathyroidectomy in the baseline period or 1
stmonth of exposure (N = 59)
Moved to another dialysis facility before follow-up (N = 215)
Insufficient amount of claims during baseline (N = 744)
Less than 9 dialysis sessions in the last month of baseline = (N = 13,569)
Missing baseline lab values = (N = 47)
Received cinacalcet in the prior 6
months (N = 3,731)
Figure S2. Study design for identifying cinacalcet discontinuation
Figure S3. Study design for identifying cinacalcet reinitiation
Time varying covariate assessment Baseline
covariate assessment
Discontinued;
start follow-up
Cinacalcet reinitiated in period 4.
Use baseline and time varying covariates assessed in periods 3 to estimate the effect of covariates and laboratory values on risk of cinacalcet reinitiation during period 4.
Reinitiated Period 4
30 days Period 3
30 days Period 2
30 days Period 1
30 days 30-days
6 months
New user 1
stfill
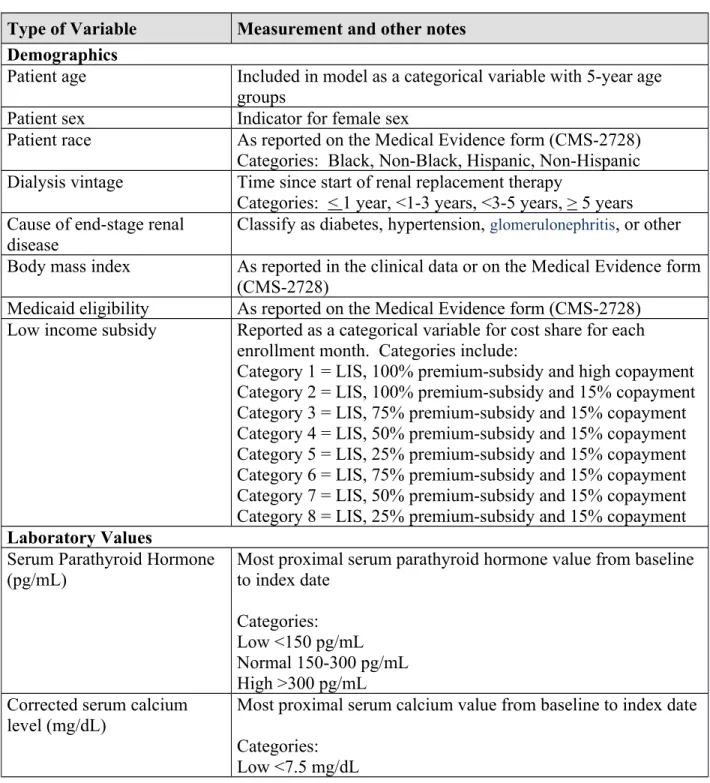
Table S1. Baseline covariates
We evaluated the following covariates at baseline (6 months prior to new cinacalcet use). For the comorbid conditions identified using information provided from the Medicare claims data (part A or B), we considered comorbid conditions as present if at least one inpatient, home health, or skilled nursing facility claim, or at least two outpatient or physician/supplier claims separated by at least 7 days are identified during the baseline period.
Type of Variable Measurement and other notes Demographics
Patient age Included in model as a categorical variable with 5-year age groups
Patient sex Indicator for female sex
Patient race As reported on the Medical Evidence form (CMS-2728) Categories: Black, Non-Black, Hispanic, Non-Hispanic Dialysis vintage Time since start of renal replacement therapy
Categories: < 1 year, <1-3 years, <3-5 years, > 5 years Cause of end-stage renal
disease
Classify as diabetes, hypertension, glomerulonephritis , or other Body mass index As reported in the clinical data or on the Medical Evidence form
(CMS-2728)
Medicaid eligibility As reported on the Medical Evidence form (CMS-2728) Low income subsidy Reported as a categorical variable for cost share for each
enrollment month. Categories include:
Category 1 = LIS, 100% premium-subsidy and high copayment Category 2 = LIS, 100% premium-subsidy and 15% copayment Category 3 = LIS, 75% premium-subsidy and 15% copayment Category 4 = LIS, 50% premium-subsidy and 15% copayment Category 5 = LIS, 25% premium-subsidy and 15% copayment Category 6 = LIS, 75% premium-subsidy and 15% copayment Category 7 = LIS, 50% premium-subsidy and 15% copayment Category 8 = LIS, 25% premium-subsidy and 15% copayment Laboratory Values
Serum Parathyroid Hormone (pg/mL)
Most proximal serum parathyroid hormone value from baseline to index date
Categories:
Low <150 pg/mL Normal 150-300 pg/mL High >300 pg/mL Corrected serum calcium
level (mg/dL)
Most proximal serum calcium value from baseline to index date Categories:
Low <7.5 mg/dL
Normal 7.6-9.5 mg/dL High >9.5 mg/dL Serum phosphorus level
(mg/dL) Most proximal serum phosphorus value from baseline to index date
Categories:
Low <3.5 mg/dL Normal 3.5-5.5 mg/dL High 5.5 mg/dL
Serum Albumin (g/dL) Most proximal serum albumin value from baseline to index date Categories:
Low <3.2 g/dL Normal > 3.2 g/dL Comorbidities
Rheumatoid arthritis / collagen vascular disease
ICD-9
701.0, 710.xx, 714.xx, 720.xx, 725.xx
Diabetes ICD-9
250.xx
Angina ICD-9
413.x Coronary artery disease /
Atherosclerosis
ICD-9
414.0x, 429.2x, 429.5x, 429.7x, 440.x Cerebrovascular disease ICD-9
342, 344.81, 430-438, 997.02, V12.54 Myocardial infarction ICD-9
410.x, 411.x
Malignancy ICD-9
140.xx – 172.xx, 179.xx – 199.xx, 174.0 – 175.9x, 202.0 – 202.3x, 202.50 – 203.01, 200.xx, 201.xx, V10, 173.3x,173.9x, 232.9x, 233.0, 233.1x, 338.3x, 799.4x, 203.8x, 238.6x, 273.3x, V67.2x, 789.51, 795.82
Congestive heart failure ICD-9
398.91, 402.01, 402.11, 402.91, 404.01, 404.03, 404.11, 404.13, 404.91, 404.93, 428, 785.51, 425.4x-425.9x
HCPCS
G8027, G8028
Chronic obstructive pulmonary disease and asthma
ICD-9
491.x, 492.x, 493.x, 494.x, 496.x, 510.x
Fracture ICD-9
805.xx-828.xx Gastrointestinal bleed ICD-9
578.xx
Hyperlipidemia ICD-9
272.xx
Hypertension ICD-9
401 - 405, but not in (402.11, 402.91, 404.11, 404.13, 404.91, 404.93)
Liver disease ICD-9
070.32, 070.33, 070.54, 456.20, 456.21, 456.0, 456.1x, 571.0, 571.2x - 571.6x, 571.8x, 571.9x, 572.3x, 572.8x, V42.7, 570, 573.1-573.3
Hyperthyroidism ICD-9
242.xx Peripheral vascular disease ICD-9
440.2x, 440.3x, 440.8x, 440.9x, 443.9x Peptic ulcer disease ICD-9
530.2, V12.71, 531 – 534 Parathyroidectomy ICD-9 hospital procedure codes
06.81, 06.89 Concomitant Medications
Number of concomitant medications at time of new cinacalcet use
Categories 1-5
6-10
>11 Intravenous vitamin D Categories
Yes No
Vitamin D intravenous:
J0635 (calcitriol 1mcg), J0636 (calcitriol 0.1mcg), J2500
(Paricalcitol 5mcg), J2501 (Paricalcitol 1mcg), J1270
(Doxercalciferol 1mcg) Oral phosphate binder use Categorical variable:
Present yes or no
Sevelamer hydrochloride (Renagel®)
Sevelamer carbonate (Renvela®)
Lanthanum carbonate (Fosrenol®)
Calcium acetate (PhosLo®)
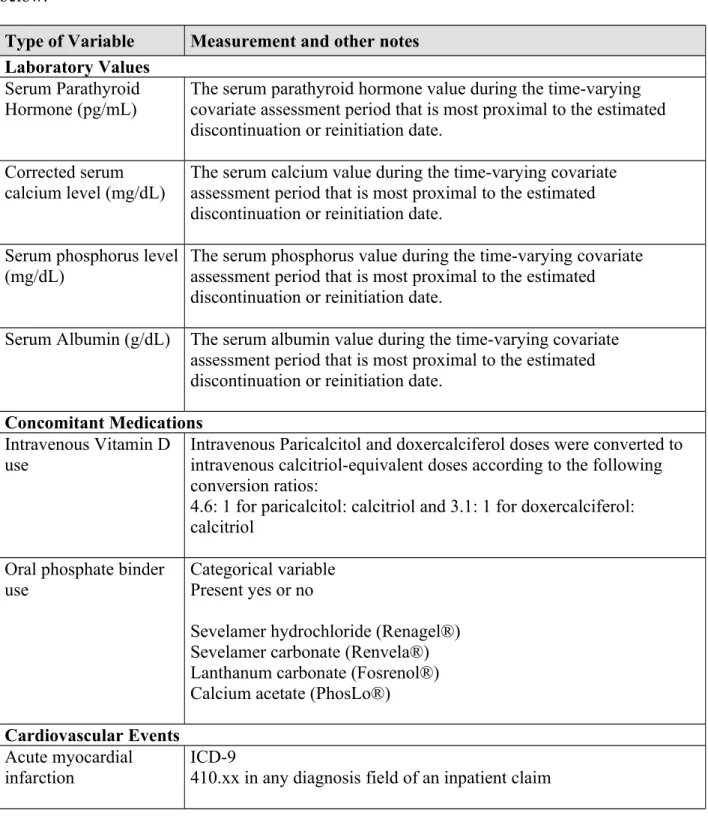
Table S2: Time-varying covariates
We evaluated the following time-varying covariates at 30-day intervals following the start of follow-up. Specific information concerning identification of comorbid conditions identified using information provided from the Medicare claims data (part A or B) is provided in the table below.
Type of Variable Measurement and other notes Laboratory Values
Serum Parathyroid
Hormone (pg/mL) The serum parathyroid hormone value during the time-varying covariate assessment period that is most proximal to the estimated discontinuation or reinitiation date.
Corrected serum calcium level (mg/dL)
The serum calcium value during the time-varying covariate assessment period that is most proximal to the estimated discontinuation or reinitiation date.
Serum phosphorus level
(mg/dL) The serum phosphorus value during the time-varying covariate assessment period that is most proximal to the estimated discontinuation or reinitiation date.
Serum Albumin (g/dL) The serum albumin value during the time-varying covariate assessment period that is most proximal to the estimated discontinuation or reinitiation date.
Concomitant Medications Intravenous Vitamin D use
Intravenous Paricalcitol and doxercalciferol doses were converted to intravenous calcitriol-equivalent doses according to the following conversion ratios:
4.6: 1 for paricalcitol: calcitriol and 3.1: 1 for doxercalciferol:
calcitriol Oral phosphate binder
use
Categorical variable Present yes or no
Sevelamer hydrochloride (Renagel®) Sevelamer carbonate (Renvela®) Lanthanum carbonate (Fosrenol®) Calcium acetate (PhosLo®) Cardiovascular Events
Acute myocardial infarction
ICD-9
410.xx in any diagnosis field of an inpatient claim
Congestive heart failure ICD-9
428.xx in any diagnosis field of an inpatient claim
Stroke ICD-9 codes 430, 431, 433.x1, 434, and 436 in any diagnosis field of an inpatient claim
Peripheral vascular disease event
ICD-9 and CPT codes in any diagnosis field of Part A or B files Lower extremity amputation
84.1×, 84.91
27295, 27590-92, 27598, 27880-82, 27888-89, 28800, 28805 Lower extremity peripheral angioplasty, atherectomy, or endarterectomy
38.18, 39.50
35302-06,35331, 35351, 35355, 35361, 35363, 35371-72, 35381, 35452, 35454, 35456, 35459, 35470, 35472-74, 35481-35483, 35485, 35491-35493, 35495
Lower extremity peripheral bypass 39.25, 39.29
35521, 35533, 35537-41, 35546, 35548-49, 35551, 35556, 35558, 35563, 35565-66, 35571, 35582-83, 35585, 35587, 35621, 35623, 35637-38, 35641,35646-47, 35651, 35654, 35656, 35661, 35663, 35665-66, 35671
Repair, exploration, revision, resection of lower extremity arteries, or thrombectomy of graft
38.08, 38.38, 38.48, 39.49, 39.56, 39.57, 39.58
35226, 35256, 35286,35700, 35721, 35741, 35876, 35879, 35881, 35883, 35884
Non-coronary vessel percutaneous transluminal mechanical thrombectomy, or stents
39.90
37184-86, 37205-08
Cardiovascular mortality
Primary causes of death on CMS-Form 2746 coded as 23 (acute myocardial infarction)
25 (pericarditis, including cardiac tamponade) 26 (atherosclerotic heart disease)
27 (cardiomyopathy) 28 (cardiac arrhythmia)
29 (cardiac arrest, cause unknown) 30 (valvular heart disease)
31 (pulmonary edema due to exogenous fluid)
32 (congestive heart failure)
36 (cerebrovascular accident including intracranial hemorrhage) Other Events
Parathyroidectomy ICD-9 hospital procedure codes
06.81, 06.89 in any diagnosis field of an inpatient claim All cause mortality
Adverse Events Nausea, Vomiting,
diarrhea ICD-9
564.5, 787.91, 787.0x
Considered present if at least one inpatient, home health, or skilled nursing facility claim, or at least two outpatient or physician/supplier claims separated by at least 7 days are identified during the 30-day look back period.
Categorical variable; yes or no
Seizure ICD-9
333.2, 345, 345.0. 345.00, 345.01, 345.1, 345.10, 345.11, 345.2, 345.3, 345.4, 345.40, 345.41, 345.5, 345.50, 345.51, 345.8, 345.80, 345.81, 345.90, 345.91, 780.3
Considered present if at least one inpatient, home health, or skilled nursing facility claim, or at least two outpatient or physician/supplier claims separated by at least 7 days are identified during the 30-day look back period.
Categorical variable; yes or no
Hypocalcemia Corrected serum calcium below 7.5mg/dl
The serum calcium value during the time-varying covariate assessment period that is most proximal to the estimated discontinuation or reinitiation date
Categorical variable; yes or no Low parathyroid
hormone level
Parathyroid hormone level below 150 pg/mL
The serum parathyroid hormone value during the time-varying
covariate assessment period that is most proximal to the estimated
discontinuation or reinitiation date
Categorical variable; yes or no
Other Covariates
Current vascular access Using access information obtained from the clinical data, we classified patients as having a catheter, fistula, or graft
Acute Care
Hospitalization, in days Determined from the USRDS file institutional claims file Co-pay Cost of cinacalcet prescription using Part D claims data
Donut Hole status Determined from Medicare Part D file “Benefit Phase” variable.
Categories:
Covered prescription
Cinacalcet prescription fill resulted in entrance into the gap period Cinacalcet prescription was filled while they were in the gap period Cinacalcet prescription fill resulted in exiting the gap period
Cinacalcet prescription fill resulted in going through the gap period
Other
Table S3. Baseline characteristics overall and stratified by race and gender
Characteristic
1Total Female Male African
American Demographics
Patients, N 17,763 8,764 8,999 9,555
Age, mean (SD), years
256.7 (14.5) 59.1 (14.8) 54.4 (13.9) 55.5 (14.1) Time on dialysis, mean
(SD), years
24.5 (4.3) 4.4 (4.1) 4.7 (4.4) 4.8 (4.3) Race, N (%)
White 7,242 (40.8) 3,436 (39.2) 3,806 (42.3) n/a African American 9,555 (53.8) 4,856 (55.4) 4,699 (52.2) n/a
Other Race 966 (5.4) 472 (5.4) 494 (5.5) n/a
Cause of ESRD, N (%)
Diabetes 7,629 (42.9) 4,233 (48.3) 3,396 (37.7) 3,691 (38.6) Hypertension 5,612 (31.6) 2,458 (28.0) 3,154 (35.0) 3,789 (39.7) Glomerulonephritis 2,236 (12.6) 1,067 (12.2) 1,169 (13.0) 1,105 (11.6) Other 2,286 (12.9) 1,006 (11.5) 1,280 (14.2) 970 (10.2) Body Mass Index,
mean (SD), kg/m
228.0 (7.3) 28.7 (7.8) 27.4 (6.7) 28.1 (7.4) Financial Considerations
Medicaid, N (%) 12,206 (68.7)
6,351 (72.5) 5,855 (65.1) 6,890 (72.1) Low-income subsidy, N
(%)
14,906 (83.9)
7,515 (85.7) 7,391 (82.1) 8,414 (88.1) Concomitant
medications, N (%)
34.7 (3.6) 5.1 (3.7) 4.4 (3.5) 4.4 (3.5) Biochemical Values
Albumin, mean (SD), g/dL
43.9 (0.4) 3.8 (0.4) 4.0 (0.4) 3.9 (0.4) Calcium, mean (SD),
mg/dL
49.4 (0.7) 9.4 (0.7) 9.4 (0.7) 9.4 (0.7) Phosphorus, mean
(SD), mg/dL
45.9 (1.7) 5.8 (1.7) 6.0 (1.7) 5.8 (1.7) Parathyroid hormone,
mean (SD), pg/mL
4642 (519) 640 (519) 644 (520) 687 (568) Comorbidities
Angina, N (%) 349 (2.0) 185 (2.1) 164 (1.8) 180 (1.9)
Congestive heart failure, N (%)
4,823 (27.2) 2,592 (29.6) 2,231 (24.8) 2,611 (27.3) Coronary artery disease
/ atherosclerosis, N (%)
4,703 (26.5) 2,434 (27.8) 2,269 (25.2) 2,250 (23.5) Cerebrovascular
disease, N (%)
1,891 (10.6) 1,087 (12.4) 804 (8.9) 1,070 (11.2) Myocardial infarction,
N (%) 679 (3.8) 363 (4.1) 316 (3.5) 362 (3.8)
Hypertension, N (%) 12,393 (69.8)
6,481 (74.0) 5,912 (65.7) 6,909 (72.3)
Peripheral vascular 2,352 (13.2) 1,208 (13.8) 1,144 (12.7) 1,217 (12.7)
disease, N (%)
Hyperlipidemia, N (%) 4,658 (26.2) 2,519 (28.7) 2,139 (23.8) 2,292 (24.0) Chronic obstructive
pulmonary disease and asthma, N (%)
2,727 (15.4) 1,530 (17.5) 1,197 (13.3) 1,350 (14.1)
Rheumatoid arthritis / collagen vascular disease, N (%)
511 (2.9) 398 (4.5) 113 (1.3) 319 (3.3)
Diabetes, N (%) 10,052 (56.6)
5,491 (62.7) 4,561 (50.7) 5,121 (53.6) Fracture, N (%) 697 (3.9) 451 (5.1) 246 (2.7) 276 (2.9) Gastrointestinal bleed,
N (%)
504 (2.8) 285 (3.3) 219 (2.4) 303 (3.2) Hyperthyroidism, N
(%)
105 (0.59) 73 (0.83) 32 (0.36) 51 (0.53) Peptic ulcer disease, N
(%)
285 (1.6) 149 (1.7) 136 (1.5) 150 (1.6) Liver disease, N (%) 640 (3.6) 257 (2.9) 383 (4.3) 352 (3.7)
Cancer, N (%) 908 (5.1) 424 (4.8) 484 (5.4) 439 (4.6)
Dialysis Care Phosphorus binder drug, N (%)
514,135 (79.6)
7,037 (80.3) 7,098 (78.9) 7,383 (77.3) Catheter access, N (%) 3,351 (18.9) 1,994 (22.8) 1,357 (15.1) 1,793 (18.8) Mean intravenous
vitamin D dosage, micrograms (SD)
612.5 (10.3) 11.9 (9.9) 13.1 (10.7) 14.6 (11.2)
Note: Conversion factors for units: Calcium in mg/dL to mmol/L, x0.2495; phosphorus in mg/dL to mmol/L, x0.3229.
1
Characteristics were identified using information from Medicare Part A or B claims. A characteristic was considered present if at least one inpatient, home health, or skilled nursing facility claim, or at least two outpatient or physician/ supplier claims separated by at least 7 days, were identified during the 6-month baseline period.
2
Age and time on dialysis are at the time of cinacalcet initiation.
3
Concomitant medications are the mean number of concomitant medications at the time of cinacalcet initiation.
4
Laboratory values were those most proximal to the index date during the baseline period.
5
Phosphate binders included in the analysis: Sevelamer hydrochloride, sevelamer carbonate, lanthanum carbonate, and calcium acetate.
6
Mean intravenous vitamin D dose per person in the last month of the baseline period.
Paricalcitol and doxercalciferol doses were converted to calcitriol-equivalent doses according to the following conversion ratios: 4.6: 1 for paricalcitol: calcitriol and 3.1: 1 for doxercalciferol:
calcitriol.
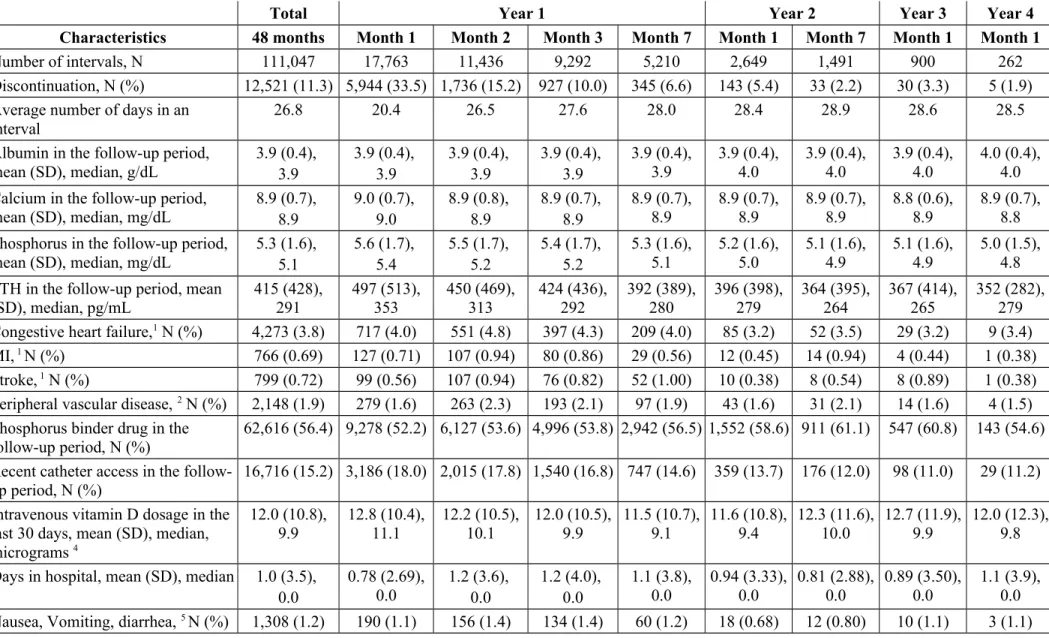
Table S4. Time-dependent covariates by follow-up months
Total Year 1 Year 2 Year 3 Year 4
Characteristics 48 months Month 1 Month 2 Month 3 Month 7 Month 1 Month 7 Month 1 Month 1
Number of intervals, N 111,047 17,763 11,436 9,292 5,210 2,649 1,491 900 262
Discontinuation, N (%) 12,521 (11.3) 5,944 (33.5) 1,736 (15.2) 927 (10.0) 345 (6.6) 143 (5.4) 33 (2.2) 30 (3.3) 5 (1.9) Average number of days in an
interval
26.8 20.4 26.5 27.6 28.0 28.4 28.9 28.6 28.5
Albumin in the follow-up period, mean (SD), median, g/dL
3.9 (0.4), 3.9
3.9 (0.4), 3.9
3.9 (0.4), 3.9
3.9 (0.4), 3.9
3.9 (0.4), 3.9
3.9 (0.4), 4.0
3.9 (0.4), 4.0
3.9 (0.4), 4.0
4.0 (0.4), 4.0 Calcium in the follow-up period,
mean (SD), median, mg/dL 8.9 (0.7), 8.9
9.0 (0.7), 9.0
8.9 (0.8), 8.9
8.9 (0.7), 8.9
8.9 (0.7),
8.9 8.9 (0.7),
8.9 8.9 (0.7),
8.9 8.8 (0.6),
8.9 8.9 (0.7), 8.8 Phosphorus in the follow-up period,
mean (SD), median, mg/dL
5.3 (1.6), 5.1
5.6 (1.7), 5.4
5.5 (1.7), 5.2
5.4 (1.7), 5.2
5.3 (1.6), 5.1
5.2 (1.6), 5.0
5.1 (1.6), 4.9
5.1 (1.6), 4.9
5.0 (1.5), 4.8 PTH in the follow-up period, mean
(SD), median, pg/mL
415 (428), 291
497 (513), 353
450 (469), 313
424 (436), 292
392 (389), 280
396 (398), 279
364 (395), 264
367 (414), 265
352 (282), 279 Congestive heart failure,
1N (%) 4,273 (3.8) 717 (4.0) 551 (4.8) 397 (4.3) 209 (4.0) 85 (3.2) 52 (3.5) 29 (3.2) 9 (3.4) MI,
1N (%) 766 (0.69) 127 (0.71) 107 (0.94) 80 (0.86) 29 (0.56) 12 (0.45) 14 (0.94) 4 (0.44) 1 (0.38) Stroke,
1N (%) 799 (0.72) 99 (0.56) 107 (0.94) 76 (0.82) 52 (1.00) 10 (0.38) 8 (0.54) 8 (0.89) 1 (0.38) Peripheral vascular disease,
2N (%) 2,148 (1.9) 279 (1.6) 263 (2.3) 193 (2.1) 97 (1.9) 43 (1.6) 31 (2.1) 14 (1.6) 4 (1.5) Phosphorus binder drug in the
follow-up period, N (%)
62,616 (56.4) 9,278 (52.2) 6,127 (53.6) 4,996 (53.8) 2,942 (56.5) 1,552 (58.6) 911 (61.1) 547 (60.8) 143 (54.6) Recent catheter access in the follow-
up period, N (%)
16,716 (15.2) 3,186 (18.0) 2,015 (17.8) 1,540 (16.8) 747 (14.6) 359 (13.7) 176 (12.0) 98 (11.0) 29 (11.2) Intravenous vitamin D dosage in the
last 30 days, mean (SD), median, micrograms
412.0 (10.8), 9.9
12.8 (10.4), 11.1
12.2 (10.5), 10.1
12.0 (10.5), 9.9
11.5 (10.7), 9.1
11.6 (10.8), 9.4
12.3 (11.6), 10.0
12.7 (11.9), 9.9
12.0 (12.3), 9.8 Days in hospital, mean (SD), median 1.0 (3.5),
0.0
0.78 (2.69), 0.0
1.2 (3.6), 0.0
1.2 (4.0), 0.0
1.1 (3.8), 0.0
0.94 (3.33), 0.0
0.81 (2.88), 0.0
0.89 (3.50), 0.0
1.1 (3.9),
0.0
Nausea, Vomiting, diarrhea,
5N (%) 1,308 (1.2) 190 (1.1) 156 (1.4) 134 (1.4) 60 (1.2) 18 (0.68) 12 (0.80) 10 (1.1) 3 (1.1)
Total Year 1 Year 2 Year 3 Year 4 Characteristics 48 months Month 1 Month 2 Month 3 Month 7 Month 1 Month 7 Month 1 Month 1 Seizure,
5N (%) 765 (0.69) 89 (0.50) 101 (0.88) 66 (0.71) 35 (0.67) 21 (0.79) 8 (0.54) 3 (0.33) 0 Monthly copay, mean (SD), median,
dollars
22.9 (93.3), 3.1
29.3 (103.6), 3.2
29.1 (108.6), 3.1
29.9 (111.2), 3.1
22.1 (88.6), 3.1
15.7 (71.5), 3.0
14.2 (69.0), 0.0
12.4 (67.0), 1.7
13.4 (66.5), 0.0 Concomitant number of medications
in past month, mean (SD), median
5.8 (3.7), 5.0
5.3 (3.6), 5.0
5.6 (3.6), 5.0
5.7 (3.7), 5.0
6.0 (3.7), 5.0
6.0 (3.8), 6.0
6.1 (3.9), 6.0
6.2 (4.1), 5.5
6.0 (3.8), 5.5 Hypocalcemia (<7.5 mg/dL), N (%) 1,934 (1.8) 331 (1.9) 244 (2.1) 167 (1.8) 94 (1.8) 49 (1.9) 16 (1.1) 16 (1.8) 4 (1.5) Low PTH (<150 pg/mL), N (%) 17,980 (16.7) 2,514 (16.2) 1,946 (17.5) 1,646 (17.8) 844 (16.4) 420 (16.1) 261 (17.7) 125 (14.0) 36 (13.9) Gap period activity,
5N (%) 44,708 (41.3) 7,375 (41.5) 5,594 (50.0) 4,736 (52.8) 1,996 (39.7) 930 (36.5) 432 (29.6) 322 (36.8) 97 (38.2)
Note: Conversion factors for units: Calcium in mg/dL to mmol/L, x0.2495; phosphorus in mg/dL to mmol/L, x0.3229.
1
Myocardial infarction, congestive heart failure, stroke, and parathyroidectomy were considered in any diagnosis field of an inpatient claim only.
2
Peripheral vascular disease was considered in any diagnosis field of Medicare Part A and B files.
3
Phosphate binders included in the analysis: Sevelamer hydrochloride, sevelamer carbonate, lanthanum carbonate, and calcium acetate
4
Paricalcitol and doxercalciferol doses were converted to calcitriol-equivalent doses according to the following conversion ratios: 4.6:
1 for paricalcitol: calcitriol and 3.1: 1 for doxercalciferol: calcitriol.
5
Seizure, nausea, vomiting, and diarrhea considered present if at least one inpatient, home health, or skilled nursing facility claim, or at least two outpatient or physician/supplier claims separated by at least 7 days are identified during the 30-day look back period.
6
Gap period activity was defined as the percentage of participants who in the prior 30-day period had a prescription filled that resulted
in entering, being in, exiting, or going through the doughnut hole.
Table S5. Predictors of discontinuation and reinitiation
Characteristic
1Discontinuation (HR, 95% CI) Reinitiation (HR, 95% CI) Number of time intervals for
analysis, N (%)
100,706 (90.7%) 78,789 (96.0%)
Demographics
Age, years, reference 46-55
<45 0.92 (0.85, 1.00) 0.95 (0.90, 1.02)
56-65 1.05 (0.97, 1.13) 0.98 (0.92, 1.04)
66-75 1.05 (0.97, 1.15) 0.90 (0.85, 0.97)
>75 0.98 (0.88, 1.09) 0.95 (0.87, 1.04)
Time on dialysis, years, reference <1
1-3 1.15 (1.01, 1.30) 1.00 (0.91, 1.11)
>4 1.14 (1.00, 1.30) 1.03 (0.92, 1.14)
Female 1.07 (1.01, 1.13) 1.00 (0.96, 1.05)
African American 1.04 (0.98, 1.10) 1.08 (1.03, 1.13)
Cause of ESRD, reference diabetes mellitus
Hypertension 1.02 (0.94, 1.10) 1.04 (0.98, 1.11)
Glomerulonephritis 1.01 (0.90, 1.12) 1.08 (0.99, 1.17)
Other 0.96 (0.87, 1.06) 1.03 (0.95, 1.12)
Body mass index, kg/m
2, reference normal
Underweight 1.07 (0.93, 1.23) 0.98 (0.87, 1.10)
Overweight 1.03 (0.96, 1.10) 1.03 (0.98, 1.09)
Obese 0.98 (0.91, 1.04) 1.11 (1.05, 1.17)
Financial considerations
Medicaid 1.03 (0.96, 1.11) 0.96 (0.91, 1.02)
Low-income subsidy 0.76 (0.68, 0.85) 1.32 (1.22, 1.43) Concomitant medications in
baseline period
20.98 (0.97, 0.99) 1.00 (0.99, 1.01) Concomitant medications in
follow-up period
20.96 (0.95, 0.97) 0.98 (0.97, 0.99) Copay in follow-up period
31.04 (1.01, 1.06) 1.04 (1.02, 1.06) Last benefit phase in follow-
up, reference: covered
4Entering the gap period 1.19 (1.00, 1.41) 1.01 (0.85, 1.21) Exiting or going through
gap
period
0.98 (0.77, 1.23) 1.03 (0.81, 1.32)
In the gap period 1.10 (1.04, 1.16) 1.01 (0.96, 1.06) Biochemical values
Albumin in baseline period, reference: <3.3 g/dL
3.3-3.9 g/dL 1.11 (0.97, 1.28) 1.13 (1.00, 1.27)
>3.9 g/dL 1.05 (0.91, 1.21) 1.09 (0.96, 1.23)
Albumin in follow-up period,
reference: <3.3 g/dL
3.3-3.9 g/dL 0.85 (0.76, 0.95) 1.13 (1.02, 1.25)
>3.9 g/dL 0.78 (0.69, 0.88) 1.23 (1.10, 1.36)
Phosphorus in baseline period, mg/dL
1.02 (1.00, 1.04) 0.98 (0.96, 0.99) Phosphorus in follow-up
period, mg/dL
1.02 (1.00, 1.04) 0.99 (0.98, 1.01) Parathyroid hormone in
baseline period, pg/mL
51.00 (0.99, 1.01) 1.00 (0.99, 1.00) Parathyroid hormone in
follow-up period, reference:
>600 pg/mL
<150 pg/mL 1.24 (1.12, 1.37) 0.70 (0.64, 0.76)
150-300 pg/mL 0.91 (0.83, 0.99) 0.71 (0.66, 0.75)
301-600 pg/mL 0.89 (0.82, 0.97) 0.85 (0.80, 0.90)
Parathyroid hormone in follow-up period, change in quintiles, reference: no change
6Increase 1.15 (1.07, 1.23) 1.08 (1.03, 1.14)
Decrease 0.90 (0.84, 0.97) 1.12 (1.06, 1.19)
Calcium in baseline period, mg/dL
0.95 (0.91, 0.99) 1.16 (1.12, 1.20) Calcium in follow-up period,
reference: >8.7mg/dL
7<7.5mg/dL 1.07 (0.89, 1.29) 1.12 (0.91, 1.39)
7.5-8.7mg/dL 0.85 (0.80, 0.91) 1.26 (1.19, 1.33)
Calcium in follow-up period, change in quintiles, reference:
no change
6Increase 1.24 (1.16, 1.32) 1.07 (1.02, 1.13)
Decrease 0.94 (0.88, 1.00) 1.04 (0.99, 1.10)
Comorbidities
Angina in baseline period 1.27 (1.07, 1.52) 1.06 (0.91, 1.23) Congestive heart failure in
baseline period
1.06 (0.99, 1.13) 0.96 (0.91, 1.01) Congestive heart failure in
follow-up period
1.01 (0.90, 1.14) 1.11 (0.94, 1.31) Coronary artery disease /
atherosclerosis in baseline period
1.01 (0.95, 1.09) 0.93 (0.88, 0.99)
Cerebrovascular disease in baseline period
0.94 (0.86, 1.02) 1.00 (0.93, 1.07) Myocardial infarction in
baseline period
1.00 (0.87, 1.15) 1.02 (0.90, 1.15) Myocardial infarction in
follow-up period
1.05 (0.83, 1.32) 0.65 (0.42, 0.99) Stroke in follow-up period 1.30 (1.05, 1.60) 0.82 (0.55, 1.20) Hypertension in baseline
period
1.12 (1.05, 1.19) 1.03 (0.98, 1.08)
Peripheral vascular disease in 1.02 (0.94, 1.11) 1.11 (1.03, 1.19)
baseline period
Peripheral vascular disease in follow-up period
0.99 (0.85, 1.16) 0.91 (0.76, 1.09) Hyperlipidemia in baseline
period
1.01 (0.95, 1.07) 1.06 (1.01, 1.12) Chronic obstructive
pulmonary disease and asthma in baseline period
1.00 (0.93, 1.08) 1.00 (0.94, 1.06)
Rheumatoid arthritis in baseline period
1.15 (0.98, 1.35) 1.05 (0.93, 1.19) Diabetes in baseline period 1.05 (0.98, 1.14) 0.98 (0.92, 1.04) Fracture in baseline period 1.01 (0.88, 1.15) 1.03 (0.92, 1.15) Gastrointestinal bleed in
baseline period
0.81 (0.69, 0.96) 0.96 (0.84, 1.11) Hyperthyroidism in baseline
period
0.96 (0.70, 1.33) 1.02 (0.76, 1.38) Peptic ulcer disease in
baseline period
1.21 (0.99, 1.48) 0.91 (0.77, 1.09) Liver disease in baseline
period 1.07 (0.93, 1.22) 1.07 (0.96, 1.20)
Cancer in baseline period 0.96 (0.85, 1.08) 1.02 (0.92, 1.13) Nausea, vomiting, diarrhea in
follow-up period
1.09 (0.91, 1.32) 1.05 (0.85, 1.31) Seizure in follow-up period 1.18 (0.93, 1.49) 1.11 (0.82, 1.50) Dialysis care
Intravenous vitamin D in baseline period
81.01 (0.98, 1.05) 0.98 (0.96, 1.00) Intravenous vitamin D in
follow-up period
80.94 (0.91, 0.97) 1.02 (0.99, 1.04) Phosphorus binder drug in
baseline period
91.02 (0.95, 1.10) 1.12 (1.06, 1.18) Phosphorus binder drug in
follow-up period
90.77 (0.73, 0.82) 1.03 (0.98, 1.08) Catheter access in baseline
period
0.97 (0.89, 1.07) 1.07 (0.99, 1.15) Catheter access in follow-up
period
1.10 (1.00, 1.21) 0.83 (0.77, 0.90) Most recent dose of
cinacalcet, reference: 30 mg
60 mg 1.07 (1.00, 1.15) n/a
90 mg 1.15 (1.03, 1.29) n/a
Days in the hospital in follow- up period, reference: 0 days
1-4 days 2.02 (1.84, 2.22) 0.85 (0.75, 0.96)
>5 days 1.90 (1.73, 2.08) 0.79 (0.69, 0.89)
Note: Conversion factors for units: Calcium in mg/dL to mmol/L, x0.2495; phosphorus in mg/dL to mmol/L, x0.3229.
1
Baseline characteristics were identified using information from Medicare Part A or B claims. A
characteristic was considered present if at least one inpatient, home health, or skilled nursing
facility claim, or at least two outpatient or physician/ supplier claims separated by at least 7 days, were identified during the 6-month baseline period. Additional information concerning baseline characteristics can be found in Table S1. Time-varying (follow-up) characteristics were
evaluated at 30-day intervals following the start of follow-up. Additional information concerning time-varying (follow-up) characteristics can be found in Table S2.
2
Concomitant medications are the number of concomitant medications at the time of cinacalcet discontinuation or reinitiation.
3
Changes in co-pay were based on increments of $100. The last co-pay prior to discontinuation was used to predict cinacalcet reinitiation.
4
Benefit phase reflects the status of Medicare Part D coverage at the time of the fill of cinacalcet.
5
Changes in parathyroid hormone level were based on increments of 100 pg/mL.
6
Distributions of parathyroid hormone and calcium were examined across all of follow-up and quintiles were based on these distributions. Increase indicates an increase to another quintile and trend of increasing laboratory levels. Decrease indicates a decrease to another quintile and a trend of decreasing laboratory levels.
7
Results presented for prediction of reinitiation associated with follow-up calcium levels are those from the sensitivity analysis utilizing a lag time of 14 days. The calcium level recorded 14 days prior to the date of the laboratory value most proximal to discontinuation was used to predict reinitiation. All other results were not significantly changed when lag times were considered.
8
Mean intravenous vitamin D dose was assessed in the last month of the baseline period.
Changes in intravenous vitamin D dose were based in increments of 10mcg. Paricalcitol and doxercalciferol doses were converted to calcitriol-equivalent doses according to the following conversion ratios: 4.6: 1 for paricalcitol: calcitriol and 3.1: 1 for doxercalciferol: calcitriol.
9
Phosphate binders included in the analysis: Sevelamer hydrochloride, sevelamer carbonate,
lanthanum carbonate, and calcium acetate
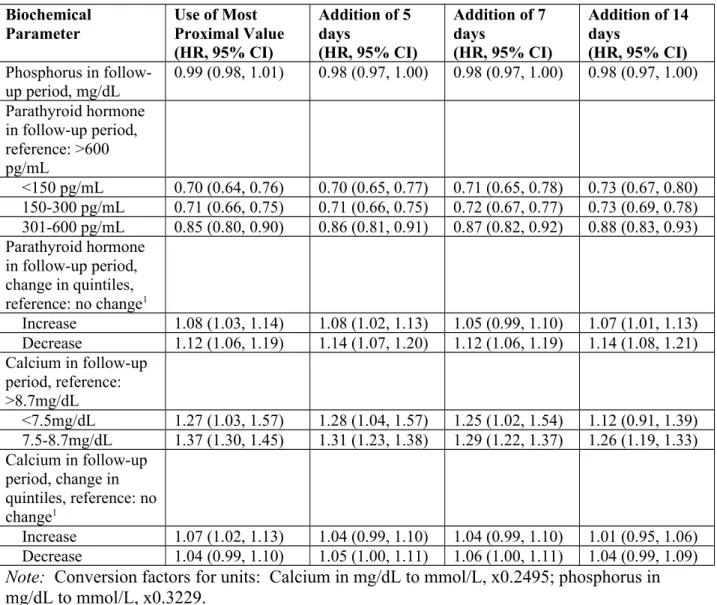
Table S6. Predictors of reinitiation sensitivity analysis
A sensitivity analysis was performed to determine if reinitiation results were modified when biochemical results from 5, 7, and 14 days prior to the date of the laboratory value most proximal to reinitiation were used to predict reinitiation. This lag time could account for any delays between physician recognition of a laboratory abnormality and a decision to reinitiate cinacalcet.
Biochemical Parameter
Use of Most Proximal Value (HR, 95% CI)
Addition of 5 days
(HR, 95% CI)
Addition of 7 days
(HR, 95% CI)
Addition of 14 days
(HR, 95% CI) Phosphorus in follow-
up period, mg/dL
0.99 (0.98, 1.01) 0.98 (0.97, 1.00) 0.98 (0.97, 1.00) 0.98 (0.97, 1.00) Parathyroid hormone
in follow-up period, reference: >600 pg/mL
<150 pg/mL 0.70 (0.64, 0.76) 0.70 (0.65, 0.77) 0.71 (0.65, 0.78) 0.73 (0.67, 0.80) 150-300 pg/mL 0.71 (0.66, 0.75) 0.71 (0.66, 0.75) 0.72 (0.67, 0.77) 0.73 (0.69, 0.78) 301-600 pg/mL 0.85 (0.80, 0.90) 0.86 (0.81, 0.91) 0.87 (0.82, 0.92) 0.88 (0.83, 0.93) Parathyroid hormone
in follow-up period, change in quintiles, reference: no change
1Increase 1.08 (1.03, 1.14) 1.08 (1.02, 1.13) 1.05 (0.99, 1.10) 1.07 (1.01, 1.13) Decrease 1.12 (1.06, 1.19) 1.14 (1.07, 1.20) 1.12 (1.06, 1.19) 1.14 (1.08, 1.21) Calcium in follow-up
period, reference:
>8.7mg/dL
<7.5mg/dL 1.27 (1.03, 1.57) 1.28 (1.04, 1.57) 1.25 (1.02, 1.54) 1.12 (0.91, 1.39) 7.5-8.7mg/dL 1.37 (1.30, 1.45) 1.31 (1.23, 1.38) 1.29 (1.22, 1.37) 1.26 (1.19, 1.33) Calcium in follow-up
period, change in quintiles, reference: no change
1Increase 1.07 (1.02, 1.13) 1.04 (0.99, 1.10) 1.04 (0.99, 1.10) 1.01 (0.95, 1.06) Decrease 1.04 (0.99, 1.10) 1.05 (1.00, 1.11) 1.06 (1.00, 1.11) 1.04 (0.99, 1.09) Note: Conversion factors for units: Calcium in mg/dL to mmol/L, x0.2495; phosphorus in mg/dL to mmol/L, x0.3229.
1