Abstract—Micromixer is essential in many of the microfluidic systems targeted for use in biochemistry analysis, drug delivery and biomechanical investigation as well as RNA and DNA synthesis and testing. The mixing behavior of two fluids in a passive micromixer with Y-type inlet and helical fluid channel, along with herringbone grooves etched on the base of the fluid channel, was studied with computer simulation technique and experiments. The mixing of pure water and acetone solution under different Reynolds numbers and acetone concentrations were investigated. An image inspection method using the variance in contrast of the image gray level as the measurement parameter was adopted to calculate the mixing efficiency distribution. Inspection results show that the mixing efficiency is decreased with the increase of the concentration of the acetone solution, but the mixing efficiency around the outlet can reach to a value of 90% even the Reynolds numbers of the fluids were as low as Re = 1, and the best efficiency for the case of Re = 10 is over 98%. The results show that the proposed micromixer is possible applied to the field of biomedical diagnosis.
Index Terms—Micromixer, helical channel, Grooved Surfaces, mixing efficiency.
I. INTRODUCTION
Along with the progress in industry technology, the development of micro/nano technology has become of great interest to precision technology, especially in fields like electron, communication, assembly, testing, and so on. However, it is hard to develop micro/nano technology through traditional series servo systems. Therefore, the design of a nano mechanism of high speed moving, high resolution and long travel as well as the adoption of a suitable actuator will definitely improve the precision of the stage.
Micromixers play a core role in many biochemistry and biomedical applications, such as analysis and synthesis of RNA/DNA, PCR amplification and so on[1-2]. Two key issues, a simple system design for high mixing efficiency and effective examining techniques of mixing efficiency, are usually concerned in micromixer development[3-4]. It is known that the flows inside microchannels are predominantly laminar and the Reynolds numbers are usually lower than 10. Therefore, the mixing of fluids in microchannels is not easily implemented with mechanical stirring methods because of size limitations and fabrication
Y. H. Hu is with the Department of Mechanical Engineering, Nanya Institute of Technology Chung Li, Taiwan 320 (e-mail: [email protected]. tw).
K. H. Lin is with the Department of Mechanical Engineering, Ching Yun University Chung Li, Taiwan 320 (He is corresponding author, fax: 886-3-4581196, e-mail: [email protected])
difficulties[5-6]. In general, most of traditional micromixers were constructed of straight fluid channel and companioned with the design of fillisters and/or fold paths to enhance the mixing effect[7]. However, the design of straight channel needs longer length to achieve the goal of uniform mixing. Therefore, it is always persecuted with the problems of mixer size and full-field inspection.
In this paper, a novel passive micromixer with Y-type inlet [8] and helical fluid channel is presented. In comparison with the active micromixers, the passive micromixers do not require any moving parts, and the mixing is obtained from the natural movement of the fluids as they flow through the fluid channel of the mixer. The design of helical route increases the contact area of the mixing fluids that the uniform mixing can be achieved within a shorter mixing path and also the tortuous design can much reduce the mixer size. Besides, generating transverse components of flow is a good scheme in bringing chaotic advection [9] in the passive type of mixer. Here four arrangements of herringbone [10] grooved on the mixing plate were designed and compared each other. The grooved surface can enhance transverse components of flows in the mixer [11, 12] so that a better mixing could be expected in these designed mixers.
The mixing of pure water and acetone solution in this mixer under the streams with Reynolds numbers of 1~10 and acetone concentrations of 0~50% were investigated. An image inspection method [13] using the variance of the image gray level contrast as the measurement parameter to determine the mixing efficiency distribution in the mixer. The steady and laminar flow fields inside the micromixer were simulated numerically with a finite volume discretization technique. Through the numerical integration over the chamber depth, the numerical prediction could be directly used to compare with the experimental measurements. In results, the numerical prediction of overall mixing efficiency agreed quantitatively with those obtained from the experiments, which show that high mixing efficiency can be obtained in the developed micromixer even the Reynolds numbers of the fluids were very low. The mixing efficiency around the outlet can reach to a value of 98%. This approves the use of helical channel and grooved herringbone is much helpful to the design of micromixer.
II. DESIGN AND FABRICATION
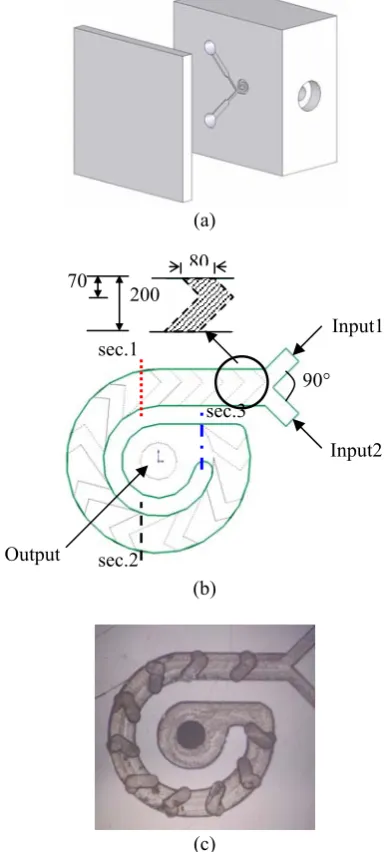
The helical channel micromixer is conjoined with two PMMA plates which are a transparent cover plate and a base substrate as a device support, as shown in Fig. 1(a). The mixing layer includes inlets, outlet and microchannel which
Two Fluids Mixing in a Micromixer with
Helical Channel and Grooved Surfaces
are carved on the base layer. Figure 1(b) and Figure 1(c) show the schematic geometry and the image of the mixing layer, respectively. As it is shown, a 90° Y-type inlet was adopted for the input of mixing fluids and the traditional straight fluid channel was modified to a helical shape. The width and depth of the helical channel are 0.2mm and 0.1mm, respectively. Ten herringbone segments were grooved on the bottom of the mixing plate; the width and depth are 80μm and 25μm, respectively. The length of the shorter leg of the herringbone is 70μm, and the longer leg is 130μm.
(a)
(b)
(c)
Figure 1. (a) Schematic of the helical channel micromixer. (b) Designed geometry of the mixing layer. (c) Image of the helical channel.
Four types of herringbone arrangement were designed, as shown in Fig. 2.Figure 2(a) is the mixer where the arrow tips of these herringbones toward the inlet, and the long and short legs were located at same side. Figure 2(b) is the mixer where the tips of these herringbones were also toward the inlet, but the long and short legs were alternate placed. Figure 2(c) and
2(d) show the mixers where these tips were outward the inlet and oriented along the fluid channel, and the long and short legs were identical and alternate placed, respectively. Four
locations in the mixer were chosen for the inspection of the mixing effect, including three cross sections in the fluid channel and the outlet of the mixer chamber. Section1 apart from the junction of two fluids is l1=0.65mm, section 2 is
l2=1.75mm, and section 3 is l3=2.55mm. The outlet is a circle with a diameter of 0.2mm, the distance to the junction is
l4=2.95 mm.
(a) (b)
[image:2.595.322.530.144.244.2](c) (d)
Figure 2. Four arrangements of herringbone: (a) mixer A, the tip toward the inlet and the legs are identical placed; (b) mixer B, the tip toward the inlet and the legs are alternate placed; (c) mixer C, the tip outward the inlet and the legs are identical placed; and (d) mixer D, the tip outward the inlet and the legs are alternate placed.
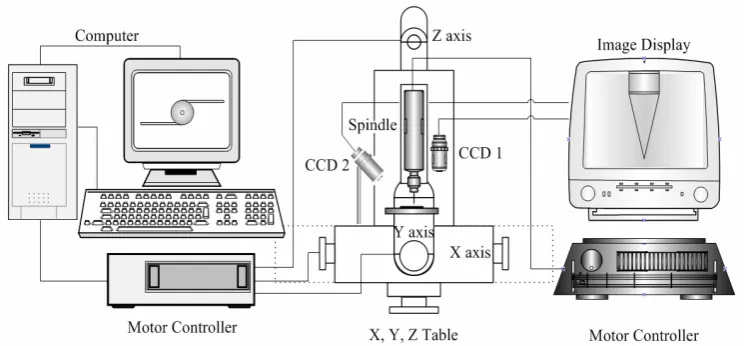
The mixer was fabricated with a self-developed micromachining system, as shown in Fig. 3, which eliminates the needs of high fabrication cost via the MENS process. The micromachining system consists of a high precision X-Y-Z table equipped with a three-axis controller, a high-speed spindle (NSK-400) managed by a motor controller, and two CCD cameras, capable of performing high-speed drilling, milling and cutting operation with real-time monitoring capability.. The high-speed spindle was operated at about 25,000 rpm in the cutting process, while a low speed of 2,000 to 40,000 rpm was used in the drilling/milling applications. One CCD camera of the micromachining system was employed to serve a real-time monitoring purpose, while the other one was used to ensure the correct tool orientation and perform position calibration.
III. MIXING EFFICIENCY EVALUATION ALGORITHM
Here an image inspection method using the variance in contrast of the image gray level as the measurement parameter is adopted. The boundary of the range to be evaluated in a picture can be obtained in advance by using an image processing technique, and the instant normalized relative gray level Eij at pixel (i,j) is defined as [14]
min
1 1
1 1 min
B B
a a M
A A
a a M M M
E
Max cal ij n
q m
p pq n
q m
p Max
pq ij pq ij
ij
ij −
− ⋅ −
− ⋅ ⋅
⋅ =
∑∑
∑∑
= =
= =
(1)
where aij and apq are the image gray level at pixels (i,j) and (p,q), respectively, M is 1 for pixels located inside the evaluated range, and 0 external to it, Mij and Mpq are the
M values at pixels (i,j) and (p,q), respectively. 80
70
200
Input1
Input2
Output
sec.1
sec.2
sec.3
[image:2.595.66.260.195.622.2] [image:2.595.305.542.646.711.2]Figure 3. Schematic of the micromachining system.
Max
A and Amin are the maximum and minimum of pq
ij a
a − in this image, respectively, acal is a gray level used for concentration calibration, BMax and Bmin are the maximum and minimum of aij−acal in this image, respectively, and m×n is the image size. In general, acal is taken with the image gray level that the concentrations of the two mixed fluids are given and usually determined in advance, the normalized relative gray level Eij at pixel (i,j) is one (bright image) in the unmixed region, and zero (dark image) at a pixel with a gray level of acal.
As shown, the cross sections at section 1, 2 and 3 are rectangles, the overall mixing efficiency Etat both sections can be seen as
∑∑
×= b a ab
t a b E
E
0 0
) (
1 (2)
where a×b is the size of the section in the image and Eab is the normalized relative image gray level at pixel
) ,
(ab obtained based on Eq.(1).
As for the inspection of the outlet, a polar coordinate system can be adopted. The overall mixing efficiency Er on a circle of radius r can be defined as
∑ ∫
= R r
r d E R E 0 2 0 ) 2 ( 1 π θ π θ
0<r≤R (3)
where 2π θ θ/2π 0
∫
Er d is the mean mixing efficiency around the circumference of a circle with radius r, Erθ is the normalized relative gray level at a pixel with image coordinate (r,θ), R is the radius of the outlet.
IV. NUMERICAL METHOD
In our experiments, two fluids, pure water and acetone solution, were adopted for the mixing. The governing
equations described the mixing process inside the mixer by solving the continuity, momentum, and concentration with a finite volume discretization technique were given as follows:
( )
( )
(
)
( )
( )
⎟ ⎟ ⎠ ⎞ ⎜ ⎜ ⎝ ⎛ ∂ ∂ ∂ ∂ = ∂ ∂ + ∂ ∂ ⎟ ⎟ ⎠ ⎞ ⎜ ⎜ ⎝ ⎛ ⎥ ⎥ ⎦ ⎤ ⎢ ⎢ ⎣ ⎡ ∂ ∂ + ∂ ∂ ∂ ∂ + ∂ ∂ − = ∂ ∂ + ∂ ∂ = ∂ ∂ + ∂ ∂ j iff j j j i j j i j i j j i i i i x c D x x cu t c x u x u x x p x u u t u x u t ρ ρ ρ μ ρ ρ ρ ρ 0where ui denoted the velocity components in the coordinate direction xi, ρ was the fluid density, μ was the fluid viscosity, t expressed the time, p stood for the pressure, and Diff denoted the mass diffusivity and c denoted the volume fraction of fluid. Where c = 1 stood for cells filled by the first liquid, c = 0 for cells filled by the second liquid, 0 < c
< 1 for cells filled by both fluids. The computer simulation of the mixing behavior was performed with a commercial package, named Ansys CFD. A multi-block structured grid with 75,000~ 142,000 cells was used to descretize the computational domain inside the micromixer.
V. EXPERIMENTAL SYSTEM
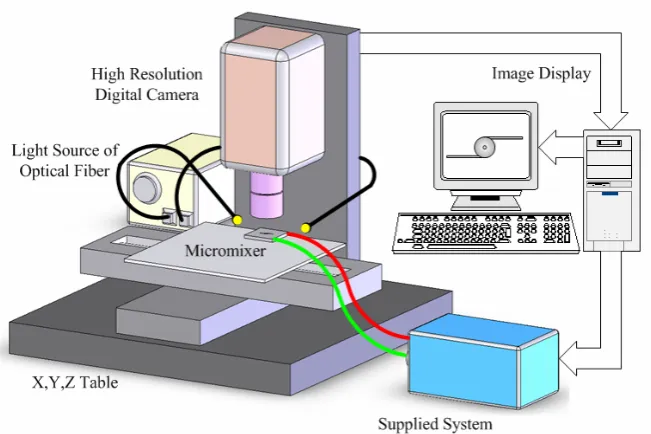
The measurement system included a supplied system and an inspection system, shown in Fig. 4. Two fluids were separately injected into the channels through two inlets at a constant flow rate. The motor driving velocity of the power system was in the range of 0.625 μm/s ~ 31.25 μm/s. The cross area of the pump was 68 mm2, so that the induced flow rate range was 0.0425 μl/s ~ 2.125 μl/s. Flow rates ranging in 0.1 μl/s ~ 1.0 μl/s were applied in our experiments. The related Reynolds numbers of water are 1 ~ 10, respectively. Both channels were identical. The mixing processes were recorded using a high-resolution digital camera (IDT XS-3) with a resolution of 512×512 pixels in a 24-bit color level. The image acquisition speed was 665 frames per second (fps). The field of view was 1.3 mm × 1.1 mm, so that the image resolution was roughly 2 μm/pixel.
(4)
(5)
Figure 4. Schematic of the measurement system.
VI. RESULTS AND DISCUSSION
[image:4.595.323.528.400.739.2]As it was mentioned, the mixing of pure water and acetone solution under the streams with Reynolds numbers as low as 1~10 were investigated. The characteristic Reynolds number of fluids is defined asRe=ρv(4R)/μ, where v is the fluid velocity at the inlet, ρand μ are the fluid density and viscosity, respectively, and R is the hydraulic diameter of the inlet. The concentration of acetone is within a range of φ = 0~0.5. For the purpose of better observation, the pure water was mixed with red dye and the acetone solution was mixed with blue dye. The physical properties of these two fluids are shown in
[image:4.595.44.298.513.593.2]Table 1.
Table 1. The physical properties of fluids
Fluid Water Acetone solution
Dye Color Red Blue
Density 997kg/m3 780kg/m3
Viscosity 1.002×10⁻³N⋅s/m2 0.324×10⁻³N⋅s/m2 Diffusion 2×10⁻⁶kg/m 2.06×10⁻⁵kg/m
The mixing states of the two fluids were first studied with the computer simulation technique via Ansys, a common used commercial package. Fig. 5(a) and 5(b) are the simulated mixing efficiency for the four micromixers with different arrangement of herringbones at Re = 1 and Re = 10, respectively, and the adopted concentration of acetone is 0.5. The transverse axle of the figures represents the fluid channel distance away from the junction of inlets. The four different marks show the mixing efficiencies of the mixers at the three inspection sections and the outlet as chosen and shown in Fig. 1. As shown, better mixings were obtained in mixer A and B, where the tips of these herringbones are toward the inlet, and the mean mixing efficiency around the outlet were almost the same no matter the two legs of these herringbones are identical or alternate arranged. This is because the flows were
refracted to the normal direction of the sideline of the two legs when the fluids move to the grooved herringbone; therefore the contact area of the two fluids was increased. In addition, a 90° rotation was induced when the fluids flow into the outlet, so that the phenomenon of chaotic advection was generated and the mixing effect was instantly lifted.
1 2 3
l ( mm )
Fluid Channel Distance
60 80 100
E
r
( %
)
M
ix
ing
E
ff
ic
ien
c
y
Re = 1
Mixer A Mixer B Mixer C Mixer D
(a)
1 2 3
l ( mm )
Fluid Channel Distance
60 80 100
E
r
( %
)
M
ix
ing
E
ff
ic
ien
c
y
Re = 10
Mixer A Mixer B Mixer C Mixer D
(b)
Figure 5. Mixing efficiency comparisons of four mixers at (a)
Mixer A Re = 1 Re = 10
(a) Images of numerical simulations
[image:5.595.68.528.61.362.2](b) Images of experiments
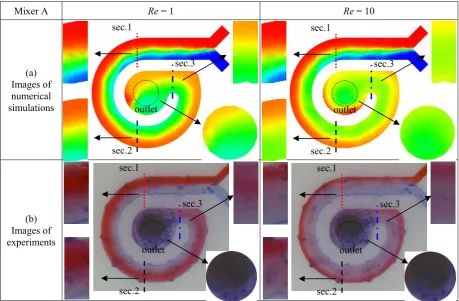
Figure 6. The full-field mixing images from (a) numerical simulations and (b) experiments. Since the simulation results show that the best mixing was
obtained in mixer A, a comparison between simulations and experiments for the mixing status in mixer A was implemented for the fluids with Reynolds numbers at Re = 1,
Re = 5, and Re = 10. Figure 6(a) and 6(b) are the full-field mixing images obtained from computer simulations and experiments, respectively; again, the concentration of acetone of 0.5 was adopted. The related calculated mixing efficiencies at the four inspected locations are shown in Fig. 7.
As it is shown, the tendency of the overall mixing efficiency of the numerical prediction is agreed with those obtained from the experimental measurements. The measured efficiency is a little higher than the simulated result in fluid channel but the final mixing efficiency around the outlet is almost the same for both cases. The obtained mean mixing efficiency around the outlet is usually over 90% even for the fluids with Reynolds numbers as low as Re = 1 and the highest mixing efficiency is reach to a value of 98% in the case of Re = 10. Since the uniform mixing can be achieved within a very short mixing path, the mixer size can be effectively reduced.This provides a valuable reference to the research work in the design of micromixer.
Experiments were also carried out to observe the influence of variations of acetone concentration to mixing efficiency. Figure 8(a) and 8(b) are the overall mixing efficiency distributions for the mixings of pure water with several different acetone concentrations including 0.1, 0.3, and o.5 at Reynolds numbers Re = 1 and Re = 10, respectively. Experimental results show that the change of mixing efficiency caused by the variation of acetone concentration is not obvious.
1 2 3
l ( mm )
Fluid Channel Distance
60 80 100
Er
( %
)
M
ixing
Effic
iency
Simulations
Re = 1 Re = 5 Re = 10
Experiments
[image:5.595.323.525.394.545.2]Re = 1 Re = 5 Re = 10
Figure 7. Mixing efficiency distributions in micromixer A for fluids with Reynolds numbers of 1, 5, and 10.
1 2 3
l ( mm )
Fluid Channel Distance
60 80 100
Er
( %
)
M
ixing
Effic
iency
Re = 10
φ = 0
φ = 0.5
Re = 1
φ = 0
φ = 0.5
Figure 8. The changes of mixing efficiency distribution caused by concentration variations of acetone solution under Reynolds numbers (a) Re = 1 and (b) Re = 10.
sec.1
sec.2
sec.3
outlet
sec.1
sec.2
sec.3
outlet
sec.1
sec.2
sec.3
outlet sec.1
sec.2
sec.3
[image:5.595.321.528.586.740.2]VII. CONCLUSIONS
A novel passive micromixer with Y-type inlet, helical channel, and four arrangements of grooved herringbones was designed and the related mixing effects were studied. These mixers were fabricated with a self-developed micromachining system, that makes the mixers can be easily implemented with low cost. The mixing of pure water and acetone solution were performed to investigate the mixing efficiency of fluids under low Reynolds numbers. The mixing processes were numerically simulated via a commercial package. Inspected results show that the design of helical fluid channel and grooved surface can much increase the contact area of the mixing fluids and enhances the mixing effect. The numerical prediction of mixing efficiency agreed with those obtained from the experimental measurements. The best mixing was found in the case that the tips of the grooved herringbones toward the inlet. In addition, the design of helical channel can reduce the size of the micromixer. This means that a more compact microfluid device compares to the traditional mixers with straight channel could be expected.
ACKNOWLEDGMENT
The authors gratefully acknowledge the support of the National Science Council of Taiwan, the Republic of China, under project number NSC96-2221-E-253-010.
REFERENCES
[1] Q. Yao, J. Dong and P. M. Ferreira, “Design, analysis, fabrication and testing of a parallel-kinematic micropositioning XY stage,” Mechine tools and manufacture, Vol. 47, pp. 946-961, 2007.
[2] Giordano N and Cheng J T 2001 J. Phys. Condens. Matter 13, R271.
[3] Nguyen N T and Wu Z 2005 J. Micromech. Microeng. 15, R1.
[4] Wong S H, Michael C L W, Christopher W W 2004 Sens. Actuators B. Chem. 100, 359–379.
[5] Liu Y Z, Kim B J and Sung H J 2004 Int. J. Heat Fluid Flow 25, 986–995
[6] Aubina J, Fletcherb D F and Xuereba C 2005 Chem. Eng. Sci. 60, 2503 – 2516
[7] Maea K, Makia T, Hasegawa I, Eto U, Mizutani Y and Hondab N 2004 J. Chem. Eng. 101, 31–38.
[8] Wong S H, Bryant P, Ward M and Wharton C 2003 Sens. Actuators B. Chem. 95, 414–424.
[9] Choi, Y. J., Chung, S. T., Oh M. and Kim, H. S., "Investigation of Crystallization in a Jet Y-Mixer by a Hybrid Computational Fluid Dynamics and Process Simulation Approach" Crystal Growth and Design Vol. 5, 2005, pp. 959-968.
[10] J. M. Ottino, 1989 The Kinematics of Mixing: Stretching, Chaos, and Transport (Cambridge: Cambridge University Press)
[11] Y. H. Hu, M. Chang, and K. H. Lin, “A Study of Mixing Characteristics for a Micromixer with Helical Channel and Grooved Surfaces,” Journal of the Chinese Society of Mechanical Engineers, Vol. 27, No. 5, pp.605-609 , 2006 (EI).
[12] Stroock, A. D., Dertinger, S. K. W., Ajdari, A., Mezic, I., Stone, H.A. and Whitesides, G. M., "Chaotic mixer for microchannels, " Science Vol.295, 2002, pp. 647–651.
[13] Liu, R. H., Stremler, M. A., Sharp, K. V., Olsen, M. G., Santiago, J. G., Adrian, R. J., Aref, H. and Beebe, D. J., "Passive Mixing in a Three-Dimensional Serpentine Microchannel, " J. Microelectromech. Sys., Vol.9, 2000, pp. 190-197.
[14] Oddy, M. H., Santiago, J. G. and Mikkelsen, J. C., "Electrokinetic instability micromixing, " Anal. Chem. Vol.73, 2001, pp. 5822–5832. [15] Hu Y H, Chang M and Lin K H 2005 J. Microlith., Microfab.,