warwick.ac.uk/lib-publications Manuscript version: Author’s Accepted Manuscript
The version presented in WRAP is the author’s accepted manuscript and may differ from the published version or Version of Record.
Persistent WRAP URL:
http://wrap.warwick.ac.uk/117435 How to cite:
Please refer to published version for the most recent bibliographic citation information. If a published version is known of, the repository item page linked to above, will contain details on accessing it.
Copyright and reuse:
The Warwick Research Archive Portal (WRAP) makes this work by researchers of the University of Warwick available open access under the following conditions.
© 2019 Elsevier. Licensed under the Creative Commons Attribution-NonCommercial-NoDerivatives 4.0 International http://creativecommons.org/licenses/by-nc-nd/4.0/.
Publisher’s statement:
Please refer to the repository item page, publisher’s statement section, for further information.
1
Information Visualization for Science & Policy:
1
Engaging Users & Avoiding Bias.
23 4
Authors: McInerny, G J1,2*, Chen, M3, Freeman, R4, Gavaghan, D1, Meyer, M5, 5
Rowland, F6, Spiegelhalter, D. J7, Stefaner, M8, Tessarolo, G9,10, & Hortal, J10. 6
*Correspondence to: [email protected] 7
8
Affiliations: 9
1
Department of Computer Science, University of Oxford, Wolfson Building, Parks Road, OX1 3QD, 10
UK. 11
2
Computational Science Laboratory, Microsoft Research Ltd, 21 Station Road, Cambridge CB1 2FB, 12
UK. 13
3
Oxford E-science Research Centre, 7 Keble Road, University of Oxford, Oxford, OX1 3QG UK. 14
4
Institute of Zoology, Zoological Society of London, Regent's Park, London NW1 4RY, UK 15
5
Scientific Computing and Imaging Institute, School of Computing, University of Utah, Salt Lake 16
City. Utah, 84112 USA. 17
6
EMBL, European Bioinformatics Institute, Wellcome Trust Genome Campus, Hinxton, Cambridge, 18
CB10 1SD. 19
7
Statistical Laboratory, Centre for Mathematical Sciences, University of Cambridge, Wilberforce 20
Road, Cambridge, Cambridge CB3 0WB, UK. 21
8
Freelance information visualization expert, Lilienthal, Germany. http://moritz.stefaner.eu 22
9
Departamento de Ecologia, Instituto de Ciências Biológicas – ICB, Universidade Federal de Goiás 23
– UFG, Goiânia, GO, Brazil 24
10
Dept. de Biogeografía y Cambio Global, Museo Nacional de Ciencias Naturales (CSIC). C/José 25
Gutiérrez Abascal 2, 28006 Madrid, Spain. 26
2 ABSTRACT
28
Visualisations and graphics are fundamental to studying complex subject matter. 29
However, beyond acknowledging this value, scientists and science-policy programmes rarely 30
consider how visualisations can enable discovery, create engaging and robust reporting, or 31
support online resources. Producing accessible and unbiased visualisations from complicated, 32
uncertain data requires expertise and knowledge from science, policy, computing and design. 33
However, visualisation is rarely found in our training, organisations or collaborations. As 34
new policy programs develop – e.g. ‘Intergovernmental Platform on Biodiversity & 35
Ecosystem Services’ (IPBES) – we need information visualisation to increasingly permeate 36
both the work of scientists and science-policy. The alternative is increased potential for 37
missed discoveries, miscommunications and at worst, creating a bias towards the research 38
that is easiest to display. 39
40
VISUALISATION: EXPLORING AND COMMUNICATING INFROMATION 41
Visualisations and graphics are the most universally engaging of outputs. Yet the 42
issues of producing informative, engaging and unbiased visualisations (exploratory graphics 43
to publication figures, all the way to interactive web interfaces) have received little attention 44
in the Biodiversity Sciences, or Science-Policy. This is despite huge recent developments in 45
the expertise, knowledge, software, web technologies, and the cultural understanding of both 46
visualisation and data. 47
These developments come at a critical time. Scientific research and policy are further 48
accelerating investments into understanding, predicting and managing changes in the global 49
3 organisations come to explore and communicate the wealth of information being produced 51
[9–11]. Turning vast amounts of often complex data and information (Figure 1) into outputs 52
that scientists can study effectively, and that can then engage diverse users and stakeholders, 53
requires that we value and invest in visualisation and graphics. When subject matter is 54
intangible (e.g. due to scale, complexity or abstraction) [12,13] visualisations play a 55
fundamental role in exploring information and generating understanding [14]. In addition to 56
an open scientific infrastructure [15], visualisation and graphics should be amongst the main 57
priorities for developing modern science and science-policy. 58
Written science-policy reports are often subject to a “common approach and 59
calibrated language” [16]. Such conventions are an essential component of communication 60
strategies and assist with building reputation - for instance, by indicating scientific 61
confidence and framing scenario storylines [16]. The same considerations should apply to 62
visualisations, and actually go further given how easily visuals can engage and influence non-63
expert audiences across language barriers. Without joined-up strategies for developing and 64
disseminating visualisations and graphics (Box 1), those involved in science and science-65
policy are missing many opportunities and could bias scientific understanding and policy 66
communications towards that which is easiest to display. 67
Whether through a lack of training or collaboration, a lack of engagement with 68
visualisation will potentially lead to ineffective and biased visualisations. In an age of 69
heightened scientific scrutiny [17,18], this could impact levels of engagement with science 70
and science-policy, and reduce the reputation of both. To be effective, policy initiatives such 71
as IPBES (Box 1) should ensure investment and innovation in visualisation and visual 72
communications keeps pace with the advances being made in scientific research and science-73
4 and science-policy deserves a significant response [10]. As put by Fischhoff [19], refusing 75
help in communication deserves heavy criticism because the stakes are so high. 76
In this article we explore four key issues for increasing the role visualisation plays in 77
science and science-policy, which in turn introduces a host of issues in graphical 78
representation [20], technical implementation [21], multidisciplinary collaboration [22], and 79
user-centred design [23]. Whilst we frame some of our discussion around the newly forming 80
IPBES (Box 1), the arguments and proposals are relevant to the use of visualisations 81
throughout science and science-policy (Box 2). We put forward four suggestions for building 82
capacity in visualisation for our communities (Box 3). 83
84
TRUTH AND BEAUTY: WHAT WE HIDE IN VISUALISATIONS 85
Science can have an awkward relationship with style and beauty. For instance, 86
visualisations that are highly engaging can appear disassociated from data sources [24], 87
appear to advocate particular information by giving it prominence [25], or good visualisations 88
might be interpreted as effort diverted away from the science. However, irrespective of 89
content or function, compelling graphics can also create an impression of truth [26] (a so 90
called “Cartohypnosis” [27]) and a lower value or reputation can be attributed to poor designs 91
[28–30]. Any visualisation should be produced with an understanding of these potential 92
biases in audiences’ perceptions and take control of them. 93
Maps - Visualising geo-spatial data is a key example of how an image can both 94
display and hide information. Within maps considerable amounts of content can be attractive 95
and familiar geographic patterns (such as the relative sizing of geographic regions, 96
boundaries, contours, spatial patterns, and other topologies). This potentially distract from the 97
5 the crafting of maps, it can be difficult to discern what information is being displayed, and the 99
nature of models and data underlying an analysis. For instance, models developed using just a 100
few highly localised data points (Figure 2a) can be extrapolated to far larger regions (Figure 101
2b) [31], then interpolated to far finer scales than the original data (Figure 2c) and then 102
summarised for geo-political regions (Figure 2d). If we actually take control of the different 103
ways visualisations can influence a user (e.g. differences in design and prominence [32–34], 104
sensual, imaginative and analytical stimuli; see refs in [35],), we can make rigorous design 105
choices that reduce bias and visual rhetoric [36]. For instance, maps might be an obvious 106
means to display geo-spatial information outputs, but not always be the clearest way to 107
explain quantitative features of analysis and its raw outputs. 108
Reproducible and Reusable resources – In order not to hide information, we must 109
recognise that visualizations are not reality [37]. They are representations of data derived 110
from a suite of transformations, filters and visual encodings that have produced the particular 111
style and storyline of a visualisation. Just like any scientific model, the provenance of these 112
choices should be recorded [38,39] so queries of, and reproducibility from, the source 113
materials [21,40,41] are possible. Any particular visualisation could then be re-used in 114
equivalent comparisons with alternative data sources, or alternative visual encodings can be 115
used with the same data (e.g. map projections [42]). 116
Uncertainty - Balanced reporting of findings is essential in science and at the science-117
policy interface [16] but few visualisations convey our ignorance alongside our knowledge 118
[26,43,44]. Omitting uncertainty can promote the apparent precision of data or models, 119
especially if an average or single sample of all possible outcomes is displayed. In science-120
policy, “calibrated and traceable” [16] conventions are used to indicate confidence and 121
6 guidelines and conventions for visualisations and visualising uncertainty are not currently 123
available. Visualising uncertainty is an active research domain even if it is an unresolved 124
issue in information visualisation research (see below). 125
126
DESIGNING FOR NON-SCIENTIFIC AUDIENCES 127
Science-policy audiences are highly diverse [15,40] and often receive information in 128
far richer digital environments (e.g. online applications, software, games) than science 129
typically provides. The page-limited print layouts of academic journals can impose rigid 130
technical formats onto graphics that limit their re-use [45]. For instance, where huge numbers 131
of individually informative pixels are irretrievably crammed into small rasterised images [46] 132
(Figure 2c) and where graphics are otherwise dependent on text, or a publication’s format. 133
Scientific outputs are then produced making numerous assumptions about audiences’ 134
numeracy, vocabulary, expertise and level of interest. 135
Experts and novices can also reason in different ways [20] and might require different 136
design features. Decision and policy makers are obviously a key audience [47] but they too 137
are a highly diverse user group and are not always going to be scientifically or statistically 138
expert [16]. Thus, even if science is freely available (e.g. open, publically available science) 139
it can remain broadly inaccessible because science produces a static explanation of research 140
that often requires specialist expertise to understand. Ideally, science would be able to cater 141
for multiple audiences within interactive devices that allow users to explore scientific 142
knowledge on their own terms. 143
Interactive visualisations - Richer approaches to communicating scientific 144
information could use visualizations and graphics based on those that enabled scientists’ own 145
7 models and visuals within an interactive tool [21]. Users might then select presentation styles 147
suiting their expertise and knowledge, and select particular abstractions, scales, locations or 148
scenarios based on their own background, interests or serendipitous choices. Such user-driven 149
selections should maintain some connection to the broader context of information. These 150
principles should be applied to all types of information contributed to the IPBES (Box 1). 151
One example comes from the ‘Protected Planet’ web interface [48] where users are 152
encouraged to edit a community version of data records and rate submitted photographs, 153
when accessing the World Database on Protected Areas (WDPA). 154
Design Approaches - Scientists rarely come into contact with the full breadth of 155
potential audiences [25] and might not always understand their characteristics and 156
motivations. User-centred [23] and Participatory design approaches [49] explicitly involve 157
stakeholders in the development and design processes, and could better ensure the diversity 158
of user needs are met (Box S1). For instance, policy audiences need to re-communicate 159
information to secondary audiences (e.g. other policy audiences, companies, public & media) 160
and this reuse could be included in the design of visualizations in order to minimise the biases 161
arising through a chain of communicators, especially where scrutiny can increase along that 162
chain [17]. Likewise, ethnographic research and user studies [50] could generate insights that 163
strengthens and shortens the information pathways between stakeholders and that increases 164
the flow of information. Successful design requires realistic consideration of the demands 165
that success may entail [51] - for instance, moving beyond communication of ‘facts’ towards 166
empowering ‘understanding’[52]. Thus, many benefits will come evaluation procedures that 167
reflect diversity in end-users (Box S2). The ‘Future Earth’ programme is embarking on taking 168
on some of these challenges by developing a “co-design” process and by integrating 169
visualisations within any data services provided [3,53]. Given the rarity of this ethos, how the 170
8 172
REDUCING THE MULTIDIMENSIONALITY OF COMPLICATED 173
INFORMATION 174
Most visual interfaces are 2-dimensional (paper, computer displays) and present 175
considerable challenges for displaying complex multidimensional information (Figure 1) 176
[54]. For instance, it can be difficult to include further information (such as uncertainty) into 177
heat maps and choropleth maps (see Figure 2d) because the primary axes are already fixed to 178
the spatial dimensions of the data. Any further information must then be incorporated by 179
elaborating on the map by re-designing the glyphs for each spatial position (see below), or by 180
developing an interactive interface (see above) or using an alternative visualisation design 181
altogether. 182
Empirical information visualization research has explored some possibilities for 183
displaying complex information [55–57] but there are very many possible design solutions 184
and a single definitive design recipe might not exist (e.g. combinations of colours, glyphs, 185
axes, animations, brushing, layouts, interactions…). Whatever visual strategy is ultimately 186
used, it is important that scientific and statistical details are not altered. For instance, where 187
data is based on multiple models, a summary heat map can be produced from an average 188
‘model ensemble’ [58]. However, this design choice can alter the properties of the underlying 189
models through re-scaling (Figure S1) and so introduce a systematic bias into the scientific 190
message. 191
Interactive exploration and user narratives - Multidimensional information can be 192
difficult for experts to navigate, let alone non-experts. A robust ‘mental model’ might only 193
develop through a user themselves exploring the complex relationships involved in a system, 194
9 figures that summarise information, rather than producing ‘exploratory’ knowledge interfaces 196
where audiences can ‘learn by doing’ [60]. One solution for simplifying multidimensional 197
information is to produce a narrative that focuses on a subset of scenarios, data sources, 198
content or otherwise contrasts information in order to create a manageable and informative 199
storyline [61]. The narrative can focus on particular categories in a data set, or particular 200
parameters in a model, in order to reduce guide users’ learning. In principle, users could 201
construct and share narratives themselves through interactive features by selecting 202
components of a data set that interest them [62] (e.g. data filters, or model and scenario 203
selections)(Figure S2, Box 2). For instance, where user interfaces have many options [63], 204
users can select their own visualisation, which could be recorded and then compared to those 205
of other users [64]. Such interactivity should be carefully designed to ensure the resultant 206
narratives, through editing or user interactions, are complementary to the whole scientific 207
message [65–67]. 208
Re-designing components of visualisations – Altering the graphical layouts (e.g. split 209
views, or superimposed and summarised views [68]) and glyphs (data icons and symbols) 210
[69] of a visualisation can offer many effective strategies for reducing the dimensionality of 211
information displays, for instance when communicating any data with estimates of its 212
uncertainty [70]. These design solutions should simplify a visual display, but also maintain an 213
unambiguous relationship between our visual and non-visual terminology (e.g. metrics, 214
definitions, abstractions, uncertainty, ignorance), and the data. Combining multiple 215
information sources into glyphs is one of the most obvious solutions but has many potential 216
issues, such as altering the prominence and interpretation of particular values, producing 217
unwanted clustering and layering effects, or causing the observer to infer unintentional 218
secondary patterns (Figure S1, i-iv). Practical design solutions will be broadly applicable 219
10 pattern. Solutions should also remain simple, such that the graphical cues that users are 221
confronted with are not overloaded and do not render an undecipherable “visual puzzle” [71]. 222
Perceptual stress can impede or bias users’ comprehension, or at worst cause audiences to 223
disengage. These issues of layout and visual encoding continue to be a hot topic in science 224
and information visualization [22] and visualisation research could be explicitly based on the 225
context of use found in science and science policy. 226
227
ADDRESSING A TRANSDISCIPLINARY PROBLEM 228
Rather than being a design or technical service that can be outsourced as an 229
afterthought, appropriate information visualization and communication strategies must come 230
from early integration of visualisation tools and expertise. For instance, by linking those who 231
contribute to, curate, and analyse data and information sources, to designers, communicators 232
and engineers, and then to those who collate and apply that knowledge (Box 1). Vibrant 233
research programmes exist in each of these domains, but their integration is currently 234
insufficient [22]. If a visualisation and visual communication strategy is to be produced that 235
befits the demands of science-policy programmes such as IPBES (see Box 1) this situation 236
must change. There has not been significant engagement or influence on training within 237
ecology and biodiversity sciences to fill those gaps in expertise [12]. 238
Within visualisation, research programmes do exist in visualizing uncertainty [20,72] 239
and the composition of interactive mapping tools [56]. However, this research often uses 240
different forms of data and uses highly controlled user scenarios that do not necessarily 241
support the challenges that scientists face. In addition, scientists might not actually be aware 242
of this literature. The isolation of these fields then needs to be corrected through an on-going 243
11 the science and policy into visualisation research, and then use that research. This requires 245
individuals and groups (translators) who can lead the way by verbalising the challenges, 246
translating the research and developing examples that inspire progress. 247
Enabling multidisciplinary collaborations - To make advances, scientists and science-248
policy initiatives, (such as the IPBES and Future Earth [3]) must broker collaborations that 249
could produce a joined-up approach to visualisation (Box 1). Potential contributors and 250
collaborators might be unaware of these domains and a clearly defined agenda for 251
engagement that goes beyond stating high level requirements for ‘decision support systems’ 252
[73], ‘web portals’ [74] and ‘user friendly’ resources [18]. We cannot expect visualisation 253
practitioners to passively understand our outputs and practices, nor passively diffuse into key 254
roles in our work. Moreover, science-policy programmes are complex, and might not be well 255
understood. Then, organisations need to work hard to communicate themselves and their 256
goals in ways that are not daunting or hindered by organisational barriers. Plans for resource 257
provision must then account for the eligibility of key contributors (e.g. freelancers, 258
businesses) for funding bids and pose visualisation as more than a service. In sum, a balance 259
must be struck between outsourcing visualisation to experts (which would undoubtedly 260
overlook expertise required from the other domains) and embedding visualisation in all other 261
activities (which would dilute visualisation expertise). We must sow the right seeds if we are 262
to embed the relevant expertise within our scientific and science-policy communities. 263
Generating impact - It is hard to argue against the huge role visually engaging web 264
interfaces could play in reaching users [75] (Box 2). However targeted user research is 265
needed early on in the process to ensure that the goals are realised. Much can be learned from 266
programmes in ‘Open Science’ which aim to increase the accessibility of science [15], but 267
12 then huge opportunities and large incentives for individuals and organisations to take 269
visualisation seriously. For instance, research can gain increased credibility and influence if it 270
directly addresses stakeholder engagement, and potentially receive increased funding. Both 271
top-down (science-policy; e.g. funding, publishing, hiring, policy development, engagement) 272
and bottom-up responses (scientists; e.g. funding bids, training, collaboration) are needed to 273
improve our visual communications, and the accessibility and usability of research more 274
generally. 275
276
CONCLUSIONS AND PRACTICAL STEPS 277
Success in both science and policy are predicated on reliable and unbiased 278
understanding. Furthermore, our strategies for communicating and curating of knowledge are 279
fundamental to the structure and impact of both science and science-policy interfaces 280
[47,73,77]. Thus, it is highly surprising, if not a major failure, that visualisation and visual 281
communication have been so overlooked in the training of scientists [12] and within the 282
development of science-policy work programmes [10]. Visualization should be supporting 283
the whole information pipeline; from acquiring and exploring data and analysing models, to 284
the visual analytics used to reason across research and assessment activities [13,78], all the 285
way to storytelling [61] for communicating background information, results and conclusions. 286
Objective and rigorous visualisations and communications will not be developed without 287
addressing the challenges of their production [12,72]. 288
‘Biological visualization’ offers a great example of successfully embedding 289
visualization into science and science-policy [14,79] – e.g. in producing visualisations that 290
enable exploration of large, complex data sets [80,81] using an explicit understanding of user 291
13 further progressing the development of biological visualisation [79]. This level of success is 293
enabled by significant levels of visualisation expertise, training, publishing opportunities, and 294
conferences (amongst others), which is not generally the case in our sciences. Like biological 295
visualisation, we should build recognition that visualisation is a highly valued career path in 296
science. So far we have not seized upon the variety of visualisation opportunities available, 297
despite the obvious and immediate benefits that have been available for some time. 298
Given the topics we have introduced and discussed, we present a number of 299
suggestions to generate some capacity which will allow us to act upon these issues and 300
challenges (Box 3). These suggestions target both top-down and bottom-up responses to the 301
current poverty in information visualisation we see in our sciences. There are many reasons 302
to think progress is possible. For instance, technological and research developments have 303
precipitated significant expertise in information- and data- visualization, information graphics 304
and data journalism. When combined with increased cultural awareness of data, visualization, 305
and informatics (and given the web infrastructure) there are huge opportunities to improve 306
the use of visualisations within and beyond science. 307
From governments [60] and research organisations to the media [83], communication 308
strategies for complex and uncertain scientific research are being re-considered. These pieces 309
offer the foundations for science and science policy to build on, and for scientists to work 310
towards. The stage is then set for science and science-policy to become visually astute. What 311
are we going to do about it? 312
14 Glossary:
314
Brushing: Where a user positions the cursor or pointer on a screen to activate a secondary function in 315
an interactive application. For instance, by selecting a subset of data via a mouse which then 316
highlights certain values by changing colour or appearance, or triggering another operation such as 317
activating a label by hovering over a subset of the visualisation. 318
Choropleth Map: A map visualisation where political regions, biomes, or other areas are colour 319
coded for the value of a variable within those areas (such as a climate variable or population size) (see 320
figure 2d). Unlike a heat map (see below, figure 2b), producing a choropleth map might require 321
further data manipulation to summarise results for the desired boundaries (e.g. averaging or 322
interpolation for those areas) from a gridded model for example. 323
Co-Design: Defined as “an active involvement of researchers and stakeholders during the entire 324
research process” [53]. Within this process, researchers and stakeholders work together when 325
defining research questions, methods and defining a strategy for disseminating results, in order to 326
produce trans-disciplinary and targeted approaches to science-policy [53]. Stakeholders can include 327
academic research, science-policy interfaces, policy makers, funders, governments (regional, national 328
and international), development groups, corporations, businesses and industry, public, and the media 329
[53]. 330
Ethnography: Research seeking to understand individual and cultural responses to tools (e.g. 331
software, new information, methods). Ethnography may investigate how users interpret and 332
understand the tools, build relationships with those tools, as well as define the context of use for these 333
tools in real situations. For instance by understanding how people come in to contact with particular 334
information resources, as well as understanding how they interact with those resources, or share those 335
resources and information. Ethnography is highly complementary to Participatory- and User-Centred-336
15
Future Earth: Launched in 2012, Future Earth is an international research programme formed to 338
provide critical knowledge on global environmental change and global sustainability [53]. 339
Glyph: A symbol used to represent information. Simple glyphs could be circles or other shapes used
340
to mark a location in a simple x, y plot. More complex glyphs can encode multiple sources of 341
information by using the different visual channels (shape, size, colour, orientation, brightness, texture, 342
location) in a variety of combinations. 343
Graphical layout: The relative positioning and sizing of different components of a visualisation. For 344
instance, where multiple graphs or figures are used a layout structures the relationship of the different 345
information sources. The layout may communicate some context, or develop a narrative. Examples 346
include inset graphs, small multiple plots (see below), or linked views in a visualisation. 347
Heat map: Visualisation using a colour coding system to represent the values of a matrix or grid 348
system (e.g. a gridded map). Heat maps can use a range of colour encodings, or have multiple features 349
where those square glyphs are augmented (see “glyph” above). 350
Information visualisation: The processes of producing visual representations of data and the outputs 351
of that work. Information Visualisation aims to enhance human’s ability to carry out a task by 352
encoding often highly abstract information into a visual form. Visualisations can be static, or 353
interactive and dynamics, and hosted in a variety of media (e.g. journal, poster, website, software). 354
Intergovernmental Platform for Biodiversity and Ecosystem Services: see Box 1
355
Linked Views: Interaction where a user interacts with a component of a visualisation that prompts a 356
change in one or more other visualisations. The visualisations can have different axes, glyphs, 357
dimensions or other visual encodings. For instance, one may hover a cursor on a map which feeds that 358
location data to a visualisation highlighting relative rank of that data amongst all locations. 359
Model Ensemble: A modelled representation comprising of multiple sources of information, more 360
specifically referring to a group of models being used together rather than separately. Each model 361
16
Narrative: A structure developed to reveal information in a particular order, or in particular contrasts, 363
in order to make a point, contextualise information, to pose certain questions, or otherwise create 364
storylines. Narratives can be developed by embellishing graphics and visualisations with annotations, 365
labels or other text, by including other information such as pictures, or via layouts, interactions and 366
animations. 367
Participatory Design: A process for designing and developing a product that actively involves 368
stakeholders within the whole design process. Unlike ‘User-Centred-Design’ (see below), 369
participatory approaches can involve greater integration of users in the whole design process. 370
Science-Policy: The activities and outputs using scientific information to inform and guide general 371
strategies or particular tactics within the policies of governments, NGOs or other organisations. 372
Small Multiples: A series of graphs using common axes and encodings within a single graphical 373
layout. Small multiples allow different categories to be separated and contrasted where plotting all 374
data simultaneously would result in occluded categories or an otherwise unclear graphic. Small 375
multiples can also be used to develop a narrative (e.g. different patterns evolving through time). 376
Stakeholder: An individual, group, or organisation that is, or could be, affected by a process or 377
output, or that can affect that process or output. Stakeholders may share a common interest but 378
possibly for very different reasons (such as farmers, agricultural scientists, policy makers). 379
User-Centred-Design: The process which involves direct interactions with end users when defining,
380
developing and testing a product. From the outset, user requirements are developed so that products 381
are based on a deep understanding of users’ education and abilities, as well as their goals, behaviours 382
and motivations, the technology they use, and in what environments (context of use). In contrast to 383
participatory design, users may not be directly involved in the design process. 384
Uncertainty: Uncertainty can refer to a variety of concepts including ignorance, incompleteness, 385
variation, and stochasticity. Uncertainty can be derived from incomplete knowledge, imperfect 386
methods, sources of measurement or observation bias and propagation of multiple sources of 387
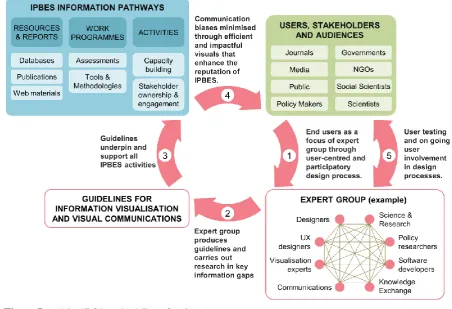
17 BOX 1: IPBES - INTERGOVERNMENTAL PLATFORM ON BIODIVERSITY & 389
ECOSYSTEM SERVICES 390
Following the 2010 UN general assembly, the ‘Intergovernmental Platform on Biodiversity & 391
Ecosystem Services’ (IPBES, www.ipbes.net) has developed around the aims of providing an 392
independent scientific platform for biodiversity, and generating significant policy influence. IPBES 393
will frequently deal with complicated large-scale models and multidimensional data resources 394
[1,78,84] that are challenging for experts to analyse let alone communicate [40,57] (Figure1). Given 395
these goals [84] the IPBES faces some immensely demanding challenges - in addition to providing 396
large-scale scientific assessments, the IPBES must engage diverse audiences with diverse services and 397
outputs, whilst ensuring stakeholder ownership and engagement, and also increasing these activities’ 398
efficiency through effective communication [73]. These are demanding goals. Data visualizations and 399
graphics could enhance all these activities within the policy reports and web interfaces that are 400
intended to make vast amounts of data, assessments and documentation accessible (see main text). By 401
firmly embedding visualisation and graphics into its work programmes, the IPBES can immediately 402
go further than previous science-policy programmes, such as the IPCC (Intergovernmental Panel for 403
18 405
Figure I (w * h; 17.35cm * 11.7cm; 3 column)
406
An expert group could provide guidelines and strategy which underpin all IPBES outputs and
407
activities. By contextualising communications from the perspectives of end-users, and within the 408
diverse components of the IPBES information pathways, an expert group could help generate efficient 409
and engaging visual communications. As part of a user-centred and iterative design cycle IPBES 410
information pathways could be developed to maximise their effectiveness and impact 411
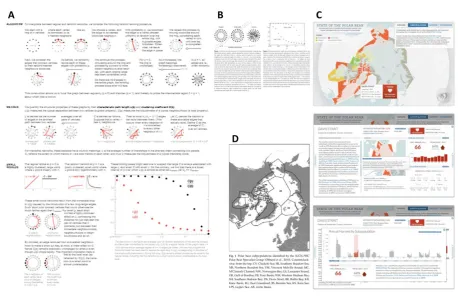
19 BOX 2: FROM SCIENTIFIC PAPERS TO INTERACTIVE VISUALISATIONS
414
[image:20.595.67.526.104.403.2]415
Figure I (w * h; 17.35cm * 10.9cm; 3 column)
416
Two examples of creating interactive visualisation interfaces alongside graphics from the
417
original scientific papers. In thefirst example -“Scientific Communication As Sequential Art” [85] – 418
(A) Bret Victor redesigned a scientific paper, deconstructing the narrative and recomposing it using 419
visualisations, alternative layout and interactive features. Based on the work of (B) Watts & Strogatz 420
[86] the ‘page’ produced by Victor leads a user through the algorithm and metrics that underlie the 421
models being reported. The redesign breaks down the important steps to understanding into 422
manageable steps, which can easily be referred back to as the user develops an overall understanding. 423
Unlike a scientific paper, interactive features allow users to explore the effects of parameters on 424
particular parts of the algorithm or metrics by playing. This example alludes to how a complex 425
theoretical study (or an applied model) could be redesigned using visualisations and dynamic 426
20 The second example - “State of the Polar Bear” [63] - is an interactive tool designed and developed 428
by the data visualisation company Periscopic, for the IUCN Polar Bear Specialist Group 429
(http://pbsg.npolar.no/en/index.html). The Polar Bear Specialist group advises science-policy and 430
management organisations on the latest scientific knowledge using a variety of information sources 431
that includes more than a thousand articles. (C) Within the interactive tool, diverse and fragmented 432
information resources are brought together into a single web application based on interactive 433
visualisations. Users can explore and display data on spatial location, population trends, threats, 434
pollution studies, and harvesting information, and also find refernces upon which this information is 435
based. (D) Unlike the scientific literature resources [88], this tool is open access, accessible, dynamic 436
and engaging. In a short time a user can become acquainted with a variety of information sources and 437
through these experiences, and build a picture of the patterns and threats to a species in a way that 438
collections of scientific articles cannot achieve. Also see a new tool - http://globalcarbonatlas.org/ - 439
for exploring carbon fluxes. 440
B Adapted by permission from Macmillan Publishers Ltd: Nature Watts & Strogatz [86], © 1998. 441
21 BOX 3: FOUR SUGGESTIONS FOR BUILDING VISUALISATION CAPACITY IN 443
OUR COMMUNITIES. 444
Demand and nurture better quality visualisations and graphics in our science by 445
implementing appropriate training; higher standards for visualisations in journals; and 446
reframing the role of visualisation should play in our scientific work. Increased grass roots 447
expertise will make all other suggestions easier. 448
Hire expertise and embed it within our organisations in order to seed exemplar 449
projects and work practices; embed expertise that can co-ordinate and deliver appropriate 450
training programs; and to contextualise visualisation research on problems with a direct route 451
to application and further collaboration with visualisation communities. 452
Embed visualisation in science-policy and knowledge exchange programs by fusing 453
expertise into the processes at an early stage; generating user-requirements and user stories to 454
provide context for the design of visualisations; and producing visualisation and visual 455
communication guidelines that set appropriate standards for designing and evaluating 456
graphics, which should include strategies for engaging further expertise (see below). 457
Ensure that we can communicate our science and science-policy programmes in 458
appropriate ways to the various areas of expertise that we need to engage – from academic 459
visualisation researchers and visualisation practitioners, to user experience designers and 460
informatics professionals; all the way to designers and communications specialists. 461
22
ACKNOWLEDGMENTS
463
We thank Microsoft Research Connections for funding the 2 day workshop “Visualising the future of 464
our planet - Can we do better than heat maps?” (organised by GJM, April 2012), and thank all 465
attendees for their contributions during the workshop (Gregor Aisch, David Alderson, Lisa Evans, 466
Mark Freeman, Peter Gassner, Sean Hanna, Jack Harrison, Benjamin Henning, Tim Jupp, Lindsay 467
Lee, Vassily Lyutsarev, Ayman Mogniegh, Rod Page, Mike Pearson, Drew Purves, Tim Regan, Ian 468
Short). We are very grateful to Georgina Mace, Kate Hauxwell, Paul Craze and two anonymous 469
reviewers for comments on the Manuscript. GJM, RF, & DG are part of the “2020 Science” 470
programme (www.2020science.net/) funded by the EPSRC Cross-Discipline Interface Programme 471
(grant number EP/I017909/1) and Microsoft Research. 472
473
REFERENCES
474
1 Clark, J.S. et al. (2001) Ecological forecasts: an emerging imperative. Science 293, 657–60 475
2 Perrings, C. et al. (2011) Ecology. The biodiversity and ecosystem services science-policy 476
interface. Science 331, 1139–40 477
3 Earth, F. (2013) , Draft initial design report. http://www.icsu.org/future-earth/media-478
centre/relevant_publications/FutureEarthdraftinitialdesignreport.pdf 479
4 Scholes, R.J. et al. (2008) Ecology. Toward a global biodiversity observing system. Science 480
321, 1044–5 481
5 Pereira, H.M. et al. (2010) Scenarios for global biodiversity in the 21st century. Science 330, 482
1496–501 483
6 Millenium Ecosystem Assessment. http://www.unep.org/maweb/en/index.aspx 484
7 http://www.ipcc.ch/ 485
8 Keller, M. et al. (2007) A continental strategy for the National Ecological Observatory 486
Network. Front. Ecol. Envrionment 6, 282–284 487
9 Lubchenco, J. (1998) Entering the Century of the Environment : A New Social Contract for 488
Science. Science. 279, 491–497 489
10 Carter, T.R. et al. (2007) New Assessment Methods and the Characterisation of Future 490
Conditions. Climate Change 2007: Impacts, Adaptation and Vulnerability. In Working Group 491
23 Parry, O.F. Canziani, J.P. Palutikof, P. J. van der L. and C. E. H., ed), pp. 133–171, Cambridge 493
University Press, Cambridge, UK 494
11 Smith, B. et al. (2013) COMPASS: Navigating the Rules of Scientific Engagement. PLoS Biol. 495
11, e1001552 496
12 McInerny, G. (2013) Embedding visual communication into scientific practice. Trends Ecol. 497
Evol. 28, 13–14 498
13 Jetz, W. et al. (2012) Integrating biodiversity distribution knowledge: toward a global map of 499
life. Trends Ecol. Evol. 27, 151–9 500
14 Evanko, D. (2010) Foreword. Nat. Methods 7, 193–193 501
15 Society, R. (2012) Science as an open enterprise - The Royal Society Science Policy Centre 502
report 02/12, 503
16 Mastrandrea, M.D. et al. (2010) Guidance Note for Lead Authors of the IPCC Fifth 504
Assessment Report on Consistent Treatment of Uncertainties Guidance Note for Lead Authors 505
of the IPCC Fifth Assessment Report. 506
17 Redford, K.H. et al. (2012) Conservation stories, conservation science, and the role of the 507
intergovernmental platform on biodiversity and ecosystem services. Conserv. Biol. 26, 757–9 508
18 Sutherland, W.J. (2013) Review by quality not quantity for better policy. Nature 503, 167 509
19 Fischhoff, B. (2011) Applying the science of communication to the communication of science. 510
Clim. Change 108, 701–705 511
20 MacEachren, A.M. et al. (2005) Visualizing Geospatial Information Uncertainty: What We 512
Know and What We Need to Know. Cartogr. Geogr. Inf. Sci. 32, 139–160 513
21 Fox, P. and Hendler, J. (2011) Changing the equation on scientific data visualization. Science 514
331, 705–8 515
22 Laramee, R.S. and Kosara, R. (2007) 1 . Future Challenges and Unsolved Problems ( in 516
Human-Centered Visualization ). In Human-Centered Visualization Environments, Lecture 517
Notes in Computer Science Vol. 4417 (Kerren, A. et al., eds), pp. 231–256, Springer 518
23 Lieberman, H. Paternó, F. Klann, M. & Wulf, V. (2006) End-User Development: an Emerging 519
Paradigm. In End-user development (Lieberman, H, Paterno, F, & Wulf, V., ed), Springer. 520
New York. 521
24 Kosara, R. (2013) InfoVis Is So Much More: A Comment on Gelman and Unwin and an 522
Invitation to Consider the Opportunities. J. Comput. Graph. Stat. 22, 1, 29–32 523
25 Pidgeon, N. and Fischhoff, B. (2011) The role of social and decision sciences in 524
communicating uncertain climate risks. 1, 35–41 525
26 Boggs, S.W. (1949) An Atlas of Ignorance: A Needed Stimulus to Honest Thinking and Hard 526
24 27 Boggs, S.. (1947) Cartohypnosis. Sci. Mon. 64, 469–476.
528
28 Thorndike, E.L. (1920) A constant error in psychological ratings. J. Appl. Psychol. 4, 25–29 529
29 Kurosu, M. & Kashimura, K. (1995) Apparent usability vs. inherent usability:experimental 530
analysis on the determinants of the apparent usability. CHI ’95 Conf. Companion Hum. 531
Factors Comput. Syst. 292-293 532
30 Sillence, E. et al. (2004) Trust and mistrust of online health sites. Proc. 2004 Conf. Hum. 533
factors Comput. Syst. - CHI ’04 6, 663–670 534
31 Hortal, J. et al. (2007) Limitations of biodiversity databases: case study on seed-plant diversity 535
in Tenerife, Canary Islands. Conserv. Biol. 21, 853–863 536
32 Cawthon, N. & Moere, A. Vande (2007) The Effect of Aesthetic on the Usability of Data 537
Visualization. 2007 11th Int. Conf. Inf. Vis. 637-648 538
33 McCabe, D.P. & Castel, A.D. (2008) Seeing is believing: the effect of brain images on 539
judgments of scientific reasoning. Cognition 107, 343–52 540
34 Fagerlin, A. et al. (2005) Reducing the influence of anecdotal reasoning on people’s health 541
care decisions: is a picture worth a thousand statistics? Med. Decis. Making 25, 398–405 542
35 Ginsberg, A.D. (2012) Sensation: in search of aesthetic experience in chemical biology. Curr. 543
Opin. Chem. Biol. 16, 553–6 544
36 Harley, J.B. (1989) Historical geography and the cartographic illusion. J. Hist. Geogr. 15, 80– 545
91 546
37 Korzybski, A. (1933) A Non-Aristotelian System and its necessity for rigour in mathematics 547
and physics. In Science and Sanity: An Introduction to Non-Aristotelian Systems and General 548
Semantics, (Korzybski, A., ed), pp. 747–761, Lakeville, CT: International Non-Aristotelian 549
Library 550
38 Stewart, E.C.A. et al. (2009) Cyberinfrastructure Software Sustainability and Reusability : 551
Report from an NSF-funded workshop Report from an NSF-funded workshop held 27 and 28 552
March 2009, 553
39 Tohline, J.E. et al. (2007) Provenance for visualizations: reproducibility and beyond. Comput. 554
Sci. Eng. 9, 82–89 555
40 Peters, D.P.C. (2010) Accessible ecology: synthesis of the long, deep, and broad. Trends Ecol. 556
Evol. 25, 592–601 557
41 Sandve, G.K. et al. (2013) Ten Simple Rules for Reproducible Computational Research. PLoS 558
Comput. Biol. 9, e1003285 559
42 Aisch, G. Show case of map projections. http://vis4.net/labs/as3proj/ 560
43 Elith, J. et al. (2002) Mapping epistemic uncertainties and vague concepts in predictions of 561
25 44 Rocchini, D. et al. (2011) Accounting for uncertainty when mapping species distributions: The 563
need for maps of ignorance. Prog. Phys. Geogr. 35, 211–226 564
45 Rosindell, J. and Harmon, L.J. (2012) OneZoom: A Fractal Explorer for the Tree of Life. PLoS 565
Biol. 10, e1001406 566
46 Hof, C. et al. (2011) Additive threats from pathogens, climate and land-use change for global 567
amphibian diversity. Nature 480, 1–6 568
47 IPCC communications strategy. 569
http://www.ipcc.ch/meetings/session35/IAC_CommunicationStrategy.pdf 570
48 UNEPWCMC Protected Planet. http://www.protectedplanet.net/ 571
49 Simonsen, S. & Robertson, T. (2012) Routledge Handbook of Participatory Design, 572
Routledge. 573
50 Sedlmair, M. et al. (2012) Design Study Methodology : Reflections from the Trenches and the 574
Stacks. IEEE Trans. Visualization and Computer Graphics, 18(12): 2431-2440, 2012. 575
51 Lipkus, I. M., & Hollands, J.G. (1999) The visual communication of risk. JNCI Monogr. 25, 576
149–163 577
52 Garnett, S.T. and Lindenmayer, D.B. (2011) Conservation science must engender hope to 578
succeed. Trends Ecol. Evol. 26, 59–60 579
53 Rockström, J. & Liverman, D. (2013) Future Earth Initial Design, Future Earth. 580
54 Kaye, N.R. et al. (2012) Mapping the climate: guidance on appropriate techniques to map 581
climate variables and their uncertainty. Geosci. Model Dev. 5, 245–256 582
55 Sanyal, J. et al. (2009) A user study to compare four uncertainty visualization methods for 1D 583
and 2D datasets. IEEE Trans. Vis. Comput. Graph. 15, 1209–18 584
56 Reusser, D.E. et al. (2011) Presentation of uncertainties on web platforms for climate change 585
information. Procedia Environ. Sci. 7, 80–85 586
57 Johnson, C.R. and Sanderson, A.R. (2003) A Next Step : Visualizing Errors and Uncertainty. 587
IEEE Comput. Graph. Appl. 23, 6–10 588
58 Araújo, M.B. and New, M. (2007) Ensemble forecasting of species distributions. Trends Ecol. 589
Evol. 22, 42–7 590
59 KILLMATH Ladder of Abstraction. http://worrydream.com/LadderOfAbstraction/ 591
60 Review, B. Blackett Review of High Impact Low Probability Risks – Government office of 592
science. http://www.bis.gov.uk/assets/goscience/docs/b/12-519-blackett-review-high-impact-593
low-probability-risks 594
26 62 Karl, J.W. et al. (2013) Geographic searching for ecological studies: a new frontier. Trends 596
Ecol. Evol. 28, 383–384 597
63 http://pbsg.npolar.no/en/dynamic/app/ 598
64 Walker, R. et al. (2013) An extensible framework for provenance in human terrain visual 599
analytics. IEEE Trans. Vis. Comput. Graph. 19, 2139–48 600
65 Kosara, R. et al. (2002) Useful Properties of Semantic Depth of Field for Better F + C 601
Visualization. VISSYM '02 Proceedings of the symposium on Data Visualisation 2002, 205-602
210 603
66 Katz, Y. (2013) Against storytelling of scientific results. Nat. Methods 10, 1045–1045 604
67 Krzywinski, M. and Cairo, A. (2013) Reply to: “Against storytelling of scientific results.”Nat. 605
Methods 10, 1046–1046 606
68 Wong, B. (2010) Salience. Nat. Methods. 7, 773 607
69 Maguire, E. et al. (2012) Taxonomy-based Glyph Design — with a Case Study on Visualizing 608
Workflows of Biological Experiments. IEEE Trans. Vis. Comput. Graph. 18, 2603–2612 609
70 MacEachren, A.M. et al. (2012) Visual Semiotics & Uncertainty Visualization: An Empirical 610
Study. IEEE Trans. Vis. Comput. Graph. 18, 2496–2505 611
71 Tufte, E.R. (1983) Data-Ink and Graphical Redesign. In The Visual Display of Quantitative 612
Information 4pp. 91–106, Graphics Press 613
72 Spiegelhalter, D. et al. (2011) Visualizing uncertainty about the future. Science 333, 1393–400 614
73 IPBES, Plenary meeting to determine modalities and institutional arrangements for an 615
intergovernmental science-policy platform on biodiversity and ecosystem services. Second 616
session, P.C. 16–21 A. 2012. http://www.cites.org/eng/com/AC-PC/AC26-PC20/E-AC26-617
PC20-05-A.pdf 618
74 Schimel, D.S. et al. (2011) NEON 2011 SCIENCE STRATEGY - Enabling Continental-scale 619
Ecological Forecasting, 620
75 UNEP (2012) Issues for the 21st Century: Results of the UNEP Foresight Process on 621
Emerging Environmental Issues., 622
76 Turnhout, E. et al. (2012) Conservation policy: Listen to the voices of experience. Nature 488, 623
454–455 624
77 Vohland, K. et al. (2011) How to ensure a credible and efficient IPBES? Environ. Sci. Policy 625
14, 1188–1194 626
78 Michener, W.K. and Jones, M.B. (2012) Ecoinformatics: supporting ecology as a data-627
intensive science. Trends Ecol. Evol. 27, 85–93 628
79 Donoghue, S.I.O. et al. (2010) Visualizing biological data - now and in the future. Nat. Publ. 629
27 80 Meyer, M. et al. (2009) MizBee: a multiscale synteny browser. IEEE Trans. Vis. Comput. 631
Graph. 15, 897–904 632
81 Meyer, M. et al. (2010) Pathline: A Tool For Comparative Functional Genomics. Comput. 633
Graph. Forum 29, 1043–1052 634
82 Pavelin, K. et al. (2012) Bioinformatics meets user-centred design: a perspective. PLoS 635
Comput. Biol. 8, e1002554 636
83 BBC BBC Trust review of impartiality and accuracy of the BBC’s coverage of science. 637
http://www.bbc.co.uk/bbctrust/assets/files/pdf/our_work/science_impartiality/science_impartia 638
lity.pdf 639
84 Perrings, C. et al. (2011) Ecology. The biodiversity and ecosystem services science-policy 640
interface. Science 331, 1139–40 641
85 http://worrydream.com/ScientificCommunicationAsSequentialArt/ 642
86 Watts, D.J. and Strogatz, S.H. (1998) Collective dynamics of “small-world” networks. Nature 643
393, 440–2 644
87 Leslie, H.M. et al. (2013) How good science and stories can go hand-in-hand. Conserv. Biol. 645
27, 1126–9 646
88 Stirling, I. and Derocher, A.E. (2012) Effects of climate warming on polar bears: a review of 647
the evidence. Glob. Chang. Biol. 18, 2694–2706 648
28 FIGURES
652
653
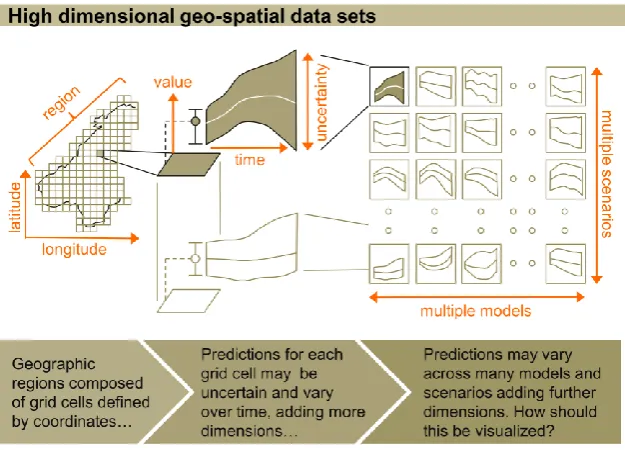
Figure 1 (w * h; 11.3cm * 7.9cm; 2 column)
654 655
Scientists and science-policy frequently deal with high dimensional modelled outputs but how
656
will they be visualised? For instance, across spatial regions (e.g. defined by grid cells and spatial co-657
ordinates) models can predict a value for a metric of interest and which has an associated uncertainty 658
measure, both of which can change over time. When multiplied across a multiplicity of models and 659
scenarios (and also alternative methods and simulations) information displays become highly 660
challenging, even before including meta data or multiple variables of interest and their associated 661
uncertainties. 662
29 664
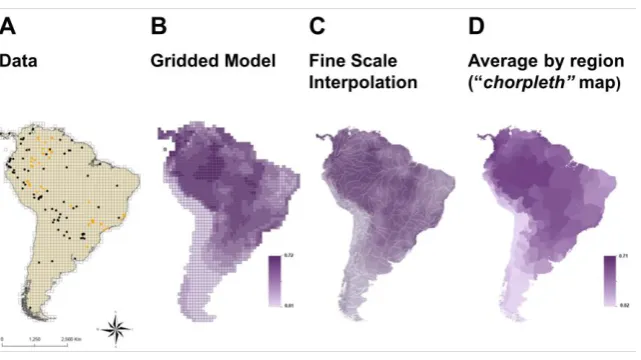
Figure 2 (w * h; 11.3cm * 5.5cm; 2 column)
665 666
Highly crafted maps can alter our perception of, and ability to query, models and data. For 667
example, sparse, spatially biased data on a species distribution (a) (yellow dots) can be used to create 668
a coarse gridded model (b), which can then projected onto a fine-scale map (c) oraveraged for geo-669
political regions (d). Each map confers a different message on the precision and uncertainty of 670
biodiversity information [black dots in (a) represent observations not used to develop this model]. 671
Appropriate visual communication techniques must engage users and inform, but also maintain links 672
with the underlying models and data. See supplementary information for details on this species 673
distribution model of the Jaguar. 674
30 Supplementary Information
677 678
Information for Jaguar model shown in figure 2 of main text. 679
680
We compare the results of a Species Distribution Model (SDM) based on a biased dataset 681
with an independent source of data, to show that despite the beauty of the maps, they can 682
provide information of poor quality. The geographic distribution of the jaguar (Panthera 683
onca) was modeled using all the records of the species available in speciesLink 684
(http://splink.cria.org.b0072/; yellow dots in Figure 2a), a database restricted to Brazil. These
685
data were used to calibrate a SDM with Maximum Entropy Modelling (MaxEnt; Phillips et 686
al., 2006), relating jaguar occurrences at 100 km width grid cells with ten climatic predictors: 687
precipitation of coldest quarter, precipitation of warmest quarter, precipitation seasonality, 688
annual precipitation, mean temperature of wettest quarter, mean temperature of driest quarter, 689
maximum temperature of warmest period, minimum temperature of coldest period, 690
temperature seasonality and annual mean temperature (all obtained from Worldclim; 691
http://www.worldclim.org/, Hijmans et al., 2005).
692
The climate suitability for jaguar populations predicted by such a model (Figure 2b; the 693
darker the purple tone, the more climatically suitable a given area is) was artificially 694
downscaled to 10 km width pixels, using topographic relief and major rivers to represent 695
major geographic features within the map (Figure 2c). We then compare the geographic 696
distribution of climatic suitability with data from GBIF (http://data.gbif.org/, black dots in 697
Figure 2a), a biodiversity information network that provides occurrence information at a 698
global extent. Note that several occurrences from GBIF are located in areas of low climatic 699
suitability according to SDM results. 700
R.J. Hijmans et al. Very high resolution interpolated climate surfaces for global land areas., 701
International Journal of Climatology 25, 1965–1978 (2005). 702
703
S.J. Phillips et al. Maximum entropy modeling of species geographic distributions., 704
Ecological Modelling 190, 231–259 (2006). 705
31 710
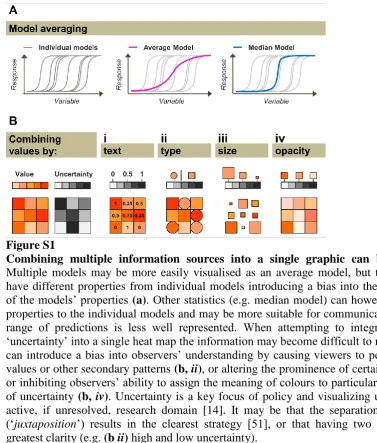
Figure S1 711
Combining multiple information sources into a single graphic can be challenging. 712
Multiple models may be more easily visualised as an average model, but that average can 713
have different properties from individual models introducing a bias into the communication 714
of the models’ properties (a). Other statistics (e.g. median model) can however have similar 715
properties to the individual models and may be more suitable for communication, even if the 716
range of predictions is less well represented. When attempting to integrate ‘value’ and 717
‘uncertainty’ into a single heat map the information may become difficult to read (b, i), or we 718
can introduce a bias into observers’ understanding by causing viewers to perceive layers of 719
values or other secondary patterns (b, ii), or altering the prominence of certain values (b, iii), 720
or inhibiting observers’ ability to assign the meaning of colours to particular a value or level 721
of uncertainty (b, iv). Uncertainty is a key focus of policy and visualizing uncertainty is an 722
active, if unresolved, research domain [14]. It may be that the separation of information 723
(‘juxtaposition’) results in the clearest strategy [51], or that having two levels gives the 724
greatest clarity (e.g. (b ii) high and low uncertainty). 725
[image:32.595.66.444.69.513.2]32 727
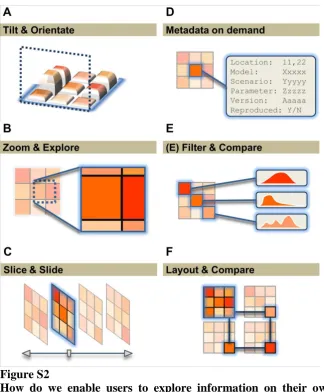
Figure S2 728
How do we enable users to explore information on their own terms? The ability to 729
interact and create narratives may be vital to engaging users (a-f). These interactions are 730
facets of modern communication applications, such as those alluded to in the IPBES 731
communication strategy [20]. However, interactive displays are not usually supported in the 732
scientific literature, or generated by scientists. 733
33 735
BOX S1: A VARIETY OF DESIGN CHALLENGES 736
737
Example audiences: 738
○ Scientist 1 - e.g. domain specialist 739
○ Scientist 2 - e.g. alternative domain 740
○ Politician 741
○ Policy researcher 742
○ Research council 743
○ Lay person 1 - e.g. numerate 744
○ Lay person 2 - e.g. language difference 745
○ Journalist 1 – e.g. scientific 746
○ Journalist 2 – e.g. non-scientific 747
748
Example media: 749
○ Printed document 750
○ Scientific publication 751
○ Website 752
○ Poster 753
○ Oral presentation 754
○ Software interface 755
○ TV 756
○ Radio & Internet radio 757
758
BOX S2: EXAMPLE MEASURES OF SUCCESS 759
760
● Audience engagement 761
● Perceptual stress avoidance 762
● Sharing and re-use 763
● Comprehension of information 764
● Developing effective mental models 765
● Reproducibility of information 766
● Comparability with other sources 767
● Citations in science and policy 768
● Views by and impacts on the public 769
● Persistence of recollection and influence 770
● Immunity to developing misleading anecdotes 771