warwick.ac.uk/lib-publications
Original citation:
Das, Abhishek, Franciosa, Pasquale, Gerbino, Salvatore and Williams, David (2016) Prediction
of geometric errors of stamped sheet metal parts using deviation field decomposition. In:
International Conference on Competitive Manufacturing (COMA), Stellenbosch, South Africa,
27-29 Jan 2016. Published in: Proceedings of International Conference on Competitive
Manufacturing (COMA) pp. 109-114.
Permanent WRAP URL:
http://wrap.warwick.ac.uk/93411
Copyright and reuse:
The Warwick Research Archive Portal (WRAP) makes this work by researchers of the
University of Warwick available open access under the following conditions. Copyright ©
and all moral rights to the version of the paper presented here belong to the individual
author(s) and/or other copyright owners. To the extent reasonable and practicable the
material made available in WRAP has been checked for eligibility before being made
available.
Copies of full items can be used for personal research or study, educational, or not-for-profit
purposes without prior permission or charge. Provided that the authors, title and full
bibliographic details are credited, a hyperlink and/or URL is given for the original metadata
page and the content is not changed in any way.
A note on versions:
The version presented in WRAP is the published version or, version of record, and may be
cited as it appears here.
International Conference on Competitive Manufacturing
Prediction of Geometric Errors of Stamped Sheet Metal Parts
Using Deviation Field Decomposition
A. Das
1, P. Franciosa
1, S. Gerbino
2, D. Williams
11
Warwick Manufacturing Group (WMG), University of Warwick, United Kingdom
2DiBT Department, University of Molise, Italy
Abstract
Stamping process is widely used to fabricate sheet-metal components. Due to the intrinsic nature of sheet-metal parts, it is usually difficult to control the quality of the final shape, surface defects or geometric errors. Additionally, to meet tight GD&T specifications, a proactive prediction technique is required to estimate global/local geometric defects caused by manufacturing steps. Current best practice relies on manual trial-and-error approaches which are far to be optimal and are costly and
time consuming. This paper proposes a model-driven methodology to forecast geometric errors for
given set of process parameters (forward process), and consequently optimise (feedback process)
the process parameters to achieve given quality standards. The methodology is based on: (i) experimental investigation with varying process parameters and subsequently, deviation field extraction by mapping high density Cloud-of-Points with nominal CAD model; (ii) deviation field decomposition; (iii) surrogate model development by mapping decomposed deviation field to process parameters. An industrial case study is used to validate the methodology.
Keywords
Sheet Metal Stamping, Geometric Errors, Deviation Field Decomposition, Surrogate Modelling
1 INTRODUCTION
Sheet metal forming process, such as stamping, is prone to various defects unless the process parameters, forming tools and material variations are optimised and kept under control. Defects can be classified into local (i.e. cracks, wrinkles, cosmetic defects) and global (i.e. dimensional and geometric errors) defects. This paper focuses on geometric errors since they are imputed to impact assemblability and subsequently poor quality of final products [1] [2]. Geometric errors are the result of material or manufacturing process variations such
as spring-back errors, fabrication parameter
variations [3].
The industrial practice for setting up the process parameters is mainly based on the manual trial-and-error adjustments [4] [5], which involve repetitive experimental tests and multiple parameter tuning. As a consequence, it leads to higher ramp-up time and production cost.
Recently, Finite Element Method (FEM) techniques have been utilised to predict sheet metal defects and to reach optimal and robust design solutions. Many simulation tools are also available to simulate the sheet metal stamping process, such as AutoForm, HyperForm, DYNAFORM, PAM-STAMP, FASTFORM. However, those tools alone does not provide the complete solution to achieve automatic process control and adjustment as demanded by modern manufacturing process (as demonstrated by recent trends in Industry and Academia: Smart Factory, Industry 4.0, Connected Factory, The Factory of the Future [6] [7]). This implies the need
to systematically integrate monitoring strategies
(both in-line and off-line sensor data) and
[image:2.595.330.554.508.590.2]model-driven process control strategy to achieve near-to-zero defect during manufacturing processes.
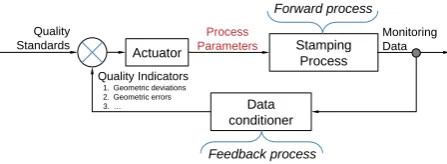
Figure 1 shows the general framework for closed-loop process control by combining data (such as dimensional and/or geometric product information
collected using surface-based scanners) and
model-driven process control approach.
Figure 1 - General framework for closed-loop
process control of sheet metal parts.
Model-driven closed-loop process control is
understood as capability to keep the process in control by inferring corrective actions through sensing the process (i.e., data collection) and
enhancing those data (data conditioning) by
prediction models. Classical process control strategies are only based on sensing techniques. Although data collection is a necessary step for process control, it is not sufficient for closed-loop control, because of the complex nature of the stamping process along with the inherent variation of product (i.e., material thickness) and process (i.e., speed, blank holding force) parameters.
Data conditioner Actuator Stamping
Process
Process Parameters
Monitoring Data
Quality Indicators
1. Geometric deviations 2. Geometric errors 3. …
Quality Standards
This paper provides contribution towards closed-loop process control by identifying the relationship between the geometric errors and product/process parameters. Thereafter, the established relationship can be utilised to isolate the faults and take corrective actions. This will allows to forecast geometrical variations for given set of process
parameters (forward process), and consequently
optimise (feedback process) the process
parameters to achieve given quality standards.
Current literature is mainly limited to process characterisation with no clear approach to achieve forward and feedback analysis. For example, in order to analyse the dimensional quality of sheet metal parts, Zhou and Cao [8] measured 28 discrete points with varying inner tonnage, outer tonnage and punch speed. The work has then been extended by Majeske and Hammett [4], where they showed the process variation related to 16 discrete output features (point features) for sheet metal stamping. Further, Zhang, et al. [9] investigated the effect of press tonnage, nitrogen pressure and shut height on waviness of the stamped part.
Further, attempts have been made to predict and control springback errors by adapting neural network training based on finite element simulation or experimental data sets. Cao, et al. [10] developed a springback control system using artificial neural networks to control springback in channel forming process. The proposed numerical simulation results are validated experimentally by Viswanathan, et al. [11]. Liu, et al. [12] predicted springback angle of U-shaped parts under varying process parameters. Few closed-loop variation control strategies have been reported in literature [13]. However, the available neural networks approaches fail for complex part geometry and correlation with overall surface quality is missing. Some work has been also oriented to control stamping process by integrating ANN and FEM as documented in [14].
Recently, multivariate statistical techniques have also been adopted to interpret data and extract significant patterns. In [15] the current state-of-art in multiple fault diagnosis based on data-driven methods (such as Principal component analysis
(PCA), correlation clustering, least squares,
designed component analysis (DCA) and factor analysis) for sheet metal assembly is presented. While PCA is adapted to reduce the large dimensionality of the original data set
(measurements), the decomposed orthogonal
principal components may not have a physical interpretation related to faults. On the contrary, DCA requires a previous knowledge of the process in order to construct the fault pattern but it offers a close prediction for fault diagnosis and it is lesser sensitive to measurement noise than PCA.
Unfortunately, there is a lack of proper methodology which can correlate the product and process parameters with the entire surface based geometric
errors and it remains unexplored. The following challenges have been identified: (i) unavailability of a parametric approach correlating the measured geometric errors with product and process parameters; (ii) characterisation of the effect of individual process parameters on geometric errors; and, (iii) analytical representation (surrogate model) of the relationship between geometric errors and process parameters.
This paper addresses those challenges by decomposing the captured data into orthogonal error modes and uses the modes as a parametric approach to represent the geometric errors.
The reminder of the paper is organised as follows: Section 2 proposes the methodology, Section 3 demonstrates the methodology with an industrial case study, and Section 4 draws final remarks.
2 METHODOLOGY OVERVIEW
The proposed research methodology is summarised into three major steps as follows:
• STEP 1 involves the experimental
characterisation of the stamping process by varying process parameters. Thereafter, the geometric errors of stamped parts are captured and deviation field is obtained.
• STEP 2 decomposes the deviation field into
orthogonal geometric error modes.
• STEP 3 develops analytical surrogate model by linking process parameters to decomposed deviation field. The proposed surrogate model can be used to narrow down root causes of failure, usually unforeseen if only based on heuristic approaches.
2.1 STEP 1: experimental characterisation
Design of Experiments (DoE) is adopted to characterise the geometric errors under varying process parameter conditions. To capture geometric errors, 3D optical scanner is used which captures millions of data points (Cloud of Points-CoP) representing the entire surface information. To
obtain the deviation field, the CoP is mapped onto
the nominal CAD model. The nominal CAD model is represented through polygonal mesh geometry. Deviation field is calculated for each node of the mesh model, by using the morphing mesh technique, as originally proposed in [16].
The calculated deviation field is non-parametric by nature which cannot be directly linked to process parameters. Therefore, to develop a parametric model of the deviation field, extraction of geometric features from the deviation field is necessary.
Assuming m number of mesh node, and p number
of DoE experiments, the deviation field (D) can be
expressed as in Equation (1), where, Dz,j denotes
{
(1) (2) ( )}
( ){ }
,
;
, , ; ,
p j
z j
D D D D D D
z 1,2 m j 1,2, p
= =
∀ = ∀ =
(1)
2.2 STEP 2: deviation field decomposition Past research shows that few attempts have been made to develop parametric model for geometric
errors. They can be categorised as Explicit
Parametric Models (EPM) and Implicit Parametric
Models (IPM).
The Bezier’s surface, non-uniform rational basis
spline (NURBS) patches, polynomial surface fitting are few EPMs where the geometric errors are directly controlled by key points [17] [18] [19]. These models fail to represent accurate reconstruction of geometric errors as few control points are insufficient to model complex 3D geometry.
[image:4.595.331.562.226.642.2]On the contrary, IPMs attempt to decompose the deviation fields into functional parameters. IPM uses various function bases (e.g., signal characterisation techniques) to characterise and decompose the geometric errors into parametric error modes [20] [21] [22]. Till date the developed IPM’s methods are mainly limited to geometric error characterisation [23] [24] and to assembly processes [25] [26]. However, there is lack of approaches to link error modes with stamping process parameters.
Figure 2 - Pictorial representation of the deviation field decomposition.
This paper implements Geometric Modal Analysis (GMA) [22] to decompose geometric errors into orthogonal error modes. Decomposed modes can be parameterised by means of its values to represent geometric variation associated with the parts produced through varying process parameters. GMA uses 3D Discrete-Cosine-Transform (3D-DCT) as main kernel to decompose the deviation field into significant error modes. Figure 2 shows the main steps to decompose the deviation fields into significant error modes. Due to orthogonality of the error modes, they can be varied independently to fit different set of geometric errors by changing the amplitude of the modes. A set of decomposed
modes for p number of experiments is defined as in
Equation (2), where n is the number of modes. The
transformed modes is expressed as a function of the
given deviation field, as in Equation (3), where F
denotes the decomposition function.
{
(1) (2) ( )}
( ){ }
,
;
, , ; ,
p j
t j
M M M M M M
t 1,2 n j 1,2, p
= =
∀ = ∀ =
(2)
(j) t, j
M = F(D ) (3)
2.3 STEP 3: analytical surrogate model
The parametric nature of decomposed error modes shows clear advantage to link with the stamping
process parameters, SP (see Equation (4)), where
NSP is the total number of process parameters.
To identify the relationship between process parameters and error modes, analytical surrogate model is developed for each error modes.
{
(1) (2) (p)}
(j){ }
s, j SP
SP = SP SP SP ; SP = SP
s = 1,2, ,N ; j = 1,2, , p
∀ ∀
[image:4.595.71.283.396.489.2] (4)
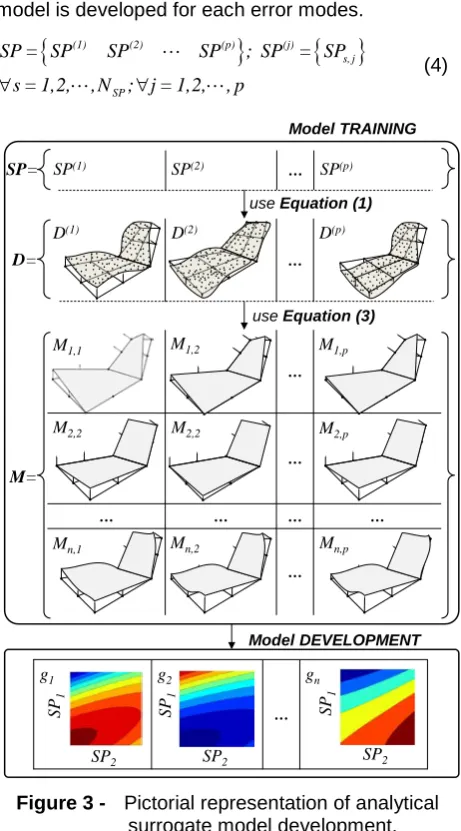
Figure 3 - Pictorial representation of analytical surrogate model development.
The tth mode can be expressed as function (gt) of a
set of stamping parameters (SP(j)). The analytical
function (see Equation (5)), gt, is computed in two
consecutive phases (see Figure 3): (i) model
training; and, (ii) model development. Model
TRAINING uses experimental data from the
experimental characterisation (see STEP 1 of the
methodology). Model DEVELOPMENT identifies the
analytical relationship between process parameters and error modes, as stated in Equation (5). Adaptive
(a) - measured data points (b) - deviation field
D(j)
(c) - decomposed modes
…
M1,j
M2,j
Mn,j
… …
…
…
… … … …
…
M1,1 M1,2 M1,p
M2,2 M2,2 M2,p
Mn,1 Mn,2 Mn,p
D(1) D(2) D(p)
…
SP(1) SP(2) SP(p)
use Equation (1)
use Equation (3)
SP2
SP
1
SP2
SP
1
SP2
SP
1
g1
Model TRAINING
Model DEVELOPMENT
g2 gn
SP=
D=
polynomial fitting, spline or Kriging methods can be utilized for this purpose [27].
( )
( ), 1, 2,
j (j)
t
M =g SP ∀ =t n (5)
(j) ( ( )j )
D =invF M (6)
By combining Equation (1) (3) and (5), a parametric relationship can be established between any deviation field and stamping parameters as noted in
Equation (6), where, invF denotes the inverse
decomposition function.
3 INDUSTRIAL CASE STUDY
Applicability and effectiveness of the proposed methodology has been demonstrated with an industrial case study. The selected top-hat geometry with nominal polygonal mesh geometry is shown in Figure 4(a). The steps of the methodology are explained as follows:
3.1 STEP 1: experimental characterisation A set of top hat parts has been stamped varying stamping parameters (see Table 1): (i) material
thickness (SP1); (ii) blank holding force (SP2); (iii)
stamping speed (SP3).
[image:5.595.330.490.71.216.2](a) (b)
Figure 4 - (a) Top-hat nominal mesh; (b) Deviation
field (mm) computation for run SP(1).
Experimental Runs (p)
SP(1) SP(2)SP(3)SP(4)SP(5)SP(6)SP(7)SP(8)
Thickness
[mm],(SP1) 0.6 0.6 0.6 0.6 1.2 1.2 1.2 1.2
Holding Force [kN],(SP2)
150 150 375 375 150 150 375 375
Speed [mm/s],
(SP3)
10 50 10 50 10 50 10 50
Table 1 - Experimental runs with varying process parameters.
Each experimental run has been repeated for 5 times (the average deviation field has been then utilised for further calculations). CoP has been captured using GOM optical scanner (see Figure 5). The deviation field for each experimental treatment has been computed at mesh nodes. For example, Figure 4(b) shows the computed deviation field for
experimental run SP(1).
Figure 5 - Experimental setup used to measure
CoP of stamped parts.
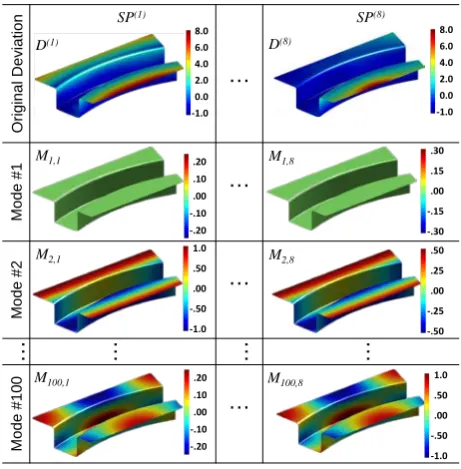
3.2 STEP 2: deviation field decomposition The obtained deviation field for each experimental run is decomposed using the GMA. Figure 6 shows a sample set of transformed modes, used as parameters to map with process parameters.
Figure 6 - Deviation field decomposition for each experimental run into error modes.
3.3 STEP 3: analytical surrogate model
For each error mode analytical surrogate model has been developed. For this purpose polynomial regression with automatic degree calculation and robust fitting based on automatic cross validation has been implemented. Figure 7 illustrates the parametric surrogate models (contour plots) for modes in relation with varying blank holding force
(SP2) and stamping speed (SP3).
In order to prove the accuracy of the proposed methodology the original deviation field has been compared against reconstructed surface by using equation (6). Figure 8 shows the results of original deviations, reconstructed deviations and error plot (between original and reconstructed deviations).
8.0 6.0 4.0 2.0 0.0 -1.0
O
ri
gi
nal
D
ev
iat
ion
…
M
ode
#1
…
M
ode
#2
…
…
…
…
…
M
ode
#100
…
8.0 6.0 4.0 2.0 0.0 -1.0
8.0 6.0 4.0 2.0 0.0 -1.0
.20 .10 .00 -.10 -.20
.30 .15 .00 -.15 -.30 1.0
.50 .00 -.50 -1.0
.50 .25 .00 -.25 -.50
.20 .10 .00 -.10 -.20
1.0 .50 .00 -.50 -1.0
M1,1 D(1)
SP(1) SP(8)
M2,1
D(8)
M100,1
M1,8
M2,8
[image:5.595.297.528.321.556.2] [image:5.595.34.269.376.661.2]Figure 7 - Surrogate model linking error modes
and process parameters (at SP1=0.6 mm).
Figure 8 - Original deviation field vs. reconstructed field (deviations in mm).
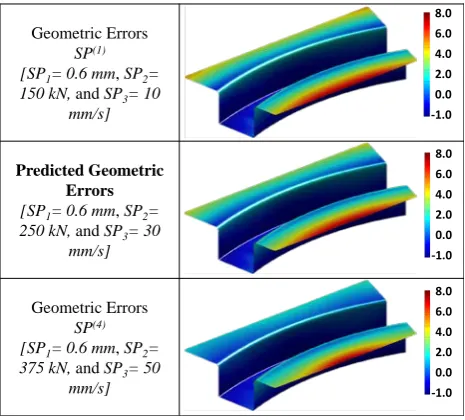
The proposed methodology is a step forward for predicting geometric errors based on the given set of process parameters (not used during the training step). For example, new parameter set (e.g.,
thickness, SP1= 0.6 mm; blank holding force, SP2=
250 kN; and, stamping speed, SP3= 30 mm/s) has
been selected in between SP(1) and SP(4) to predict
the overall geometric deviations [in mm] and is shown in Figure 9.
Figure 9 - Prediction of geometric errors for new
parameters in between SP(1) and SP(4).
4 CONCLUSION AND FINAL REMARKS
The proposed methodology allows to predict geometric errors by correlating stamping process parameters and monitoring data (such as cloud of points). Geometric errors are defined as deviation field using CoP data which are non-parametric in nature. Therefore, deviation field decomposition has been used to convert CoP data into functional parametric error modes. Subsequently, surrogate model technique has been implemented to link geometric errors and process parameters.
The proposed methodology significantly explores and contributes to the following areas:
• the developed model-driven technique
represents a step towards automatic closed-loop process control for stamping process;
• costly and time-consuming trial-and-error
approaches can be reduced by automatic selection and tuning of process parameters;
• the model-driven approach can forecast
geometrical variations for given set of process parameters (forward process), and consequently can optimise (feedback process) the process parameters to achieve given quality standards.
Future investigations will be focused on
experimental validation of the proposed
methodology and root cause identification of global/local geometric errors occurring during production.
5 ACKNOWLEDGMENTS
This research has been partially supported by the IDEAS joint Lab in Naples (IT). We acknowledge Fraunhofer IWU (Dresden, Germany) for the technical support to conduct stamping trials.
6 REFERENCES
[1] Das, A., Franciosa, P., Prakash, P.K.S., Ceglarek, D., 2014, Transfer Function of Assembly Process with Compliant Non-Ideal
Parts, Procedia CIRP, 21:177-182.
[2] Franciosa, P., Das, A., Ceglarek, D., Bolognese, L., Marine, C., Mistry, A., 2014, Design Synthesis Methodology for Dimensional Management of Assembly Process with Compliant non-Ideal Parts, Proceedings of Joint Conference on Mechanical, Design Engineering & Advanced Manufacturing, Toulouse, France. [3] de Souza, T., Rolfe, B., 2008, Multivariate
modelling of variability in sheet metal forming, Journal of Materials Processing Technology, 203/1-3:1-12.
[4] Majeske, K., Hammett, P., 2003, Identifying Sources of Variation in Sheet Metal Stamping, International Journal of Flexible Manufacturing
Systems, 15/1:5-18.
[5] Samuel, G.L., Shunmugam, M.S., 2003,
Evaluation of Circularity and Sphericity from Coordinate Measurement Data, Journal of
Mode #1 … Mode #100
…
g1 600 g100
550 500 450 400 350 SP2 SP 3 -40 -45 -50 -55 -60 SP2 SP 3 O ri gi nal Dev iati on F iel d Rec ons tr uc ted Dev iati on F iel d E rro r P lot 8.0 6.0 4.0 2.0 0.0 -1.0 8.0 6.0 4.0 2.0 0.0 -1.0 .20 .16 .12 .08 .04 .00 8.0 6.0 4.0 2.0 0.0 -1.0 8.0 6.0 4.0 2.0 0.0 -1.0 .20 .16 .12 .08 .04 .00
SP(1) SP(8)
Geometric Errors
SP(1)
[SP1= 0.6 mm, SP2= 150 kN,and SP3= 10
mm/s]
Predicted Geometric Errors
[SP1= 0.6 mm, SP2= 250 kN,and SP3= 30
mm/s]
Geometric Errors
SP(4)
[SP1= 0.6 mm, SP2= 375 kN,and SP3= 50
[image:6.595.68.301.520.730.2]Materials Processing Technology, 139/1-3:90-95.
[6] Foresight, 2013, The Factory of the Future, Government Office for Science, London, UK. [7] Drath, R., Horch, A., 2014, Industrie 4.0: Hit or
Hype? [Industry Forum], Industrial Electronics
Magazine, IEEE,8/2:56-58.
[8] Zhou, Z., Cao, X.-R., 1994, Optimal Process
Control in Stamping Operation, Quality
Engineering, 6/4:621-631.
[9] Zhang, Z.T., Pitt, G., King, A., Bohonek, I.,
1998, Stamping Part Surface Quality
Improvement through Process Optimization, SAE Technical Paper.
[10] Cao, J., Kinsey, B., Solla, S.A., 1999, Consistent and Minimal Springback Using a Stepped Binder Force Trajectory and Neural
Network Control, Journal of Engineering
Materials and Technology, 122/1:113-118.
[11] Viswanathan, V., Kinsey, B., Cao, J., 2003, Experimental Implementation of Neural Network Springback Control for Sheet Metal Forming, Journal of Engineering Materials and Technology, 125/2:141-147.
[12] Liu, W., Liu, Q., Ruan, F., Liang, Z., Qiu, H., 2007, Springback Prediction for Sheet Metal Forming based on GA-ANN Technology,
Journal of Materials Processing Technology,
187–188:227-231.
[13] Elkins, K.L., Sturges, R.H., 1999, Springback Analysis and Control in Small Radius Air Bending, Journal of Manufacturing Science and Engineering, 121/4:679-688.
[14] Kashid, S., Kumar, S., 2012, Applications of Artificial Neural Network to Sheet Metal Work - A Review, American Journal of Intelligent Systems, 2/7:168–176.
[15] Camelio, J.A., Heichelbech, B., 2006,
Comparison of Diagnosis Methodologies on Sheet Metal Assembly, Trans NAMRI/SME, 34:135-142.
[16] Franciosa, P., Gerbino, S., Patalano, S., 2011, Simulation of Variational Compliant Assemblies with Shape Errors based on Morphing Mesh Approach, International Journal of Advanced Manufacturing Technology, 53/1:47-61.
[17] Gupta, S., Turner, J.U., 1993, Variational Solid Modeling for Tolerance Analysis, Computer
Graphics and Applications, IEEE,13/3:64-74.
[18] Cai, W.W., Hsieh, C.-C., Long, Y., Marin, S.P., Oh, K.P., 2005, Digital Panel Assembly Methodologies and Applications for Compliant Sheet Components, Journal of Manufacturing
Science and Engineering,128/1:270-279.
[19] Merkley, K., 1998, Tolerance Analysis of Complaint Assemblies," Ph.D. Dissertation, Brigham Young University, Utah.
[20] Samper, S., Formosa, F., 2006, Form Defects Tolerancing by Natural Modes Analysis, Journal of Computing and Information Science in
Engineering,7/1:44-51.
[21] Huang, W., Liu, J., Chalivendra, V., Ceglarek, D., Kong, Z., Zhou, Y., 2014, Statistical Modal Analysis for Variation Characterization and Application in Manufacturing Quality Control, IIE Transactions, 46/5:497-511.
[22] Das, A., Franciosa, P., Ceglarek, D., 2014, Geometric Modal Analysis (GMA) for shape error modeling and analysis in manufacturing, Technical Report, University of Warwick.
[23] Samper, S., Adragna, P.-A., Favreliere, H., Pillet, M., 2009, Modeling of 2D and 3D Assemblies Taking into Account Form Errors of Plane Surfaces, Journal of Computing and Information Science in Engineering, 9/4:041005. [24] Das, A., Franciosa, P., Williams, D., Ceglarek, D., 2015, Physics-Driven Shape Variation Modelling at Early Design Stage, 48th CIRP CMS, Naples, Italy.
[25] Franciosa, P., Gerbino, S., Ceglarek, D., Fixture Capability Optimization for Early-stage Design of Assembly System with Compliant Parts Using Nested Polynomial Chaos Expansion, Proceedings of CIRP-CMS 2015, Naples 2015. [26] Das, A., Franciosa, P., Ceglarek, D., 2015,
Fixture Design Optimisation Considering Production Batch of Compliant Non-Ideal Sheet Metal Parts, Procedia Manufacturing,1:157-168. [27] Jin, R., Chen, W., Simpson, T.W., 2001,
Comparative Studies of Metamodelling
Techniques under Multiple Modelling Criteria, Structural and Multidisciplinary Optimization, 23/1:1-13.
7 BIOGRAPHY
Abhishek Das is a research assistance at WMG, University of Warwick, UK. He obtained his B.Tech and M.Tech in
Production Engg. from Jadavpur
University & IIT Roorkee, India
respectively.
Pasquale Franciosa received the PhD degree in Mechanical Engineering from University of Naples Federico II, Italy. He is a Senior Research Fellow at WMG, University of Warwick, UK.
Salvatore Gerbino obtained his PhD from University of Naples, Italy. Since 2005, he is appointed as Associate Professor, University of Molise (IT), working on Design and Methods of Industrial Engg.