Sharif University of Technology
Scientia IranicaTransactions E: Industrial Engineering www.scientiairanica.com
A capacitated bike sharing location-allocation problem
under demand uncertainty using sample average
approximation: A greedy genetic-particle swarm
optimization algorithm
E. Ali-Askari
a, M. Bashiri
a;and R. Tavakkoli-Moghaddam
b a. Department of Industrial Engineering, Faculty of Engineering, Shahed University, Tehran, Iran. b. School of Industrial Engineering, College of Engineering, University of Tehran, Tehran, Iran. Received 14 October 2015; received in revised form 8 June 2016; accepted 24 September 2016KEYWORDS Bike sharing systems; Stochastic
programming; Hybrid evolutionary algorithm;
Sample average approximation.
Abstract.This paper considers a stochastic location-allocation problem for a capacitated bike sharing system (S-L&A-CBSS), in which bike demand is uncertain. To tackle this uncertainty, a Sample Average Approximation (SAA) method is used. Because this problem is an NP-hard problem, a hybrid greedy/evolutionary algorithm based on Genetic Algorithm (GA) and Particle Swarm Optimization (PSO), namely greedy GA-PSO, is embedded in the SAA method in order to solve the given large-sized problems. The performance of the proposed hybrid algorithm is tested by a number of numerical examples and used for empirical test based on Tehran business zone. Furthermore, the associated results show its eciency in comparison to an exact solution method in solving small-sized problems. Finally, the conclusion is provided.
© 2017 Sharif University of Technology. All rights reserved.
1. Introduction
In recent years, bike sharing systems have received great focus as a sustainable, economically cost-eective, and healthy transportation alternative by researchers and urban transport planners to reduce air pollution, intensive trac jams, and carbon emissions. Vogel et al. [1] and Bordagaray et al. [2] analyzed data from bike sharing station to explore activity patterns within these systems. Ando et al. [3] analyzed the possibility of extension and the necessary conditions for bicycle rental system in a local city of Japan. A
*. Corresponding author. Tel.: +98 21 51212092 E-mail addresses: [email protected] (E. Ali-Askari); [email protected] (M. Bashiri); [email protected] (R. Tavakkoli-Moghaddam). doi: 10.24200/sci.2017.4391
journey advisor application was presented by Yoon et al. [4] for serving travelers to navigate the city using the existing bike sharing system. Lathia et al. [5] used data analysis and mining techniques to consider the eects of the user-access policy modication on London's bicycle hire scheme. Bordagaray et al. [6] proposed a methodology to model the quality perceived by public-bicycle-system users in order to identify the important variables and their signicance for the overall evaluation. Through executing a pilot project at the University of Tennessee, Knoxville campus, Ji et al. [7] presented the operational notions and system necessities of a completely automated electric bike sharing system. Jappinen et al. [8] modeled a shared bike system and measured its eect on public transport travel times. They concluded that bicycle sharing systems can complete the traditional public transport system, and they could increase the competitiveness and attractiveness of urban sustainable transportation.
In 2014, eect of bike sharing system on car use was considered by Fishman et al. [9].
Lin and Yang [10] expressed that station locations and capacities have a special and strategic role in the success of bike sharing system; therefore, some scholarly studies have been dedicated to this mat-ter. Lin and Yang [10] developed a model to nd station locations and traveler paths to travel from origins to destinations by riding bikes rented from bike sharing system. Then, Lin et al. [11] extended the previous research by adding a decision variable related to the bicycle stock level at station. In the last two mentioned papers, authors used expected demand value to tackle demand uncertainty. Romero et al. [12] presented a methodology for optimizing station locations with minimum social cost. In their approach, interactions between private and public transportation systems are considered. Garcia-Palomares et al. [13] determined demand and its characteristics, station locations, and their capacity through a GIS-based method and location-allocation models.
On the other hand, considering that demand uncertainty is an important subject to consider in transportation modeling [14], as shown in Table 1, demand is considered as an uncertain parameter in some urban transportation studies. Urban public transportation, like other transportation systems, is
facing uncertain demands; therefore, it is necessary to consider demand uncertainty in bike sharing systems as a part of the urban transportation.
To the best of the authors' knowledge, there is no study to consider a bike sharing system with stochastic demands using a hybrid evolutionary algo-rithm in stochastic optimization as a soft-computing approach. Hence, in these systems, strategic decisions, such as location and capacity, are made usually under stochastic environment; therefore, addressing this issue can be an interesting subject deserving to be studied more. One of the well{known methods which deals with stochastic nature of optimization problems is the Sample Average Approximation (SAA).
Ahmed et al. [21] developed a solution strategy based on sample average approximation for stochastic programs with integer recourse. The sample aver-age approximation method was used by Kleywegt et al. [22] to optimize stochastic discrete optimiza-tion problems. Wei and Real [23] used the SAA method with bounding techniques and used it for solving stochastic mixed integer nonlinear program-ming problems. By combining the sample average approximation with dual decomposition, Schutz et al. [24] proposed a method for solving stochastic supply chain design problem. Contreras et al. [25] integrated the sample average approximation method
Table 1. Summary of some studies for transportation problem with uncertain demands.
Authors Objective Solution method Problem
Chen and Yang [15] Minimizing the total
travel time Genetic algorithm
Transportation network design problem
Ukkusuri et al. [16] Minimizing the total
travel time Genetic algorithm
Trac network design problem
Hua et al. [17] Minimizing the total system cost of the worst case
Sensitivity analysis combining with the methods of sequence average algorithm
Urban trac network design problem
Saez et al. [18] Minimizing waiting
and in-vehicle ride times Genetic algorithm Bus scheduling problem
Huang et al. [19] Minimizing the total cost
of the transit system Genetic algorithm Bus frequencies problem
Liu et al. [14]
Minimizing the performance of the overall trac network
Genetic algorithm Transportation network design problem
Cao et al. [20] Minimizing total travel time and cost
Genetic algorithm combined with the Frank-Wolfe algorithm
Transportation network design problem
with a Benders decomposition algorithm by Monte{ Carlo simulation{based algorithm and used it to solve stochastic uncapacitated hub location problems. Through integrating PSO algorithm within the sam-ple average approximation method, Aydin and Mu-rat [26] geneMu-rated a new hybrid algorithm for solving the capacitated reliable facility location problems e-ciently. The mentioned studies conrm that most of network designs apply new soft{computing methods to solve applicable problems more eciently under
more realistic conditions such as stochastic environ-ment.
Since using SAA requires solving the problem repeatedly and based on NP-hardness problem, the exact methods are not suitable for this purpose. Meta-heuristic algorithms are used in transportation prob-lems frequently, and some of them are presented in Table 2; therefore, these algorithms can be used here as well.
The outline of this paper is as follows: In
Sec-Table 2. Summary of some studies for transportation problem using evolutionary algorithms.
Authors Objective Solution method Problem
Mohtashami et al. [27]
Minimizing the make-span, transportation cost, and the number of
truck trips
NSGA-II MOPSO
Cross-docking scheduling problem
Martinez-Salazar et al. [28]
Minimizing the total operation cost
Balancing of workloads
SSPMO* NSGA-II
Transportation location routing
problem
Cao et al. [29]
Minimizing transportation costs and
unsatised demands
Dierential evolution
algorithm Vehicle routing problem Lot and
Tavakkoli-Moghaddam [30]
Total variable and xed cost
Genetic algorithm using priority-based encoding
Fixed charge transportation problem Bolat et al. [31] Minimizing the
average journey time Particle swarm optimization Car-call allocation problem
Yaghini et al. [32] Minimizing the total cost
Hybrid algorithm of simplex method and
simulated annealing metaheuristic
Network design problem
Lin et al. [33]
Minimizing operating cost
Maximizing customer satisfaction
Simulated annealing algorithm Vehicle routing problem
Yu et al. [34]
Maximizing service quality Minimizing operational
costs
Parallel genetic algorithm Bus route headway problem
Ghoseiri and
Nadjari [35] Minimizing the costs
Multi-objective ant colony optimization
Multi-objective shortest path problem
Musa et al. [36] Minimizing the total
transportation cost Ant colony optimization
Transportation problem of
cross-docking network
tion 2, two mathematical models for a bike sharing sys-tem with the aforementioned properties are developed. In Section 3, a greedy hybrid evolutionary algorithm is presented in a sample average approximation procedure structure. Usefulness of soft{computing approach for the mentioned bike sharing system is discussed as well. In Section 4, some illustrative examples are considered, followed by a conclusion in the last section.
2. Model formulation 2.1. Problem description
To dene the problem, consider the following scenario: Assume that a group of travelers is going to travel from a set of origins (o) to a set of destinations (g) using a bike sharing system consisting of a set of bike stations (S) with limited capacity. Passengers walk from their origins to the nearest bike stations and receive a bicycle, and then ride it to another station close to their destinations; after delivering the bike, they walk to the nal destination. Each station has a specied covering radius, and if the stations serve passengers out of their covering radius, a penalty cost is imposed on the bike sharing system. Some demands may not be satised since the bike sharing system is capacitated, while bike shortage in stations is allowable with paying shortage penalty cost.
The success of bike sharing systems depends on some decisions about station locations, capacities, and traveling paths which should be made by the system planner. There are candidate locations where some of them should be selected for establishing bike stations. Also, their capacities and traveling paths should be dened. These decisions are made so that the total cost of the bike sharing system, consisting of traveling, station and lane construction, shortage and holding costs, should be minimized.
In order to ensure that a suitable model for the mentioned purpose is provided, it is required to make real{life circumstances available. Due to the uncer-tainty of travelers' demands, the location{allocation of the bike sharing system should be considered under uncertain environment. In most of studies, expected value of uncertain demand is considered during the modeling of the bike sharing system [10,11,37], but in this study, we try to consider uncertainty nature of demands.
2.2. Mathematical model for the stochastic BSS location{allocation problem
Unlike classical models, such as [10,11], in the pre-sented mathematical model, the bike sharing system is designed with considering bike station capacities, inventory decisions, and allowable shortage. More-over, demands are taken as stochastic and a hybrid metaheuristic algorithm embedded with the stochastic
nature is developed for optimizing the model. Indices, parameters, decision variables, and the model are presented as follows:
Indices
o 2 O Origins g 2 G Destinations
s; n 2 S Potential pick-up/drop-o stations i 2 I Scenario
Input parameters
Rogi ith scenario of yearly mean of travel
demand from origin o to destination d N Number of days per year (used to
compute daily demand) h Annual bike holding cost
r Bikes replenishment period at bike stations (in days)
m Bike shortage cost.
dos Distance from origin o to station n
dsn Distance from station s to station n
dng Distance from station n to destination
g
fs Fixed cost of locating a station at s
Esn Construction cost of a bike lane from
station s to n; it is equal to 0 if there already exists a bike lane between stations s and n
Cos 1 if a bike station located at candidate
site s cannot cover demand at origin o, 0 otherwise
C0
ng 1 if a station located at candidate site
n cannot cover demand at destination g, 0 otherwise
u1 Unit traveling cost on links from
origins to bike stations per person u2 Unit traveling cost by bike on links
from pick-up station to drop{o station per person
u3 Unit traveling cost on links from bike
stations to destinations per person k Unit penalty cost for uncovered
demands at origins and destinations a Cost for adding a bike dock to a station Us Upper bound of capacity of station s
Pi Probability that demand under
scenario i is realized; Decision variables
Bosngi 1 if the demand from origin o to
destination g under scenario i travels by bike through stations s and n, respectively, 0 otherwise
Number of bikes at station s under scenario
Lsni 1 if a bike lane is required to be
connected between bike stations s and n under scenario i, 0 otherwise
Based on the above{mentioned notations, the mathematical model is formulated as follows:
Min Z =X
s2S
(fsXs) + Pi
( X
s2S
aXsvsi
+X
s2S
X
n2S
EsnLsni+
X
s2S
h 2vsi
+ u1
X o2O X s2S dos X n2S X g2G
BosngiRogi
+ u2
X s2S X n2S dsn X o2O X g2G
BosngiRogi
+ u3
X n2S X g2G dng X o2O X s2S
BosngiRogi
+ k 0 @X o2O X s2S Cos X n2S X g2G
BosngiRogi
+ X g2G X n2S C0 ng X s2S X o2O
BosngiRogi
1 A
+ NX
s2S mAsi ) ; (1) subject to: X s2S X n2S6=s
Bosngi= 1; 8o 2 O; 8g 2 G; 8i 2 I; (2)
2Lsni Xs+ Xn; 8s2S; 8n2S 6= s; 8i2I; (3)
Lssi= 0; 8s 2 S; (4)
Bosngi Lsni
8o 2 O; 8s 2 S; 8n 2 S 6= s; 8g 2 G; 8i 2 I; (5) vsi UsXs; 8s 2 S; 8i 2 I; (6)
Asi Nr
X o2O X g2G X n2S
BosngiRogi vsi;
8s 2 S; 8i 2 I; (7) Bosngi = f0; 1g ;
8o 2 O; 8s 2 S; 8n 2 S 6= s; 8g 2 G; 8i 2 I; (8) Xs= f0; 1g ; 8s 2 S; (9)
Lsni= f0; 1g ; 8s 2 S; 8n 2 S; 8i 2 I; (10)
vsi 0; 8s 2 S; 8i 2 I; (11)
Asi 0; 8s 2 S; 8i 2 I: (12)
In objective function (Eq. (1)), the total cost is calculated. The rst three terms are related to strategic decisions costs. The rst one includes construction cost of active stations and their assigned bike docks; the second one calculates lane construction costs; in the third one, bike holding costs are calculated. Other remaining terms of objective function are related to the operational decisions. Terms 4-6 contain traveling costs between origins to stations, pair of stations, and stations to destinations, respectively. The next term includes the total penalty cost for demands assigned to stations which are not inside their covering radius. The total penalty cost of missed demands is calculated in the last term.
Constraint (2) guarantees that a pair of origin and destination should be connected through only one path. Constraints (3) and (4) assure that a lane can be constructed only between dierent established stations. Constraint (5) guarantees that only an established lane can be assigned to a path. Constraint (6) limits allo-cated capacity of each active station to its upper bound. Constraints (7) and (12) determine the shortage in the case of higher allocated demands than each station capacity. Constraints (8)-(12) dene variable types.
By increasing the problem dimensions, the num-ber of variables and constraints will increase nonlin-early. For a model with n1 origins, n2 destinations,
and m candidate bike station locations, the model will have 2m + m2(n1 n2+ 1) variables and 2n1 n2
m(m 1) + m2 constraints. As a result, a model for
the usual problem may not be solved by commercial optimization software in a reasonable computational time; therefore, a hybrid meta-heuristic algorithm is proposed in this paper to solve the problem. Moreover, in some cases, there are some stochastic parameters without a known distribution function; therefore, a sampling plan equipped by a hybrid algorithm is presented in the next section.
3. The proposed SAA method equipped by a hybrid greedy genetic-PSO algorithm
In real cases, there are usually unlimited scenarios for bike demands in each station, and they have stochastic nature while they do not have a known distribution function. Because there are unlimited scenarios, it is not possible to calculate expected value of demands, and so a sampling plan should be employed to consider some possible scenarios. By considering the previous studies, the SAA method approximates the best num-ber of needed scenarios and it is selected for dealing with the location-allocation modeling of stochastic bike sharing. Due to Np-hardness of the model and a large number of calculations in the SAA method, we need to use an evolutionary algorithm for this purpose. In the following, we describe the SAA method, and then the hybrid evolutionary algorithm, used inside the SAA, is presented briey.
SAA is a stochastic method based on a sam-pling used broadly for solving stochastic optimiza-tion problems with an unmanageably large number of samples [21-26]. In this method, the objective function problem is divided into two stages. In the rst stage, there are strategic variables; in the second stage, there are stochastic variables. N samples are selected randomly; the second stage is repeated for N samples. Because N scenarios are not large, there is no need for much computation. The model is solved M times for dierent N samples in each iteration to nd the best value of the needed scenarios. The average of objective function values in M iterations will obtain the lower bound of the problem. Then, one of the strategic variables' values in the mentioned iterations is selected; for dierent N samples in each iteration to nd the best value of the needed scenarios. The average of objective function values in M iterations will obtain the lower bound of the problem. Then, one of the strategic variables' values in the mentioned iterations is selected; to understand how favorable this answer is, the model is solved just once for N0(N N0) samples again in the second stage, while
the strategic variables are xed based on the selected solution from the previous stage, and the obtained value from this phase can be an upper bound for the problem [21]. Thus, we can say that in this method, the calculations are done only with N scenarios, but the results are reliable because they are repeated for M iterations. As mentioned before, each optimization of the SAA method should be done by a hybrid metaheuristic algorithm. However, the proposed SAA sampling plan equipped by the hybrid greedy GA-PSO algorithm is mentioned in the following pseudo-code:
1. Set initial sample sizes N and N0 and set the
number of iterations M;
2. For m = 1; : : : 0; M, do steps (a) through (d):
(a) Generate a sample of size N;
(b) Solve the SAA problem by the greedy GA PSO and save the optimal objective ^Vm
N and the
solution vector of bike station locations ^Lm N;
(c) Generate a sample of size N0;
(d) Fix the bike station location variable based on ^Lm
N and solve the SAA problem by the greedy
GA PSO for N0 samples and save the optimal
objective ^Vm N.
3. Estimate optimality gap as follows:
gm= ^VNm0
0 B B B @ M P m 1 ^ Vm N M 1 C C C A:
4. Select the best solution.
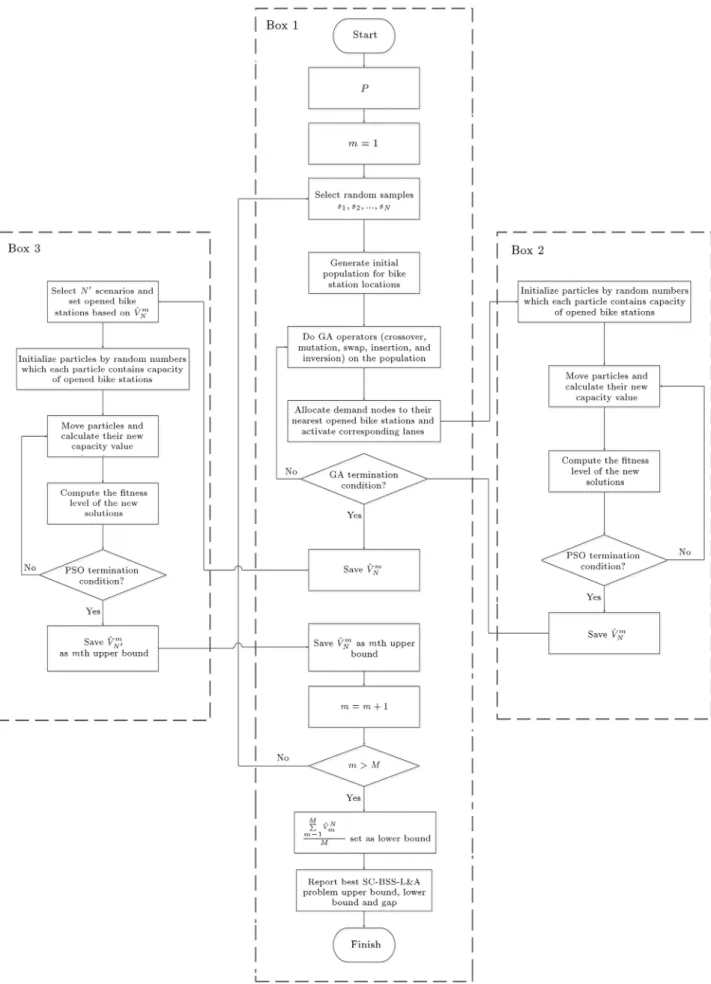
The proposed hybrid algorithm inside the SAA sampling method is depicted with more details in Figure 1; Figure 2 explains the procedure in summary. In the next subsection, more details about solution representation, used operators, and main stages of the algorithm are described.
3.1. The proposed algorithms for the
optimization stage of the solution method As mentioned before, in each iteration of the SAA scheme, we need to optimize a problem, so a hybrid algorithm is developed. It consists of two phases. In the rst one, location decisions are made by the genetic algorithm, and the lane construction and path decisions are made by a greedy search, while in the second stage, the decisions of bike capacities of station are made by the PSO algorithm according to the previous stage decisions. In the following, more details of the mentioned stages are provided:
a) The rst phase of the algorithm: In the rst phase, Genetic Algorithm (GA) is used. Its solution contains three parts. The rst one determines sta-tion locasta-tions called the locasta-tion sub-chromosome Figure 3. The second and third ones dene demand nodes allocation and lane construction decisions, respectively. During the genetic algorithm oper-ators of crossover, mutation, insertion, swap and inversion are used for diversifying and intensifying new solutions as the rst part of the solution (as depicted in Figures 4-8), while other parts are determined by a greedy search algorithm.
Dierent percentages (i.e. 70, 40, 10, 60, and 10%) of the old generation cases are selected randomly for the crossover, mutation, swap, rever-sion, and insertion operators, respectively; after
Figure 2. Summarized owchart of the greedy GA{PSO algorithm during the sampling scheme for S{L&A{CBSS problem.
Figure 3. Schematic representation of the location sub-chromosome for S{L&A{CBSS problem.
Figure 4. Reversion operator procedure for the greedy GA-PSO.
Figure 5. Insertion operator procedure for the greedy GA-PSO.
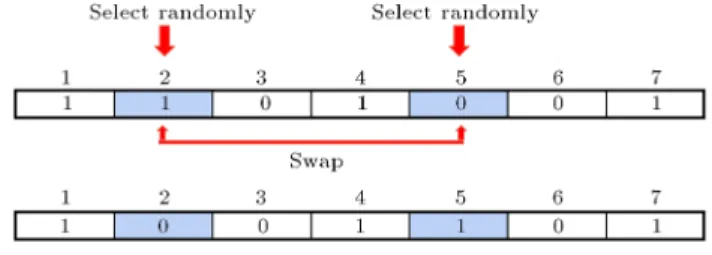
Figure 6. Swap operator procedure for the greedy GA-PSO.
Figure 7. Mutation operator procedure for the greedy GA-PSO.
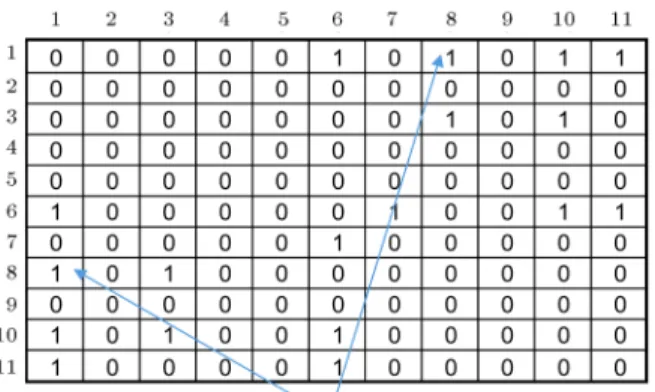
producing new solutions by the mentioned op-erations, the best solutions are selected for the new generation. All possible paths for all pairs of origin and destination through active stations are considered, and then the shortest path is selected in the path sub-chromosomes (Figure 9)
Figure 8. Crossover operator procedure for the greedy GA-PSO.
Figure 9. Schematic representation of the path sub-chromosomes related to the best routs for the S-L&A-CBSS problem.
Figure 10. Schematic representation of the constructed lanes sub-chromosome for the S-L&A-CBSS problem.
and necessary bike lanes will be activated based on the allocation structure shown in the constructed lanes sub-chromosome (Figure 10). After that, for dening station capacities and calculating objective function's value of each chromosome, the second phase should be followed;
b) The second phase of the algorithm: The chromosome dened in the rst phase is used as an input of the second phase of the algorithm. Then, capacities of active stations are chosen based on the input chromosome to minimize the total cost. For this purpose, with respect to the relatively continuous demand variable nature, a PSO-based algorithm is used for nding the optimum active station capacities in this phase. Each particle
Figure 11. Particles for the second phase of the greedy GA-PSO in the S-L&A-CBSS problem.
represents active station capacities. As an example, a particle with capacities of three active stations is depicted in Figure 11.
4. Illustrative examples
In this section, we will present some data instances with dierent dimensions for location-allocation problem of bike sharing system with stochastic demands to demon-strate the characteristics of the proposed algorithm performance compared to the exact method.
4.1. Data settings
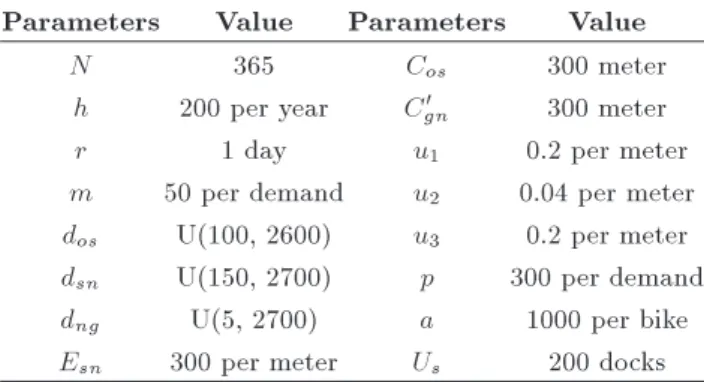
Some instances have been generated randomly to eval-uate the performance of algorithm as well as model validity. As an example, for the smallest example with 3 origins, 3 destinations, and 6 candidate locations for establishing bike stations, we generated dierent demand scenarios of each origin-destination pair based on a uniform distribution between 0.8 and 1.2 mul-tiplied by a basic demand table (Table 3). The rest of the parameters of S-L&A-CBSS problem instances are presented in Tables 4 and 5. Other instances with dierent dimensions are generated based on the same procedure.
Table 3. Basic table of the bike demands between origins and destinations for the rst instance.
g1 g2 g3
o1 14050 28940 30070 o2 29800 9977 25910 o3 31020 44990 49260
Table 4. Fixed construction cost of stations for the rst instance.
Stations fs s1 5005480 s2 2894000 s3 5285200 s4 4100000 s5 5001900 s6 4936100
Table 5. Other parameter values for the S-L&A-CBSS problem instances.
Parameters Value Parameters Value
N 365 Cos 300 meter
h 200 per year C0
gn 300 meter
r 1 day u1 0.2 per meter
m 50 per demand u2 0.04 per meter dos U(100, 2600) u3 0.2 per meter dsn U(150, 2700) p 300 per demand dng U(5, 2700) a 1000 per bike Esn 300 per meter Us 200 docks
For assessing this algorithm in real case dimen-sions, a part of Tehran business zone is selected. Origin and destination nodes were selected close to the public and important centers such as shopping centers, governmental oces, museums, public library, bus and metro stations, etc.
4.2. The proposed algorithm and exact method results
In this section, the proposed algorithm and exact method were used to assess the eciency of the proposed algorithm. We carried out the test on all examples by GAMS 24.1.2 software and we tested their dierent MIP solvers for solving examples; the result shows that the BARON solver has more e-cient performance; therefore, the results obtained by this solver are selected as a measure for considering the proposed algorithm performance. The proposed evolutionary algorithm was implemented in MATLAB R2013a software. All examples were implemented on a PC under Windows 7 (64 bit) with Intel(R) Core(TM) i7, 2670QMCPU @ 2.20GHz and 6 GB RAM. Table 6 presents the solution quality of the test results of
Figure 12. Objective function values calculated by the greedy GA-PSO algorithm and the exact method.
Figure 13. Gaps between lower and upper bounds achieved by the greedy GA-PSO algorithm and the exact method.
the proposed algorithm and the exact method. For considering stochastic nature of the problem, we set M = 10, N = 20, and N0 = 2000 in the hybrid
SAA-based algorithm. The nal results are reported in Table 6 for all of the instances. The lower and upper bounds are calculated according to the number of N or N0 scenarios. The mentioned bounds are reported in
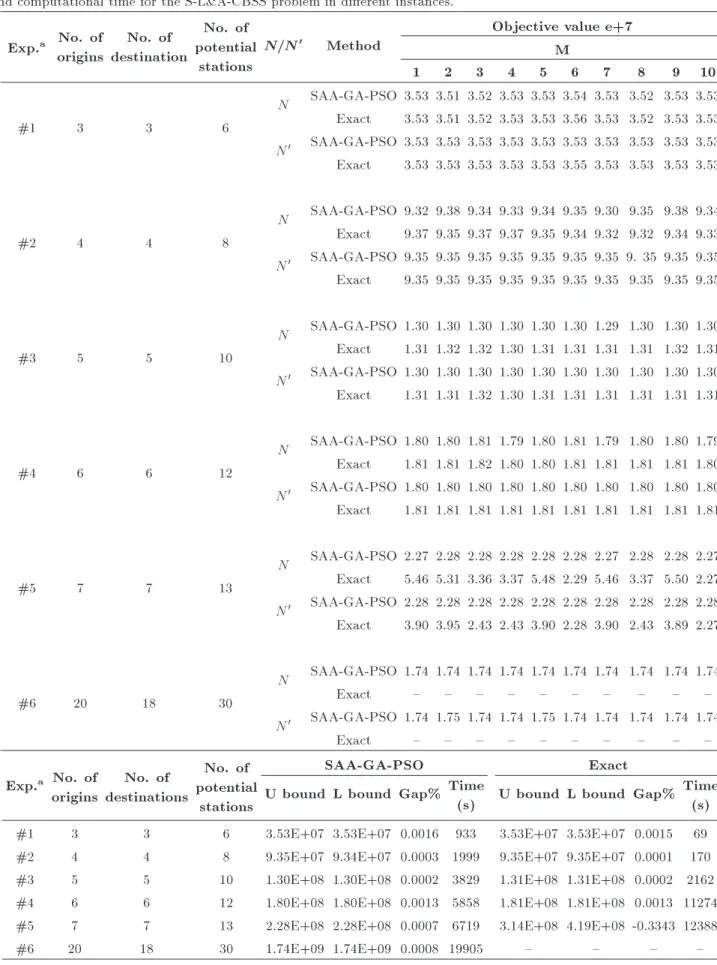
the table for each instance. The gap column shows that gaps between lower and upper bounds are divided into the upper bounds multiplied by 100. The comparison of the results conrms that the proposed algorithm behaves similarly to the exact solution method in small-sized instances, while the exact method is inecient in nding the lower and upper bounds of the problem by increasing the problem size, as illustrated in Figures 12 and 13. By comparing the results achieved by both methods, it is clear that the proposed algorithm is more ecient than the exact method for the S-L&A-CBSS problem.
The computational times of the proposed algo-rithm and the exact method have been compared, and the results are depicted in Figure 14. It conrms that by increasing the size of S-L&A-CBSS problem, the proposed algorithm is more ecient than exact solution approaches. As presented in Figure 14, the compu-tational time increases with an increasing number of problem dimensions while this increase is linear in the proposed algorithm and is nearly exponential for the exact method; therefore, for solving location-allocation
Table 6. Comparison of results for the SAA based greedy GA-PSO algorithm and exact solution in both solution quality and computational time for the S-L&A-CBSS problem in dierent instances.
Exp.a No. of origins
No. of destination
No. of potential
stations
N=N0 Method Objective value e+7
M
1 2 3 4 5 6 7 8 9 10
#1 3 3 6
N SAA-GA-PSO 3.53 3.51 3.52 3.53 3.53 3.54 3.53 3.52 3.53 3.53 Exact 3.53 3.51 3.52 3.53 3.53 3.56 3.53 3.52 3.53 3.53 N0 SAA-GA-PSO 3.53 3.53 3.53 3.53 3.53 3.53 3.53 3.53 3.53 3.53 Exact 3.53 3.53 3.53 3.53 3.53 3.55 3.53 3.53 3.53 3.53
#2 4 4 8
N SAA-GA-PSO 9.32 9.38 9.34 9.33 9.34 9.35 9.30 9.35 9.38 9.34 Exact 9.37 9.35 9.37 9.37 9.35 9.34 9.32 9.32 9.34 9.33 N0 SAA-GA-PSO 9.35 9.35 9.35 9.35 9.35 9.35 9.35 9. 35 9.35 9.35 Exact 9.35 9.35 9.35 9.35 9.35 9.35 9.35 9.35 9.35 9.35
#3 5 5 10
N SAA-GA-PSO 1.30 1.30 1.30 1.30 1.30 1.30 1.29 1.30 1.30 1.30 Exact 1.31 1.32 1.32 1.30 1.31 1.31 1.31 1.31 1.32 1.31 N0 SAA-GA-PSO 1.30 1.30 1.30 1.30 1.30 1.30 1.30 1.30 1.30 1.30 Exact 1.31 1.31 1.32 1.30 1.31 1.31 1.31 1.31 1.31 1.31
#4 6 6 12
N SAA-GA-PSO 1.80 1.80 1.81 1.79 1.80 1.81 1.79 1.80 1.80 1.79 Exact 1.81 1.81 1.82 1.80 1.80 1.81 1.81 1.81 1.81 1.80 N0 SAA-GA-PSO 1.80 1.80 1.80 1.80 1.80 1.80 1.80 1.80 1.80 1.80 Exact 1.81 1.81 1.81 1.81 1.81 1.81 1.81 1.81 1.81 1.81
#5 7 7 13
N SAA-GA-PSO 2.27 2.28 2.28 2.28 2.28 2.28 2.27 2.28 2.28 2.27 Exact 5.46 5.31 3.36 3.37 5.48 2.29 5.46 3.37 5.50 2.27 N0 SAA-GA-PSO 2.28 2.28 2.28 2.28 2.28 2.28 2.28 2.28 2.28 2.28 Exact 3.90 3.95 2.43 2.43 3.90 2.28 3.90 2.43 3.89 2.27
#6 20 18 30
N SAA-GA-PSO 1.74 1.74 1.74 1.74 1.74 1.74 1.74 1.74 1.74 1.74
Exact { { { { { { { { { {
N0 SAA-GA-PSO 1.74 1.75 1.74 1.74 1.75 1.74 1.74 1.74 1.74 1.74
Exact { { { { { { { { { {
Exp.a No. of origins
No. of destinations
No. of potential
stations
SAA-GA-PSO Exact
U bound L bound Gap% Time
(s) U bound L bound Gap% Time(s) #1 3 3 6 3.53E+07 3.53E+07 0.0016 933 3.53E+07 3.53E+07 0.0015 69 #2 4 4 8 9.35E+07 9.34E+07 0.0003 1999 9.35E+07 9.35E+07 0.0001 170 #3 5 5 10 1.30E+08 1.30E+08 0.0002 3829 1.31E+08 1.31E+08 0.0002 2162 #4 6 6 12 1.80E+08 1.80E+08 0.0013 5858 1.81E+08 1.81E+08 0.0013 11274 #5 7 7 13 2.28E+08 2.28E+08 0.0007 6719 3.14E+08 4.19E+08 -0.3343 12388
#6 20 18 30 1.74E+09 1.74E+09 0.0008 19905 { { { {
Figure 14. The dierence between the computational times of the greedy GA-PSO algorithm and the exact method.
problems of bike sharing system with usual sizes, the exact method loses its eectiveness in practice, and then it is needed to be replaced with another algorithm such as the hybrid greedy GA-PSO algorithm.
5. Sensitivity analysis
We performed the sensitivity analysis on the greedy GA-PSO algorithm with respect to the number of sce-narios (N) and iterations (M). Moreover, a sensitivity analysis was performed to evaluate the eect of the bike shortage cost on the model behavior. Figure 15 presents change of the gap by increasing of number of scenarios (N) in dierent levels of M. As illustrated in the mentioned gure, the gap is decreased by increasing N. However, the decreasing slope is higher for small values of M.
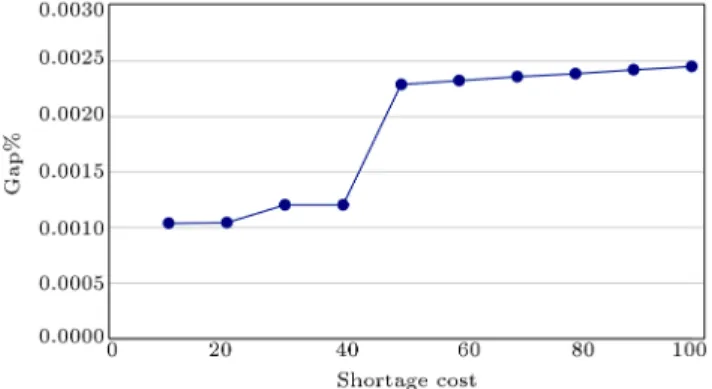
To evaluate the model performance, another sen-sitivity analysis was performed. The most important factor in the model was the bike shortage cost, while customers cannot receive the bike sharing system ser-vice due to the shortage. By increasing the shortage cost, we expected to have a more sensitive behavior of the model to the customer demands. By dierent experiments with dierent shortage cost values, we observed that the model tends to have a higher gap between lower and upper bounds with increasing the
Figure 15. Eect of the number of scenarios on the gap between lower and upper bounds.
Figure 16. Eect of the shortage cost on the gap between lower and upper bounds.
shortage cost as depicted in Figure 16. Due to the increasing demand sensitivity while it has stochastic nature, the results can be conrmed. The mentioned experiment can show reasonable behavior of the pro-posed model.
6. Summary and concluding remarks
Using the bike sharing system in cooperation with other public transportation systems is an alternative trans-portation paradigm that would reduce air pollution, intensive trac jams, and carbon emissions. However, the success of such systems depends on nding the optimum locations for the bike stations in under real-world environment in which there are demand uncer-tainties. In this paper, a location-allocation model, which includes capacity decisions, was presented and the SAA method was used to tackle uncertainties of the problem. Because of the NP-hardness of the problem, the exact methods were not practical for the real-sized problems; therefore, a hybrid greedy/evolutionary al-gorithm based on genetic alal-gorithm and particle swarm optimization was developed. Dierent analyses con-rmed the validity of the proposed model as well as the eciency of the hybrid algorithm. The model can be extended by considering dierent stochastic demand patterns for bikes and docks simultaneously in which bike stations in dierent times of days will be faced with dierent demand patterns. Moreover, the eet balance of the BSS in uncertain environment and using large-scale optimization techniques can be another direction for the future study. Finally, due to possibility for the bike-sharing problems to face many objectives, considering the problem in such an environment will be an interesting subject for more studies.
References
1. Vogel, P., Greiser, T. and Mattfeld, D.C.
\Understand-ing bike-shar\Understand-ing systems us\Understand-ing data min\Understand-ing: explor\Understand-ing activity patterns", Procedia-Social and Behavioral Sci-ences, 20 (0), pp. 514-523 (2011).
2. Bordagaray, M., Fonzone, A., dell'Olio, L. and Ibeas, A. \Considerations about the Analysis of ITS Data of Bicycle Sharing Systems", Procedia-Social and Behav-ioral Sciences, 162, pp. 340-349 (2014).
3. Ando, R., Yamazaki, M., Haraand, M. and Izuhara,
K. \An analysis on feasibility of park & cycle ride system in a Japanese local city", Procedia-Social and Behavioral Sciences, 54, pp. 37-46 (2012).
4. Yoon, J.W., Pinelli, F. and Calabrese, F. \Cityride:
a predictive bike sharing journey advisor", in Mobile Data Management (MDM), 2012 IEEE 13th Interna-tional Conference on, pp. 306-311 (2012).
5. Lathia, N., Ahmed, S. and Capra, L. \Measuring the
impact of opening the London shared bicycle scheme to casual users", Transportation Research Part C: Emerging Technologies, 22, pp. 88-102 (2012).
6. Bordagaray, M., Ibeas, A., and dell'Olio, L. \Modeling
user perception of public bicycle services", Procedia-Social and Behavioral Sciences, 54(0), pp. 1308-1316 (2012).
7. Ji, S., Cherry, C.R., Han, L.D. and Jordan, D.A.
\Electric bike sharing: simulation of user demand and system availability", Journal of Cleaner Production, 85(0), pp. 250-257 (2014).
8. Jappinen, S., Toivonen, T. and Salonen, M.
\Mod-elling the potential eect of shared bicycles on public transport travel times in Greater Helsinki: An open data approach", Applied Geography, 43(0), pp. 13-24 (2013).
9. Fishman, E., Washington, S. and Haworth, N.L. \Bike
share's impact on car use: evidence from the United States, Great Britain, and Australia", in Proceedings of the 93rd Annual Meeting of the Transportation Research Board (2014).
10. Lin, J.-R. and Yang, T.-H. \Strategic design of public
bicycle sharing systems with service level constraints", Transportation Research Part E: Logistics and Trans-portation Review, 47(2), pp. 284-294 (2011).
11. Lin, J.-R., Yang, T.-H. and Chang, Y.-C. \A hub
location inventory model for bicycle sharing system design: Formulation and solution", Computers and Industrial Engineering, 65(1), pp. 77-86 (2013).
12. Romero, J.P., Ibeas, A., Moura, J.L., Benavente, J.
and Alonso, B. \A simulation-optimization approach to design ecient systems of bike-sharing", Procedia - Social and Behavioral Sciences, 54(0), pp. 646-655 (2012).
13. Garcia-Palomares, J.C., Gutierrez, J. and Latorre, M.
\Optimizing the location of stations in bike-sharing programs: A GIS approach", Applied Geography, 35(1-2), pp. 235-246 (2012).
14. Liu, H., Yang, C. and Yang, J. \Robust transportation
network design modeling with regret value", Journal of Transportation Systems Engineering and Information Technology, 13(5), pp. 86-92 (2013).
15. Chen, A. and Yang, C. \Stochastic transportation
net-work design problem with spatial equity constraint", Transportation Research Record: Journal of the Trans-portation Research Board, 1882(1), pp. 97-104 (2004).
16. Ukkusuri, S.V., Mathew, T.V. and Waller, S.T.
\Ro-bust transportation network design under demand uncertainty", Computer-Aided Civil and Infrastructure Engineering, 22(1), pp. 6-18 (2007).
17. Hua, S., Ziyou, G. and Jiancheng, L. \The robust
model of continuous transportation network design problem with demand uncertainty", Journal of Trans-portation Systems Engineering and Information Tech-nology, 11(2), pp. 70-76 (2011).
18. Saez, D., Cortes, C. E., Milla, F., Nunez, A.,
Tira-chini, A. and Riquelme, M. \Hybrid predictive control strategy for a public transport system with uncertain demand", Transportmetrica, 8(1), pp. 61-86 (2012).
19. Huang, Z., Ren, G. and Liu, H. \Optimizing bus
frequencies under uncertain demand: Case study of the transit network in a developing city", Mathematical Problems in Engineering, 2013 (2013).
20. Cao, J.X., Li, X.X., Wang, Z.Y. and Wu, J. \The
Robust model of continuous transportation network design problem with demand and cost uncertainties", Procedia-Social and Behavioral Sciences, 96, pp. 970-980 (2013).
21. Ahmed, S., Shapiro, A. and Shapiro, E. \The sample
average approximation method for stochastic pro-grams with integer recourse", Submitted for publication (2002).
22. Kleywegt, A.J., Shapiro, A. and Homem-de-Mello,
T. \The sample average approximation method for stochastic discrete optimization", SIAM Journal on Optimization, 12(2), pp. 479-502 (2002).
23. Wei, J. and Real, M.J. \Sample average
approxima-tion methods for stochastic MINLPs", Computers and Chemical Engineering, 28(3), pp. 333-346 (2004).
24. Schutz, P., Tomasgard, A. and Ahmed, S. \Supply
chain design under uncertainty using sample average approximation and dual decomposition" 'European Journal of Operational Research, 199(2), pp. 409-419 (2009).
25. Contreras, I., Cordeau, J.-F. and Laporte, G.
\Stochastic uncapacitated hub location", European Journal of Operational Research, 212(3), pp. 518-528 (2011).
26. Aydin, N. and Murat, A. \A swarm intelligence based
sample average approximation algorithm for the capac-itated reliable facility location problem", International Journal of Production Economics, 145(1), pp. 173-183 (2013).
27. Mohtashami, A., Tavana, M., Santos-Arteaga, F.J.
and Fallahian-Najafabadi, A. \A novel multi-objective meta-heuristic model for solving cross-docking schedul-ing problems", Applied Soft Computschedul-ing, 31(0), pp. 30-47 (2015).
28. Martinez-Salazar, I.A., Molina, J., Angel-Bello, F., Gomez, T. and Caballero, R. \Solving a bi-objective transportation location routing problem by meta-heuristic algorithms", European Journal of Operational Research, 234(1), pp. 25-36 (2014).
29. Cao, E., Lai, M. and Yang, H. \Open vehicle
rout-ing problem with demand uncertainty and its robust strategies", Expert Systems with Applications, 41(7), pp. 3569-3575 (2014).
30. Lot, M.M. and Tavakkoli-Moghaddam, R. \A
ge-netic algorithm using priority-based encoding with new operators for xed charge transportation prob-lems", Applied Soft Computing, 13(5), pp. 2711-2726 (2013).
31. Bolat, B., Altun, O. and Corte0s, P. \A particle
swarm optimization algorithm for optimal car-call allocation in elevator group control systems", Applied Soft Computing, 13(5), pp. 2633-2642 (2013).
32. Yaghini, M., Momeni, M. and Sarmadi, M. \A
Simplex-based simulated annealing algorithm for node-arc capacitated multicommodity network design", Applied Soft Computing, 12(9), pp. 2997-3003 (2012).
33. Lin, Y., Li, W., Qiu, F. and Xu, H. \Research
on optimization of vehicle routing problem for ride-sharing taxi", Procedia-Social and Behavioral Sciences, 43, pp. 494-502 (2012).
34. Yu, B., Yang, Z., Sun, X., Yao, B., Zeng, Q. and
Jeppesen, E. \Parallel genetic algorithm in bus route headway optimization", Applied Soft Computing, 11 (8), pp. 5081-5091 (2011).
35. Ghoseiri, K. and Nadjari, B. \An ant colony
optimization algorithm for the bi-objective shortest path problem", Applied Soft Computing, 10(4), pp. 1237-1246 (2010).
36. Musa, R., Arnaout, J.-P. and Jung, H. \Ant colony
optimization algorithm to solve for the transportation problem of cross-docking network", Computers and Industrial Engineering, 59(1), pp. 85-92 (2010).
37. Martinez, L.M., Caetano, L., Eiro, T. and Cruz, F.
\An optimisation algorithm to establish the location of stations of a mixed eet biking system: An
application to the city of lisbon", Procedia - Social and Behavioral Sciences, 54(0), pp. 513-524 (2012).
Biographies
Ehsan Ali Askari received BS and MS degrees in Industrial Engineering from Islamic Azad University, South Tehran Branch in 2001 and 2004. He is now working towards the PhD degree at the Department of Industrial Engineering, Shahed University, Tehran, Iran. His research interests include operational re-search, optimization, and meta-heuristic algorithms. Mahdi Bashiri is an Associate Professor of Industrial engineering at Shahed University. He holds a BS in Industrial Engineering from Iran University of Science and Technology, and MS and PhD in this eld from Tarbiat Modares University. He is the recipient of the 2013 young national top scientist award from Academy of Sciences of the Islamic Republic of Iran. His research interests are facilities planning, metaheuristics, and multi-response optimization.
Reza Tavakkoli-Moghaddam is a Professor of In-dustrial Engineering at College of Engineering, Uni-versity of Tehran in Iran. He obtained his PhD in Industrial Engineering from Swinburne University of Technology in Melbourne (1998), his MSc in Industrial Engineering from the University of Melbourne in Mel-bourne (1994), and his BSc in Industrial Engineering from the Iran University of Science and Technology in Tehran (1989). He serves as a member of Editorial Board of the International Journal of Engineering, Iranian Journal of Operations Research, Journal of Industrial Engineering, and Iranian Journal of Produc-tion and OperaProduc-tions Management. He is the recipient of the 2009 and 2011 Distinguished Researcher Awards and the 2010 and 2014 Distinguished Applied Research Award at University of Tehran, Iran. He has been selected as National Iranian Distinguished Researcher for 2008 and 2010. Professor Tavakkoli-Moghaddam has published 4 books, 15 book chapters, more than 600 papers in reputable academic journals and conferences.