Samira Ellouze, Mahar Jaoua and Lamia Hadrich Belguith
ANLP research Group, MIRACL Laboratory, University of Sfax, TunisiaMix Multiple Features to Evaluate the
Content and the Linguistic Quality of
Text Summaries
In this article, we propose a method of text summary's content and linguistic quality evaluation that is based on a machine learning approach. This method oper-ates by combining multiple features to build predic-tive models that evaluate the content and the linguistic quality of new summaries (unseen) constructed from the same source documents as the summaries used in the training and the validation of models. To obtain the best model, many single and ensemble learning classi-fiers are tested. Using the constructed models, we have achieved a good performance in predicting the content and the linguistic quality scores. In order to evaluate the summarization systems, we calculated the system score as the average of the score of summaries that are built from the same system. Then, we evaluated the correlation of the system score with the manual system score. The obtained correlation indicates that the sys-tem score outperforms the baseline scores.
ACM CCS (2012) Classification: Information systems
→ Information retrieval → Retrieval tasks and goals → Summarization
Computing methodologies → Artificial intelligence → Natural language processing → Information ex-traction
Computing methodologies → Artificial intelligence → Natural language processing → Discourse, dia-logue and pragmatics
Keywords: summary evaluation, content, linguistic quality, machine learning, regression or classification
1. Introduction
With the significant increase in automatic sum-marization systems, text summary evaluation has become an absolutely necessary task which guides the development of suitable
summariza-tion approaches. However, it is a complex task. In fact, the complexity of this task comes from the unclear definition of summarization prop-erties: ''What represents a 'good' summary''? It is in this context that several studies have been conducted to develop manual and automatic evaluation metrics of text summaries. These metrics can be divided into intrinsic or extrinsic metrics. Because of the importance of evaluat-ing summarization systems, many evaluation conferences have been organized in the last two decades, such as SUMMAC, DUC (Document Understanding Conference), TAC (Text Anal-ysis Conference), etc., to evaluate the perfor-mance of summaries generated automatically. In addition, in the TAC'2009 session, an automatic evaluation task was proposed to encourage re-searchers to develop automatic evaluation met-rics. Most of the metrics previously developed
in the field of automatic evaluation of content
frame-work that we have targeted as a field of study both types of evaluation while trying to address some aspects of the semantic level. The initial idea revolves around experiments conducted by [2] and [3], who tried to combine automatic metrics to better correlate with manual metrics. So the objective is to build models able to pre-dict a manual content metric and others able to predict a linguistic quality metric by combining automatic metrics and features defined on the candidate summary. The choice of combining these features as a strategy has a number of ad-vantages. For instance, one can benefit from the use of content features that operate on different levels of analysis. In addition, linguistic qual-ity aggregates several linguistic aspects such as structure and coherence, grammaticality, focus, etc. Those aspects cannot be handled with one simple metric; this is why we have used a com-bination of features. The comcom-bination of fea-tures is performed using two machine learning techniques: regression and classification, which will allow us to predict respectively PYRAMID and linguistic quality scores for unseen sum-mary and summarization system. In addition, in the first step, linguistic quality has been eval-uated using one predictive model and without taking into account the variation on the topic of each source documents collection. However, the variation of topics leads to a variation in the writing style, the vocabularies used, the struc-tures used, the length of sentences, etc., which may influence the performance of the predic-tive model. For this reason, in the second step, we evaluated the linguistic quality by building a predictive model for each collection of source documents. The rest of this paper is structured as follows: In Section 2, we present the princi-pal works that have addressed the problem of the evaluation of the content and the linguistic quality of a summary. Then in Section 3, we ex-plain the proposed method which is based on machine learning techniques. In Section 4, we give the details of each machine learning step. In Section 5, we present our experiments in dif-ferent summarization tasks and difdif-ferent levels of evaluation, and then we discuss the obtained results.
2. Previous Work
In this section, we describe the principal related works that deal with the evaluation of the con-tent and the linguistic quality of a text summary.
2.1. Content Evaluation
The summary evaluation task started with the manual comparison of peer summaries with ref-erence summaries. Achieving this task was an
arduous and costly process. One of the first and
famous tools of manual summary evaluation is SEE (Summary Evaluation Environment) [4]. It allowed human judges to manually evaluate the content and the linguistic quality (i.e. gram-maticality, cohesion, coherence, etc.) of a sum-mary. To evaluate content, human judges were used to compare a candidate summary (system summary) to an ideal summary. After that, [5] proposed PYRAMID which is a manual metric based on identifying the common ideas between a candidate summary and one or several refer-ence summaries. These ideas are represented as semantic information units called Semantic Content Units (SCUs). The PYRAMID metric was used by the TAC and DUC conference to evaluate the content of candidate summaries. Several automatic metrics have been presented to treat the cost / time problem imposed by man-ual metrics. One of the well-known metrics in automatic text evaluation is ROUGE [6]. It mea-sures the number of overlapping units between a candidate summary and reference summaries. There are many variants of the ROUGE metric which change according to the chosen unit of comparison such as n-gram (ROUGE-N), word sequences (ROUGE-L, ROUGE-W), and word pairs (ROUGE-S) between the candidate sum-mary and the reference summaries. Afterwards, [7] proposed a new metric called BE (Basic Elements) which operates at the semantic level rather than the shallow or surface level like the ROUGE metric. To decompose each sentence in a summary to minimum semantic units called Basic Elements (BE), each summary requires a deep analysis (a semantic analysis). The final score relies on the overlap of BE units between a candidate summary and reference summaries. Later, Giannakopoulos et al. [8] introduced the AutoSummENG metric, which is based on the statistical extraction of textual information from the summary. The information extracted from the summary represents a set of relations between the summary's n-grams. A graph is constructed including the full set of relations and additional information concerning these re-lations. The estimation of the similarity degree is performed by comparing the graph of the candidate summary with the graph of each ref-erence summary. Finally, the average similarity
2.2. Linguistic Quality Evaluation
The language quality is an important factor in assessing the quality of a summary. Indeed, a good linguistic quality makes a summary easy to read and understand. In fact, in the TAC con-ference, the linguistic quality was based on the combination of five aspects, namely structure and coherence, grammaticality, non-redun-dancy, referential clarity and focus. During the DUC and the TAC conferences, the linguistic quality of a summary was evaluated by human judges that took into account the five linguis-tic aspects without using reference summaries or source documents. Accordingly, the judges did not take into account the relationship be-tween the summary and the source documents and were expected to assess the summary as a separate document.
Because of the difficulty of manual evaluation, more work has been done in this area for auto-mation. In this context, [12] evaluated mainly the local coherence of the summary using an entity grid model that captures the transitions of entities between two adjacent sentences. In this model, the text is represented as a matrix where each column contains one entity and each line contains a sentence. Each cell corresponds to the grammatical role of the entity in the sen-tence. The proposed method calculates the local coherence of the summary using the probabil-ity distribution of the entprobabil-ity's transitions. Many other researches like [13] and [14], explored the entity grid model to evaluate local coherence. In addition, [15] dealt with the assessment of grammaticality and coherence in the summary. They proposed to apply machine learning tech-niques to train a language model by referring to a corpus of manual summaries with parts of speech and/or chunk labels. After that, the learn-ing model estimates the probability of gram-matical acceptability of a sentence. To evaluate the structure and the coherence of a summary, [15] built a lexical chain which is spread over the entire summary to represent the sequences of related words. The lexical chain which is produced can provide information on the focus of each sentence, which in its turn contributes to the focus of the summary. Besides, [16] at-tempted to predict each of the five linguistic aspects mentioned previously. They identified several linguistic features that were grouped into classes. Then, they tried to identify the best degree between the candidate summary and all
reference summaries is considered as the over-all score of the candidate summary. In a subse-quent work, Giannakopoulos and Vangelis [9] presented the Merge Model Graph (MeMoG) which is another variation of the AutoSum-mENG based on n-gram graphs. This variation calculates the merged graph of all the reference summaries. Then, it computes the similarity de-gree between the candidate summary graph and the merged graph of the reference summaries. In a recent work, [10] developed the SIMetrix measurement; it assesses a candidate summary by comparing it with the source documents in-stead of reference summaries. The SIMetrix is a full automatic metric which does not depend on reference summaries. [10] computed ten mea-sures of similarity based on the comparison be-tween the source documents and the candidate summary. Among the used similarity measures we cite the cosine similarity, the divergence of Jensen-Shannon, the divergence of Kull-back-Leibler, etc. In a more recent work, [11] developed the SERA (Summarization Evalua-tion by Relevance Analysis) metric, which is designed to evaluate scientific articles. This metric relies on the relevant content shared by a candidate summary and reference summa-ries. [11] used an information-retrieval-based method which treats summaries as search que-ries and then measured the overlaps of the re-trieved results. A larger number of overlaps be-tween the candidate summary and the reference summary indicates that the candidate summary has a higher content quality.
work that we have targeted as a field of study both types of evaluation while trying to address some aspects of the semantic level. The initial idea revolves around experiments conducted by [2] and [3], who tried to combine automatic metrics to better correlate with manual metrics. So the objective is to build models able to pre-dict a manual content metric and others able to predict a linguistic quality metric by combining automatic metrics and features defined on the candidate summary. The choice of combining these features as a strategy has a number of ad-vantages. For instance, one can benefit from the use of content features that operate on different levels of analysis. In addition, linguistic qual-ity aggregates several linguistic aspects such as structure and coherence, grammaticality, focus, etc. Those aspects cannot be handled with one simple metric; this is why we have used a com-bination of features. The comcom-bination of fea-tures is performed using two machine learning techniques: regression and classification, which will allow us to predict respectively PYRAMID and linguistic quality scores for unseen sum-mary and summarization system. In addition, in the first step, linguistic quality has been eval-uated using one predictive model and without taking into account the variation on the topic of each source documents collection. However, the variation of topics leads to a variation in the writing style, the vocabularies used, the struc-tures used, the length of sentences, etc., which may influence the performance of the predic-tive model. For this reason, in the second step, we evaluated the linguistic quality by building a predictive model for each collection of source documents. The rest of this paper is structured as follows: In Section 2, we present the princi-pal works that have addressed the problem of the evaluation of the content and the linguistic quality of a summary. Then in Section 3, we ex-plain the proposed method which is based on machine learning techniques. In Section 4, we give the details of each machine learning step. In Section 5, we present our experiments in dif-ferent summarization tasks and difdif-ferent levels of evaluation, and then we discuss the obtained results.
2. Previous Work
In this section, we describe the principal related works that deal with the evaluation of the con-tent and the linguistic quality of a text summary.
2.1. Content Evaluation
The summary evaluation task started with the manual comparison of peer summaries with ref-erence summaries. Achieving this task was an
arduous and costly process. One of the first and
famous tools of manual summary evaluation is SEE (Summary Evaluation Environment) [4]. It allowed human judges to manually evaluate the content and the linguistic quality (i.e. gram-maticality, cohesion, coherence, etc.) of a sum-mary. To evaluate content, human judges were used to compare a candidate summary (system summary) to an ideal summary. After that, [5] proposed PYRAMID which is a manual metric based on identifying the common ideas between a candidate summary and one or several refer-ence summaries. These ideas are represented as semantic information units called Semantic Content Units (SCUs). The PYRAMID metric was used by the TAC and DUC conference to evaluate the content of candidate summaries. Several automatic metrics have been presented to treat the cost / time problem imposed by man-ual metrics. One of the well-known metrics in automatic text evaluation is ROUGE [6]. It mea-sures the number of overlapping units between a candidate summary and reference summaries. There are many variants of the ROUGE metric which change according to the chosen unit of comparison such as n-gram (ROUGE-N), word sequences (ROUGE-L, ROUGE-W), and word pairs (ROUGE-S) between the candidate sum-mary and the reference summaries. Afterwards, [7] proposed a new metric called BE (Basic Elements) which operates at the semantic level rather than the shallow or surface level like the ROUGE metric. To decompose each sentence in a summary to minimum semantic units called Basic Elements (BE), each summary requires a deep analysis (a semantic analysis). The final score relies on the overlap of BE units between a candidate summary and reference summaries. Later, Giannakopoulos et al. [8] introduced the AutoSummENG metric, which is based on the statistical extraction of textual information from the summary. The information extracted from the summary represents a set of relations between the summary's n-grams. A graph is constructed including the full set of relations and additional information concerning these re-lations. The estimation of the similarity degree is performed by comparing the graph of the candidate summary with the graph of each ref-erence summary. Finally, the average similarity
2.2. Linguistic Quality Evaluation
The language quality is an important factor in assessing the quality of a summary. Indeed, a good linguistic quality makes a summary easy to read and understand. In fact, in the TAC con-ference, the linguistic quality was based on the combination of five aspects, namely structure and coherence, grammaticality, non-redun-dancy, referential clarity and focus. During the DUC and the TAC conferences, the linguistic quality of a summary was evaluated by human judges that took into account the five linguis-tic aspects without using reference summaries or source documents. Accordingly, the judges did not take into account the relationship be-tween the summary and the source documents and were expected to assess the summary as a separate document.
Because of the difficulty of manual evaluation, more work has been done in this area for auto-mation. In this context, [12] evaluated mainly the local coherence of the summary using an entity grid model that captures the transitions of entities between two adjacent sentences. In this model, the text is represented as a matrix where each column contains one entity and each line contains a sentence. Each cell corresponds to the grammatical role of the entity in the sen-tence. The proposed method calculates the local coherence of the summary using the probabil-ity distribution of the entprobabil-ity's transitions. Many other researches like [13] and [14], explored the entity grid model to evaluate local coherence. In addition, [15] dealt with the assessment of grammaticality and coherence in the summary. They proposed to apply machine learning tech-niques to train a language model by referring to a corpus of manual summaries with parts of speech and/or chunk labels. After that, the learn-ing model estimates the probability of gram-matical acceptability of a sentence. To evaluate the structure and the coherence of a summary, [15] built a lexical chain which is spread over the entire summary to represent the sequences of related words. The lexical chain which is produced can provide information on the focus of each sentence, which in its turn contributes to the focus of the summary. Besides, [16] at-tempted to predict each of the five linguistic aspects mentioned previously. They identified several linguistic features that were grouped into classes. Then, they tried to identify the best degree between the candidate summary and all
reference summaries is considered as the over-all score of the candidate summary. In a subse-quent work, Giannakopoulos and Vangelis [9] presented the Merge Model Graph (MeMoG) which is another variation of the AutoSum-mENG based on n-gram graphs. This variation calculates the merged graph of all the reference summaries. Then, it computes the similarity de-gree between the candidate summary graph and the merged graph of the reference summaries. In a recent work, [10] developed the SIMetrix measurement; it assesses a candidate summary by comparing it with the source documents in-stead of reference summaries. The SIMetrix is a full automatic metric which does not depend on reference summaries. [10] computed ten mea-sures of similarity based on the comparison be-tween the source documents and the candidate summary. Among the used similarity measures we cite the cosine similarity, the divergence of Jensen-Shannon, the divergence of Kull-back-Leibler, etc. In a more recent work, [11] developed the SERA (Summarization Evalua-tion by Relevance Analysis) metric, which is designed to evaluate scientific articles. This metric relies on the relevant content shared by a candidate summary and reference summa-ries. [11] used an information-retrieval-based method which treats summaries as search que-ries and then measured the overlaps of the re-trieved results. A larger number of overlaps be-tween the candidate summary and the reference summary indicates that the candidate summary has a higher content quality.
class of features for each linguistic quality as-pect. Next, for each aspect, they built a model from each class of features. Finally, they built a meta-ranker for each aspect by combining the predicted scores from each model related to this aspect. Also, [3] evaluated summaries by constructing predictive models for overall re-sponsiveness, PYRAMID and linguistic quality using a combination of content scores based on bi-grams and others related to linguistic quality. To build the predictive model, [3] tested three regression methods, namely canonical correla-tion, the Robust Least Squares, and the Non -Negative Least Squares. On the other hand, the CREMER metric [17] combined a content met-ric named TESLA-S [17] and a linguistic qual-ity metric called ''DICOMER'' [17] to predict overall responsiveness. Some works have tried to predict overall responsiveness scores using the combination of content scores and linguistic quality features, but no one has combined them to predict linguistic quality score.
3. Our Method
Our method presents an alternative view of the problem of text summary evaluation through the use of a machine learning technique. It is based on the combination of several content scores and linguistic quality features to predict manual scores and more precisely PYRAMID scores and linguistic quality scores. The choice of the prediction of these two scores is stimu-lated by their reputation and their availability in the manual evaluations of the DUC and TAC evaluation conferences. In fact, PYRAMID is a manual score that reflects the coverage of important ideas present in the reference sum-maries by comparing the extracted SCUs from the candidate summary and the reference sum-maries. But, human judges cannot detect SCUs in a candidate summary with a poor linguistic quality; this is why we should include some lin-guistic features in the model that will predict PYRAMID scores. In addition, many studies ([2], [3], etc.) have proved that the combination of automatic content scores improves the cor-relation between the PYRAMID scores and the combination of automatic content scores.
For the linguistic quality, we are interested in providing a score that takes into account five linguistic aspects (namely structure and
coher-ence, non-redundancy, focus, referential clarity and grammaticality) like the manual linguis-tic quality score used by the TAC conference which includes all five aspects. So, it is impos-sible to handle linguistic quality evaluation us-ing one sus-ingle score without combinus-ing several features that cover all linguistic quality aspects. In the features already used we have included some content features based on the overlap between extended textual units (bi-grams, tri-grams, etc.). In fact, those extended units can capture some grammatical and structural phe-nomena, whether the comparison is made with model summaries or source documents.
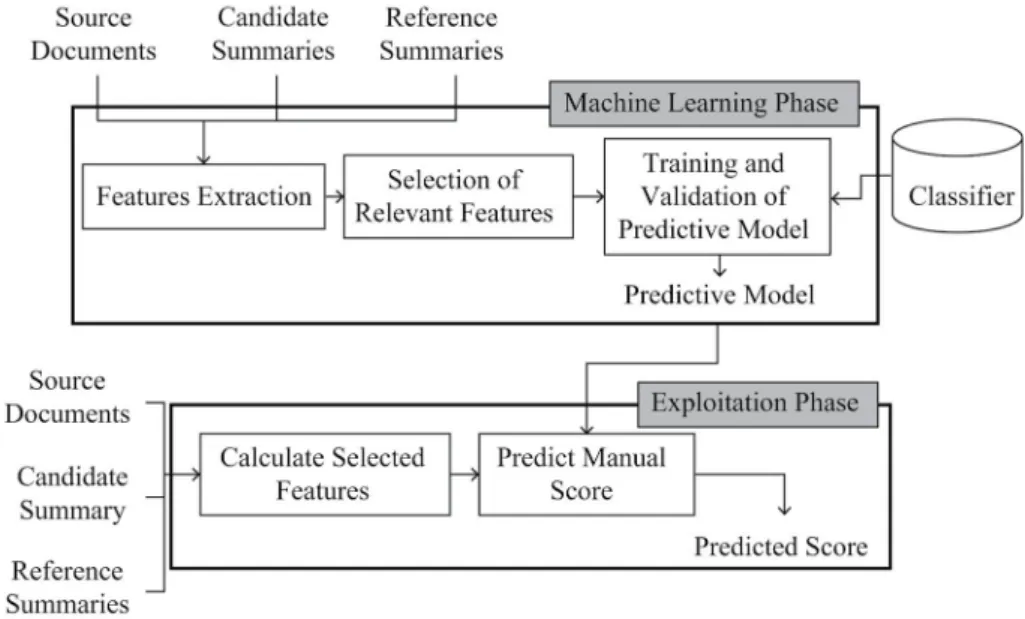
Consequently, to predict the content and the linguistic quality using a machine learning technique, we should go through the different phases presented in Figure 1.
As shown in Figure 1, the first phase of our method is the machine learning phase where we build the predictive model for each manual score. This phase consists of three steps: feature extraction, selection of relevant features and training and validation of the predictive model. All of those three steps will be described sub-sequently. The second phase is the exploitation phase where we will apply the model to pre-dict a manual score (PYRAMID or linguistic quality) of the new candidate summary (unseen summary).
The use of our method will increase the cor-relation of the predicted scores with the manual scores. This is because the use of a single score or feature could not take into account all the as-pects of content or of linguistic quality score, while our predictive model will consider more aspects that are present in the manual scores. In the next section, we will detail the machine learning phase, which represents the basic sub-strate of the proposed method.
4. Machine Learning Phase
4.1. Feature Extraction
This first step computes all the feature val-ues related to each candidate summary. In this step, we need several natural language process-ing tools such as the Stanford parser [18], the
Stanford Tagger [19], the Stanford NER [20], the Stanford Coref [21], the srilm toolkit [22], etc., to calculate some linguistic quality fea-tures. However, the content features are based on many content metrics. Those content fea-tures require the use of reference summaries or source documents.
The goal of this phase is to transform the text summary input into a -feature matrix. In this phase, we use some new features and other features that are successfully used either in the assessment of readability or of content. For the linguistic features that have been used, we have tried to cover many linguistic aspects (e.g. grammaticality, non-redundancy, Structure and coherence, etc). In this work, we have included all the classes of features that were used in [23] and [24] (traditional readability measures, shal-low features, part of speech features, etc.) and we have added some new features to existent classes and also other new classes of features. In the following subsections we will present the features related to each class.
4.1.1. ROUGE/BE Scores
We used ROUGE-N (R-N) scores based on the overlap of n-grams between the candidate summary and the reference summaries (such as ROUGE-1, ROUGE-2, ROUGE-3 and ROUGE-4). In addition to that, we included
ROUGE-SU4 (R-SU4) based on skip-bigrams and uni-grams, ROUGE-L (R-L) based on the Longest Common Subsequence of n-grams and ROUGE-W (R-W) based on the Weighted Longest Common Subsequence of n-grams. Fi-nally, we used a BE score based on the semantic units called BE (Basic Elements).
4.1.2. AutoSummENG Scores
We determined four variants of AutoSum-mENG. The first is AutoSummENG_W123 where we calculated AutoSummENG which includes n-grams of words of a length vary-ing between [1,...,2] and which has a window of size 3 between n-grams. The second is Au-toSummENG_W333 which uses tri-grams of words and which has a window of size 3 be-tween n-grams. The third is AutoSummENG_ C123 using n-grams of characters of a length between [1,...,2] and having a window of size 3. The fourth is AutoSummENG_W253 using
n-grams of words of length between [2,...,5] and having a window of size 3.
4.1.3. Adapted ROUGE Scores
We maintained the adapted ROUGE scores that have been introduced in [24]: R-NAd which
class of features for each linguistic quality as-pect. Next, for each aspect, they built a model from each class of features. Finally, they built a meta-ranker for each aspect by combining the predicted scores from each model related to this aspect. Also, [3] evaluated summaries by constructing predictive models for overall re-sponsiveness, PYRAMID and linguistic quality using a combination of content scores based on bi-grams and others related to linguistic quality. To build the predictive model, [3] tested three regression methods, namely canonical correla-tion, the Robust Least Squares, and the Non -Negative Least Squares. On the other hand, the CREMER metric [17] combined a content met-ric named TESLA-S [17] and a linguistic qual-ity metric called ''DICOMER'' [17] to predict overall responsiveness. Some works have tried to predict overall responsiveness scores using the combination of content scores and linguistic quality features, but no one has combined them to predict linguistic quality score.
3. Our Method
Our method presents an alternative view of the problem of text summary evaluation through the use of a machine learning technique. It is based on the combination of several content scores and linguistic quality features to predict manual scores and more precisely PYRAMID scores and linguistic quality scores. The choice of the prediction of these two scores is stimu-lated by their reputation and their availability in the manual evaluations of the DUC and TAC evaluation conferences. In fact, PYRAMID is a manual score that reflects the coverage of important ideas present in the reference sum-maries by comparing the extracted SCUs from the candidate summary and the reference sum-maries. But, human judges cannot detect SCUs in a candidate summary with a poor linguistic quality; this is why we should include some lin-guistic features in the model that will predict PYRAMID scores. In addition, many studies ([2], [3], etc.) have proved that the combination of automatic content scores improves the cor-relation between the PYRAMID scores and the combination of automatic content scores.
For the linguistic quality, we are interested in providing a score that takes into account five linguistic aspects (namely structure and
coher-ence, non-redundancy, focus, referential clarity and grammaticality) like the manual linguis-tic quality score used by the TAC conference which includes all five aspects. So, it is impos-sible to handle linguistic quality evaluation us-ing one sus-ingle score without combinus-ing several features that cover all linguistic quality aspects. In the features already used we have included some content features based on the overlap between extended textual units (bi-grams, tri-grams, etc.). In fact, those extended units can capture some grammatical and structural phe-nomena, whether the comparison is made with model summaries or source documents.
Consequently, to predict the content and the linguistic quality using a machine learning technique, we should go through the different phases presented in Figure 1.
As shown in Figure 1, the first phase of our method is the machine learning phase where we build the predictive model for each manual score. This phase consists of three steps: feature extraction, selection of relevant features and training and validation of the predictive model. All of those three steps will be described sub-sequently. The second phase is the exploitation phase where we will apply the model to pre-dict a manual score (PYRAMID or linguistic quality) of the new candidate summary (unseen summary).
The use of our method will increase the cor-relation of the predicted scores with the manual scores. This is because the use of a single score or feature could not take into account all the as-pects of content or of linguistic quality score, while our predictive model will consider more aspects that are present in the manual scores. In the next section, we will detail the machine learning phase, which represents the basic sub-strate of the proposed method.
4. Machine Learning Phase
4.1. Feature Extraction
This first step computes all the feature val-ues related to each candidate summary. In this step, we need several natural language process-ing tools such as the Stanford parser [18], the
Stanford Tagger [19], the Stanford NER [20], the Stanford Coref [21], the srilm toolkit [22], etc., to calculate some linguistic quality fea-tures. However, the content features are based on many content metrics. Those content fea-tures require the use of reference summaries or source documents.
The goal of this phase is to transform the text summary input into a -feature matrix. In this phase, we use some new features and other features that are successfully used either in the assessment of readability or of content. For the linguistic features that have been used, we have tried to cover many linguistic aspects (e.g. grammaticality, non-redundancy, Structure and coherence, etc). In this work, we have included all the classes of features that were used in [23] and [24] (traditional readability measures, shal-low features, part of speech features, etc.) and we have added some new features to existent classes and also other new classes of features. In the following subsections we will present the features related to each class.
4.1.1. ROUGE/BE Scores
We used ROUGE-N (R-N) scores based on the overlap of n-grams between the candidate summary and the reference summaries (such as ROUGE-1, ROUGE-2, ROUGE-3 and ROUGE-4). In addition to that, we included
ROUGE-SU4 (R-SU4) based on skip-bigrams and uni-grams, ROUGE-L (R-L) based on the Longest Common Subsequence of n-grams and ROUGE-W (R-W) based on the Weighted Longest Common Subsequence of n-grams. Fi-nally, we used a BE score based on the semantic units called BE (Basic Elements).
4.1.2. AutoSummENG Scores
We determined four variants of AutoSum-mENG. The first is AutoSummENG_W123 where we calculated AutoSummENG which includes n-grams of words of a length vary-ing between [1,...,2] and which has a window of size 3 between n-grams. The second is Au-toSummENG_W333 which uses tri-grams of words and which has a window of size 3 be-tween n-grams. The third is AutoSummENG_ C123 using n-grams of characters of a length between [1,...,2] and having a window of size 3. The fourth is AutoSummENG_W253 using
n-grams of words of length between [2,...,5] and having a window of size 3.
4.1.3. Adapted ROUGE Scores
We maintained the adapted ROUGE scores that have been introduced in [24]: R-NAd which
R-LAd which represents a ROUGE adapted
score based on the Longest Common Subse-quence of n-grams, R-S4Ad which designs a
ROUGE adapted score based on skip-bigrams, R-WAd which designs a ROUGE adapted score
based on the Weighted Longest Common Sub-sequence of n-grams.
4.1.4. SIMetrix Score Features
The SIMetrix metric involves different simi-larity measures such as cosine simisimi-larity, Kull-back-Leibler (KL) divergence, Jensen-Shannon divergence, etc., for comparing the content of the source documents and that of the candidate summary. Because of the variation in the ways of similarity estimation between the different variants of SIMetrix [10], we used all the ten scores calculated by SIMetrix. Those scores are: the Kullback-Leibler divergence [25] be-tween the source documents and the candidate summary (KLInputSummary); the KL diver-gence between the candidate summary and the source documents (KLSummaryInput); the unsmoothed version of Jensen-Shannon di-vergence [26] between the source documents and the candidate summary (unsmoothedJSD) and the smoothed one (smoothedJSD); the co-sine similarity between the source documents and the candidate summary (cosineAllWords); the percentage of the descriptive words of the source documents that appear in the candidate summary (percentTopicTokens); the percent-age of the candidate summary composed of the most descriptive words from the source documents (fractionTopicWords); the cosine similarity between the candidate summary and the most descriptive words in the source doc-uments (topicWordOverlap); the probability of uni-grams of the summary given in the source documents (unigramProb); the multinomial probability of the summary given in the source documents (multinomialProb).
4.1.5. Traditional Readability Measure Features
The class of traditional readability measures we used includes six readability measures: Fle-sch-Kincaid Index (Ind.), Flesch Reading Ease, Automated Readability Index, Gunning Fog In-dex, Dale-Chall grade and SMOG.
4.1.6. Shallow Features
For shallow features, we adopted multiple fea-tures used by [23] and [24]: the average number of syllables per word (AvgSyllW), the average number of characters per word (AvgCharW), the average number of words per sentence (AvgWSent), the ratio between the candidate summary's size and the maximum size allowed by the TAC campaign (RatioW_MaxW), the logarithm of the number of sentences (logS), the logarithm of the number of characters (logC), the logarithm of the number of words ( logW). In addition, we added a set of features based on lexical diversity which counts how many differ-ent words are used in a text. In fact, a high score of these features can ensure that the sentences of a summary are less repetitive and have a rich vocabulary. Those features are: the number of distinct words, the density of distinct words, the root of the density of distinct words, the correct density of distinct words (DensCorrDistWord), the bi-logarithmic density of distinct words, the Uber Index (Uber_Index). In addition, we determined for each candidate summary two features based on paragraph length: the average number of sentences per paragraph, the average number of words per paragraph. In fact, a short paragraph can be more easily understood and can have fewer problems of co-referencing and of liaison between the ideas of its sentences. Moreover, we calculated the density of stop words (DensStopW).
4.1.7. Language Modeling Features
For language modeling features we calculated the nine following features for each candidate summary: the Log probability of uni-grams (logProbUnigram), the measure of perplexity for unigrams normalized by the total number of uni-grams (pplUnigram), the measure of per-plexity for uni-grams with exclusion of the sen-tence end tags (ppl1Unigram), the Log probabil-ity of bi-grams (logProbBigram), the measure of perplexity for bi-grams normalized by the total number of bi-grams (pplBigram), the mea-sure of perplexity for bigrams with exclusion of the sentence end tags (ppl1Bigram), the Log probability of tri-grams (logProbTrigram), the measure of perplexity for tri-grams normalized by the total number of tri-grams (pplTrigram),
the measure of perplexity for tri-grams with ex-clusion of the sentence end tags (ppl1Trigram).
4.1.8. Part-of-Speech Features
Our Part-of-speech (POS) features are based on categorical word frequencies. We calculated the number (Nb), the average (Avg) and the density (Dens) of each of the following functional and content words: determinants (DET), coordinat-ing conjunctions (CC), prepositions and subor-dinating conjunctions (PSC), personal pronouns (PRP), nouns (N), verbs (V), adjectives (ADJ), adverbs (ADV). We added some part-of-speech features which are related to nouns and verbs which are the most important and essential part of content words for a text summary. This is be-cause a summary must contain fewer descrip-tion details (i.e., fewer adjectives and adverbs) and more important actions expressed by nouns and verbs. The added features which are cal-culated for a candidate summary are: the den-sity of verbs and nouns, the ratio between the number of nouns and the number of verbs, the average number of nouns and verbs, the ratio between the number of nouns and verbs and the number of adjectives and adverbs, the ratio be-tween the number of each type of verb (infini-tive, impera(infini-tive, participle, model) and the total number of verbs. Finally, we added the num-ber, the average and the density of lexical word (LexW) (nouns, verbs, adjectives and adverbs).
4.1.9. Syntactic Features
For the syntactic features, we adopted a range of parse tree based features used by [23] and [24]. Those features include the number and the average number of: noun phrases (NP), verb phrases (VP), prepositional phrases (PP), clauses (SBAR). Furthermore, we maintained the average height of the parse tree and the av-erage number of dependency relations.
4.1.10. Named Entity Based Features
For each candidate summary, we implemented the following three named-entity features used in [23] and [24]: the number of named entities (Ent), the density of named entities and the av-erage of named entities. In addition, we counted
the number of distinct entities, the density of distinct entities, the average number of distinct entities and the entities' diversity. The latter fea-ture is equal to the ratio between the number of distinct entities and the total number of entities.
4.1.11. Coherence Features
We will focus first on local coherence. In fact, local coherence gauges the continuity of ideas between adjacent sentences. Therefore, we es-timated this continuity using several similar-ity and distance measures. For each candidate summary, we computed the average similarity or distance between adjacent sentences using: the Levenshtein distance, the cosine similarity, the Jaccard distance, the divergence of Jen-sen-Shannon, the Kullback-Leibler divergence, the Pearson correlation, the Dice index and the overlap coefficient.
Second we evaluated the coherence of the text summary using features based on discourse relations. In fact, a coherent text can be repre-sented as a combination of text units connected by discourse relations. Discourse relations such as cause, contrast or elaboration are important to understand the relation of each sentence in the text to the others; this forms a coherent text. In our work, we calculated for each candidate summary: the number of discourse relations (NbDisc), the average number of discourse re-lations per sentence (AvgDisc) and the density of discourse relations (DensDisc).
4.1.12. Co-Reference Features
and vice versa (RatWithoutAntWithAnt), the number of pronouns without antecedent to the total number of words (RatWithoutAntNbW) and the number of pronouns without antecedent to the total number of pronouns (RatWithou-tAntNbPron).
4.1.13. Redundancy Features
To calculate these features, we compared each sentence in the candidate summary with the other sentences by using a lexical similar-ity measure. Four similarsimilar-ity measures were adopted, namely the cosine similarity, the Dice coefficient, the overlap coefficient and the Jac-card index. For each similarity measure, we determined the maximum redundancy (e.g. the average of maximum similarities between each sentence and other sentences in the summary) and the average redundancy (average similarity between sentences) between sentences.
4.1.14. Specific-General Sentence Features
In fact, a good summary requires generaliza-tions. Therefore, it should contain the max-imum number of general sentences. For this reason, we decided to include features that tell us about the types of sentences used in a candi-date summary. To calculate those features, we used the speciteller tool [27] which gives for
each sentence a score (specific-general score)
between 0 and 1 where 0 is the score for the most general sentences and 1 is the score for
the most specific ones. For each summary, we
determined the ratio between the sum of the
specific-general scores of all sentences and the
number of sentences in a summary (RatSpec-GenScoreNbSent). In addition, we identified the ratio between the number of sentences with a score > 0.5 and the number of sentences with a score < 0.5 (RatGenSentSpecSent).
4.2. Selection of Relevant Features
For each task and for each manual score (PYR-AMID, linguistic quality), this step receives as input a matrix X of features and a vector V of values of one of the manual scores where xij is
the value of the jth feature for the ith candidate
summary, i is between 1,...,n and j is between
1,...,m. It should be noted that the candidate summaries in the learning phase can be system summaries or reference summaries. Indeed, in order to increase the size of the training cor-pus, reference summaries were included. This step allows us to select the most relevant fea-tures that must be kept for the training step and to remove unneeded, irrelevant and redundant features which may decrease the performance of the predictive model. So, usually, the use of all possible features does not give the best predictive model because of the presence of redundant and irrelevant features in the model. In addition, the absence of a feature selection step may, on the one hand, introduce bias into the built model which can lead to over-fitting, and on the other hand, induce a greater compu-tational cost. In general, the selection of rele-vant features is as important as the choice of the learning algorithm. Similarly, it is important to say that the choice of the selection algorithm depends on the type of machine learning algo-rithm to use (regression or classification). Several selection algorithms have been tested in the case of predicting the content score and the linguistic quality score. To select the rele-vant features for the content score model, we used a wrapper method that has given the best predictive model. This method assesses subsets of features according to their usefulness to a given classifier. According to [28], the Wrap-per subset evaluator [29] selection methods
are generally considered better than the filter -ing ones. However, to select relevant features for the linguistic quality model, we used the GainRatioAttributeEval or OneRAttributeEval method, which has given the most appropriate features to build the predictive model. The two methods represent two filter methods which se-lect subsets of features as a pre-processing step, independently of the classifier chosen in the training phase.
4.3. Training and Validation of the Predictive Model
The last step in the machine learning phase re-ceives as input a matrix of size (n, k) where k is the number of features considered pertinent by the previous step and a vector containing the manual scores. This step helps to build and val-idate the predictive models of the two manual scores: the PYRAMID score and the linguistic
quality score. The PYRAMID score represents a continuous value between 0 and 1. For this reason, we built the predictive model of this score using a linear regression technique. To build the best predictive model, we tested many linear regression algorithms implemented by the Weka environment [30] such as Gaussian-Processes, LinearRegression, LeastMedSq, RandomForest, etc. The linguistic quality score represents a discrete number between 1 and 5; this is why we chose a supervised classification to predict the linguistic quality of a summary. To make the predictive model of the linguis-tic quality score, the MultilayerPerceptron, the NeuralNetwork, the SMO, the LWL, or the Dl-4jMlpClassifier (a Deep learning classifier) can be used.
Moreover, we tried to produce models for con-tent and for linguistic quality scores by using ensemble learning which usually promotes the production of more accurate solutions than a single learning algorithm. In our experiment we used three ensemble learning algorithms which are implemented in the Weka environment: Bagging [31], Vote [32], AdditiveRegression and Stacking [33].
In our method, after testing the algorithms used for each type of score, we adopt the one that produces the best predictive model. The valida-tion of each model is performed by a cross-val-idation method with 10 folds. We divide the dataset into 10 folds and we repeat the experi-ment 10 times. Each time, we preserve one fold for the test and the rest for the training of the model. Finally, for the linguistic quality, we re-port the accuracy (it represents the prore-portion of instances that were classified correctly) and the kappa coefficient calculated from the 10 times. For the content score, we determine the Pearson correlation [34] and the Root Mean Square Er-ror RMSE. The RMSE can be interpreted as the average deviation of the manual score between the predicted and actual values. This measure penalizes models which make big prediction errors compared to the manual scores (the read-ability score or the PYRAMID score).
5. Experimentation
We tested our method for summary level evalu-ation in initial summary task (Task A) [35] and update summary task (Task B) [35] by trying
to predict PYRAMID and linguistic quality scores. On the system level, for each task, we will just average the predicted scores of all the candidate summaries of each system.
5.1. Data Set
The Data Set used in the study is taken from the updated summary task of the TAC 2008 [35] conference. This data set consists of the source documents, the manual summaries (ref-erence summaries) and the system summaries. This task consists of summarizing a set of doc-uments (A) which deals with a particular event and then of summarizing a set (B) which ad-dresses the evolution of the same event and considers the knowledge of the set (A). This corpus includes 5568 system summaries that are automatically generated by the 58 partici-pating systems where each system produced 96 summaries: 48 summaries (48 is the number of collections of source documents) for each set of documents (A and B). The corpus also includes 384 (96*4) reference summaries (4 reference summaries for each collection in a set of doc-uments). Thus, each system summary can be assessed by comparing the four reference sum-maries. Similarly, a reference summary can be evaluated by comparing it with the other three model summaries. In our experiments in sum-mary level evaluation, each model is produced using 2976 candidate summaries (coming from all collections) where 2784 are system summa-ries and 192 are reference summasumma-ries.
5.2. Content Score Evaluation
5.2.1. Summary Level
syntactic features which can be indicators of the
fluency and the grammaticality of a summary.
Now, we give in Table 2 the list of selected fea-tures (feat.) used in the update summary task. From this table, we notice that in the update summary task too, multiple content scores (sc.) are selected as relevant features. In addition, many linguistic quality features are selected as
relevant ones. Besides, the importance and the necessity of including linguistic quality features is clearly shown through the use of features related to diverse aspects of linguistic quality like referential clarity, non-redundancy, local coherence, grammaticality (i.e. AvgNPSent, AvgPPSent, RatioWordMaxWord which can be an indicator of the truncation of the last sen-tence in the summary).
We examine the usefulness of the selected fea-tures in the prediction of the content score. We use the following single classifiers: Gaussian-Processes, LinearRegression, LeastMedSq, MultilayerPerceptron and RandomForest from the Weka environment to train the model. Then, we validate the model using a 10-fold cross-val-idation. The correlation and the RMSE gener-ated by each classifier are presented in Table 3. This table shows the performance of the se-lected features in building models using several single and ensemble classifiers in the initial and update summary tasks. In the initial summary task (Task A), the results show that the model built from the ensemble learning classifier Stacking produced the best correlation (0.7906) and the lowest RMSE (0.1133).
In addition, the results obtained through all the ensemble learning classifiers were, in general, better than single classifiers. The difference
be-tween the best and the least performing classi-fier in terms of correlation is equal to 0.0958.
This presents a significant difference for the
task of initial summary evaluation.
On the update summary level, Table 3 indicates that SMOReg is the best single classifier in pre-dicting the PYRAMID score with a correlation of 0.8275 and an RMSE of 0.1072. The best ensemble learning classifier is Vote which pro-vides a model having a correlation of 0.8342 and an RMSE of 0.1061. Another notable ob-servation is that the correlation in the update summary task is more important than the one in the initial summary task. Furthermore, the RMSE has less important values in the update summary task than in the initial summary task. This indicates that the deviation between the predicted and the actual values is less important in the update summary task than in the initial summary task.
After obtaining the best performing classifier for building the predictive model of the PYR-AMID score, on both tasks, we move on to the comparison between the performance of the best model obtained by combining selected features (feat.) and the baseline metrics such as ROUGE-2, ROUGE-SU4 and BE that were adopted by the TAC conference as baseline met-rics, the model combining content scores (sc.) and the model combining all features. Table 4 details the different correlations and RMSEs of baseline metrics and our experiments. It should be noted that, in the initial summary task, the models of our experiments are built using the Stacking ensemble learning classifier. In
addi-tion, it should be noted that in the update sum-mary task, the models of our experiments are made using the Vote ensemble learning which integrate two classifiers RandomForest and SMOReg. From Table 4 and in both tasks, we see the gap between the baseline metrics and our experiments, regardless of whether we used the selected features, just content scores, or all features. Moreover, we notice that the inclusion of linguistic quality features in the best model produced improves the performance of this model compared to the model containing just content scores.
In addition, we note that the inclusion of all fea-tures in one model does not give the best pre-dictive model which justified the selection of relevant features.
5.2.2. System Level
In system level evaluation, we estimate the qual-ity of a summarization system; in other words, the system assessment is done by taking into account the quality of all the summaries that are produced by this system. In this article, we tried to calculate the quality of a system by determin-ing the average of the predicted scores for the summaries produced by the same system. The formula for calculating the performance of the content or the linguistic quality of a summariza-tion system is as follows:
1 i
N
sum i
system
Score
Score =
∑
= N(1)
where N is the number of summaries produced by a definite system and Scoresumi is the
pre-dicted score of the summary i. To evaluate this method of calculating the content score for a system, we study the correlation of Pearson (P), Spearman (S) [36] and Kendall (K) [37] with the PYRAMID score and the Scoresys-tem score. Table 5 details the different correla-tions between the PYRAMID score and the
Scoresystem score or the baseline scores.
Table 5 shows how good each baseline is when the Scoresystem is compared to the PYRAMID
score. As can be seen in this table, the best re-sult is obtained by our Scoresystem. It has the best
correlation with the PYRAMID score in both Table 1. List of selected features to predict content score
in summary level for initial summary task.
Features Initial Summary
Content features
R-1, R-2, R-3, R-4, R-SU4, R-W, AutoSummENG_W333,
AutoSummENG_W123, AutoSummENG_W253, KLInputSummary,
KLSummaryInput, unsmoothedJSD, smoothedJSD, cosineAllWords,
percentTopicTokens, fractionTopicWords, topicWordOverlap, unigramProb,
multinomialProb
Linguistic quality features
NB_DET, NB_PSC, DENS_DET, DENS_N, DENS_V_N, Uber_Index, AvgSBARSent, NB_PP, NB_SBAR, AVG_Height_ParseTree,
AVG_NB_dep_sent, pplUnigram, pplBigram, NB_Ent, AvgKLdiv, AntPrevSent, RatWithoutAntNbWord, RedondAVGdice
Table 2. List of selected features to predict content score on summary level for update summary.
Features Update Summary
Content features
R-1, R-2, R-4, R-SU4, R-L, R-W, R-4Ad, R-5Ad, R-S4Ad, BE, AutoSummeng_C333, AutoSummENG_W123, autosummeng_W253,
KLInputSummary, unsmoothedJSD, smoothedJSD, cosineAllWords,
percentTopicTokens, topicWordOverlap, unigramProb, multinomialProb
Linguistic quality features
NNB_DET, NB_CC, AVG_DET, AVG_SC, AVG_N, DENS_PSC, DENS_PRP, Ratio_ImpV_V, AVG_LexW, fleschK, GunFog, DaleChall, AvgSyllW, AvgCharW, AvgWord_Sent, AVG_Sent_Parag, DensCorrDistWord, logS, logW, AvgNPSent, Avg_PPSent, NB_PP, log-ProbUnigram, logProbBigram,
ppl1Bigram, logProbTrigram, pplTrigram, pl1Trigram, Nb_Ent, AVG_Ent_Sent, AVGLevenDist, AVGJacSim,
AVGJSDiver, AntPrevSent, AntSameSent, AntOtherSent, NB_Disc, AVG_Disc
Table 3. Pearson correlation with PYRAMID and RMSE (between parentheses) for both tasks
using the selected features.
Classifiers Task A Task B
Single classifiers
GaussianProcesses 0.7690(0.1185) 0.8203(0.1097) LinearRegression 0.7530(0.1218) 0.7648(0.1228) LeastMedSq 0.7496(0.1226) 0.7424(0.1295) SMOReg 0.7661(0.1201) 0.8275(0.1072) MultilayerPerceptron 0.6948(0.1361) 0.7047(0.1473) RandomForest 0.7766(0.1173) 0.8196(0.1102)
Ensemble learning classifiers
Additive regression 0.7881(0.1142) 0.8300(0.1068) Vote 0.7904(0.1135) 0.8342(0.1061)
Bagging 0.7723(0.1180) 0.8191(0.1101) Stacking 0.7906(0.1133) 0.8337(0.1052)
Table 4. Pearson correlation with PYRAMID score and RMSE (between parentheses) in both
tasks of summary level evaluation.
Scores Task A Task B
Baselines
ROUGE-2 0.5990(0.1482) 0.5825(0.1549)
ROUGE-SU4 0.5090(0.1399) 0.6200(0.1495)
BE 0.4493(0.1653) 0.5534(0.1588)
Our experimentations
Combining content sc. 0.7763(0.1167) 0.8165(0.1248)
Combining selected feat. 0.7906(0.1133) 0.8342(0.1061)