Predicting Number of Zombies
in DDoS Attacks Using Pace
Regression Model
B. B. Gupta
1University of New Brunswick, Canada
2Department of Electronics and Computer Engineering, Indian Institute of Technology Roorkee, India
A DDoS attacker attempts to disrupt a target, by flooding it with illegitimate packets which are generated from a large number of zombies, usurping its bandwidth and overtaxing it to prevent legitimate inquiries from getting through. This paper reports the evaluation results of proposed approach that is used to predict number of zombies using Pace Regression Model. A relationship is established between number of zombies and observed deviation in sample entropy. Various statistical perfor-mance measures, such as R2, CC, SSE, MSE, RMSE,
NMSE,η,MAEare used to measure the performance of the regression model. Network topologies similar to Inter-net used for simulation are generated using Transit-Stub model of GT-ITM topology generator. NS-2 network simulator on Linux platform is used as simulation test bed for launching DDoS attacks with varied number of zombies. The simulation results are promising as we are able to predict number of zombies efficiently using Pace Regression Model with considerably less error rate.
Keywords: DDoS attack, intrusion detection, pace re-gression, zombies, entropy
1. Introduction
The Internet has become a popular medium of commercial activity and this has raised the risks, both, for attackers and security person-nel. DDoS attacks compromise availability of the information system through various means
[1,2]. One of the major challenges in defend-ing against DDoS attacks is to accurately detect their occurrences in the first place. Anomaly based DDoS detection systems construct pro-file of the traffic normally seen in the network, and identify anomalies whenever traffic deviate from normal profile beyond a threshold[3]. This extension of deviation is normally not utilized.
We use Pace regression[4]based approach that utilize this extension of deviation from detec-tion threshold, to predict number of zombies. A real time estimation of the number of zom-bies in DDoS scenario is helpful to suppress the effect of attack by choosing predicted number of most suspicious attack sources for either fil-tering or rate limiting. We have assumed that zombies have not spoof header information of out going packets. Moore et. al[5]have already made a similar kind of attempt, in which they used backscatter analysis to estimate number of spoofed addresses involved in DDoS attack. This is an offline analysis based on unsolicited responses.
Our objective is to find the relationship between number of zombies involved in a flooding DDoS attack and deviation in sample entropy. In order to predict number of zombies, Pace Regression Model is used. To measure the performance of the proposed approach, we have calculated various statistical performance measures. In-ternet type topologies used for simulation are generated using Transit-Stub model of GT-ITM topology generator [6]. NS-2 network simula-tor[7]on Linux platform is used as simulation test bed for launching DDoS attacks with varied number of zombies. In our simulation experi-ments, attack traffic rate is fixed to 25 Mbps in total; therefore, the mean attack rate per zombie is varied from 0.25 Mbps to 2.5 Mbps and total zombie machines range between 10 and 100 to generate attack traffic.
Regression Model. Section 3 presents vari-ous statistical performance measures. Detec-tion scheme is described in SecDetec-tion 4. SecDetec-tion 5 describes experimental setup and performance analysis in details. Model development is pre-sented in Section 6. Section 7 contains simula-tion results and discussion. Finally, Secsimula-tion 8 concludes the paper.
2. Pace Regression Model
In its simplest form, regression analysis[8,9] in-volves finding the best straight line relationship to explain how the variation in an outcome vari-able, Y depends on the variation in a predictor variable,X. Hence, regression analysis is a sta-tistical tool for the investigation of relationships between variables. Variables which are used to explain, other variables are called explanatory variables. Variable which is explained is called response variable. A response variable is also called a dependent variable, and an explanatory variable is sometime called an independent vari-able, or a predictor, or regressor. When there is only one explanatory variable, the regression model is called a simple regression, whereas if there are more than one explanatory variable, the regression model is called multiple regres-sion.
Pace regression [4] is a form of linear regres-sion analysis that has shown to outperform other types of linear model-fitting methods, particu-larly when the number of features is large and some of them are mutually dependent. Pace regression includes a form of feature selection, therefore not all features are actually used in the resulting models.
Input and Output: In Pace Regression Model, a relationship is developed between number of zombies Y (output) and observed deviation in sample entropy X as input. Here X is equal to
(Hc−Hn). Our proposed regression based
ap-proach utilizes this deviation in sample entropy
X to predict number of zombies.
3. Statistical Performance Measures
The different statistical parameters are adjusted during calibration to get the best statistical agree-ment between observed and simulated variables.
For this purpose, various performance mea-sures, such as Coefficient of Determination(R2), Coefficient of Correlation(CC), Standard Error of Estimate(SSE), Mean Square Error(MSE), Root Mean Square Error(RMSE), Normalized Mean Square Error (NMSE), Nash–Sutcliffe Efficiency Index(η)and Mean Absolute Error
(MAE)are used to measure the performance of the proposed regression model. These measures are defined below.
i) Coefficient of Determination(R2):
Coefficient of determination(R2) is a de-scriptive measure of the strength of the re-gression relationship, a measure how well the regression line fit to the data. R2is the proportion of variance in dependent vari-able which can be predicted from indepen-dent variable.
R2=
N
i=1(Yo− ¯
Yo)(Yc−Y¯c)
2
N
i=1(Yo− ¯
Yo)2·N i=1(Yc−
¯
Yc)2
(1)
ii) Coefficient of Correlation(CC):
The Coefficient of Correlation(CC)can be defined as:
CC =
N i=1(
Yo−Y¯o)(Yc−Y¯c)
N
i=1(
Yo−Y¯o)2· N i=1(
Yc−Y¯c)2 1/2
(2) iii) Sum of Squared Errors(SSE):
The Sum of Squared Errors (SSE)can be defined as:
SSE = N
i=1
(Yo−Yc)2 (3)
iv) Mean Square Error(MSE):
The Mean Square Error (MSE) between observed and computed outputs can be de-fined as:
MSE= N i=1(
Yc−Yo)2
v) Root Mean Square Error(RMSE):
The Root Mean Square Error(RMSE) be-tween observed and computed outputs can be defined as:
RMSE=
N i=1(
Yc−Yo)2
N (5)
vi) Normalized Mean Square Error(NMSE): The Normalized Mean Square Error(NMSE)
between observed and computed outputs can be defined as:
NMSE= 1 N
N i=1(
Yc−Yo)2
σ2 obs
(6)
vii) Nash–Sutcliffe Efficiency Index(η): The Nash–Sutcliffe Efficiency Index (η)
can be defined as:
η=1−
N i=1(
Yc−Yo)2 N
i=1(
Yo−Y¯o)2
(7)
viii)Mean Absolute Error(MAE):
Mean Absolute Error (MAE) can be de-fined as follows:
MAE=1− N i=1
|Yc−Yo| N
i=1
|Yo−Y¯o|
(8)
where N represents the number of feature vectors prepared,YoandYcdenote the
ob-served and the simulated values of depen-dent variable respectively,Y¯o and σobs2 are
the mean and the standard deviation of the observed dependent variable respectively.
4. Detection of Attacks
Here, we will discuss proposed detection sys-tem that is part of access router or can belong to separate unit that interacts with access router to detect attack traffic. Entropy [10]based DDoS
scheme is used to construct profile of the traf-fic normally seen in the network, and identify anomalies whenever traffic goes out of profile. A metric that captures the degree of dispersal or concentration of a distribution is sample en-tropy. Sample entropyH(X)is
H(X) =−
N
i=1
pilog2(pi) (9)
wherepiisni/S. Herenirepresent total number
of bytes arrivals for a flow i in {t−Δ,t} and
S= N i=1
ni,i=1,2, . . .N. The value of sample
entropy lies in the range 0−log2N.
To detect the attack, the value ofHc(X)is be-ing calculated in time windowΔcontinuously; whenever there is appreciable deviation from
Hn(X), various types of DDoS attacks are de-tected. Hc(X), andHn(X)give entropy value at the time of detection of attack and entropy value for normal profile respectively.
5. Experimental Setup And Performance Analysis
In this section, we evaluate our proposed scheme using simulations. The simulations are carried out using NS2 network simulator[7]. We show that false positives and false negatives(or var-ious error rates) triggered by our scheme are considerably less. This implies that profiles built are reasonably stable and are able to pre-dict number of zombies correctly.
5.1. Simulation Environment
stub domain contains a customer domain with ten legitimate client machines. So a total of four hundred legitimate client machines are used to generate background traffic. To generate attack traffic, total zombie machines range between 10 and 100. Transit domain four contains the server machine to be attacked by zombie ma-chines. A short scale simulation topology is shown in Figure 1.
Currently, the majority of the DDoS attacks are flooding, so we will consider detection of a wide range of flooding attacks in this section. The le-gitimate clients are TCP agents. The attackers are modeled by UDP agents. A UDP connec-tion is used instead of a TCP one because in a practical attack flow, the attacker would nor-mally never follow the basic rules of TCP, i.e. waiting for ACK packets before the next win-dow of outstanding packets can be sent, etc. The attack traffic rate is fixed to 25 Mbps in to-tal; therefore, the mean attack rate per zombie is varied from 0.25 Mbps to 2.5 Mbps. In our ex-periments, the monitoring time window was set to 200 ms, as the typical domestic Internet RTT is around 100 ms and the average global Internet RTT is 140 ms[11]. Total false positive alarms are minimum with high detection rate using this value of monitoring window. The simulations are repeated and different attack scenarios are compared by varying total number of zombie machines and at fixed attack strengths.
6. Model Development
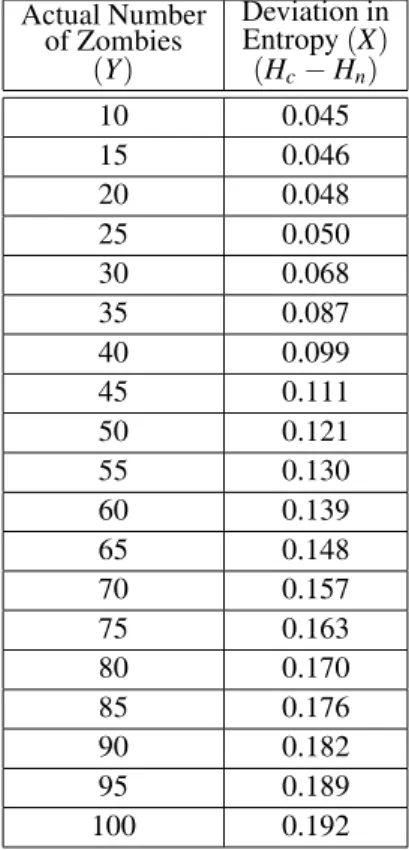
In order to predict number of zombies(Yˆ)from deviation (HC − Hn) in entropy value,
simu-lation experiments are done at the same attack strength 25 Mbps in total and varying number of
Actual Number of Zombies
(Y)
Deviation in Entropy(X) (Hc−Hn)
10 0.045 15 0.046 20 0.048 25 0.050 30 0.068 35 0.087 40 0.099 45 0.111 50 0.121 55 0.130 60 0.139 65 0.148 70 0.157 75 0.163 80 0.170 85 0.176 90 0.182 95 0.189 100 0.192
Table 1.Deviation in entropy with actual number of zombies.
ISP Network Client Machine
Router Zombie Machine
Server
zombies from 10-100 with increment of 5 zom-bies i.e. the mean attack rate per zombie from 0.25 Mbps–2.5 Mbps. Table 1 represents devia-tion in entropy with actual number of zombies. Pace Regression Model is developed using the number of zombies(Y)and deviation(HC−Hn)
in entropy value as discussed in Table 1 to fit the regression equation.
7. Results and Discussion
We have developed Pace Regression Model as discussed in Section 6. Various performance measures are used to check the accuracy of this model.
The number of zombies can be computed and compared with actual number of zombies us-ing proposed regression model. The compar-ison between actual number of zombies and predicted number of zombies using Pace Re-gression Model is depicted in Figure 2.
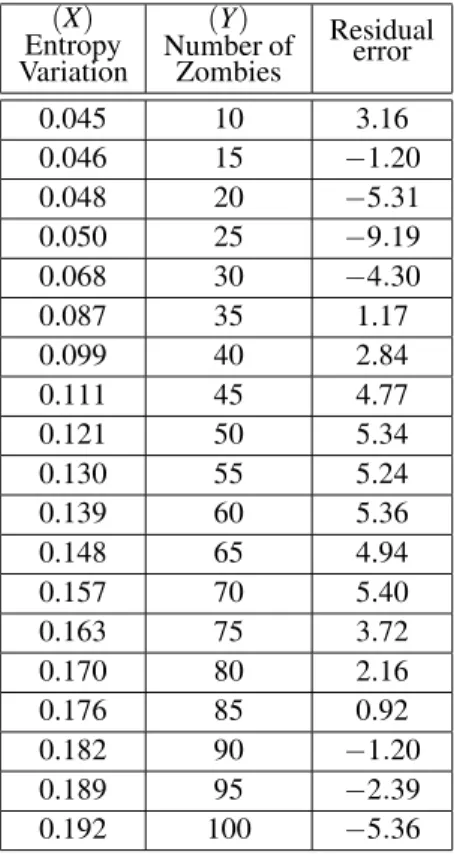
To represent false positive (falsely predicted normal clients as zombies) and false negative
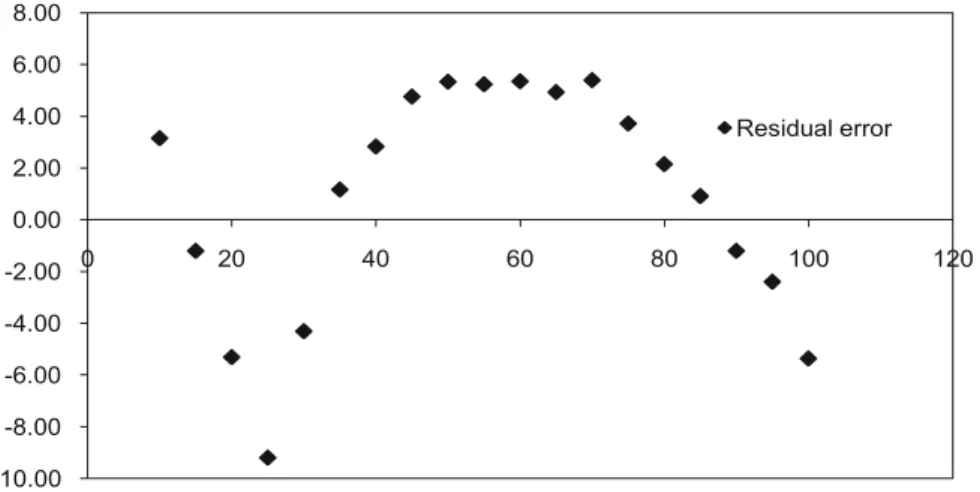
(zombies are identified as normal client), we plot residual error. Positive cycle of residual error curve represents false positive, while neg-ative cycle represents false negneg-ative. Table 2 shows residual error for Pace Regression Model. Figure 3 represents residual error for Pace Re-gression Model.
Table 3 shows values of various performance measures. It can be inferred from Table 3 that
for Pace Regression Model values of R2, CC,
SSE, MSE, RMSE, NMSE, η, MAE are 0.98, 0.99, 368.15, 19.38, 4.40, 0.69, 0.97 and 0.84 respectively. Hence number of zombies pre-dicted by this model is close to the observed number of the zombies.
(X)
Entropy Variation
(Y)
Number of Zombies
Residual error
0.045 10 3.16 0.046 15 −1.20 0.048 20 −5.31 0.050 25 −9.19 0.068 30 −4.30 0.087 35 1.17 0.099 40 2.84 0.111 45 4.77 0.121 50 5.34 0.130 55 5.24 0.139 60 5.36 0.148 65 4.94 0.157 70 5.40 0.163 75 3.72 0.170 80 2.16 0.176 85 0.92 0.182 90 −1.20 0.189 95 −2.39 0.192 100 −5.36
Table 2.Summary of residual error for Pace Regression Model.
0 20 40 60 80 100 120
1 2 3 4 5 6 7 8 9 10 11 12 13 14 15 16 17 18 19
Observed number of Zombies Predicted number of Zombies
-10.00 -8.00 -6.00 -4.00 -2.00 0.00 2.00 4.00 6.00 8.00
0 20 40 60 80 100 120
Residual error
Figure 3.Residual error in Pace Regression Model.
R2 0.98
CC 0.99
SSE 368.15 MSE 19.38
RMSE 4.40
NMSE 0.69
η 0.97
MAE 0.84
Table 3.Values of various performance measures.
8. Conclusion And Future Work
Recently, a number of highly publicized inci-dents of DDoS make clear that it is a com-plex and difficult problem. Several schemes have been proposed on how to defend against these attacks, but they suffer from a range of problems, some of them being impractical and others not being effective against these attacks. This paper investigates suitability of Pace Re-gression Model to predict number of zombies involved in a flooding DDoS attack from de-viation (Hc(X) − Xn(X)) in sample entropy. We have calculated various statistical perfor-mance measures i.e.R2,CC,SSE,MSE,RMSE,
NMSE,η,MAEand residual error and their val-ues are 0.98, 0.99, 368.15, 19.38, 4.40, 0.69, 0.97 and 0.84 respectively. Therefore, total number of predicted zombies using Pace Re-gression Model is very close to observe/actual number of zombies. However, simulation
re-sults are promising as we are able to predict number of zombies efficiently. Experimental study using a real time test bed can strongly validate our claim.
Acknowledgment
The authors gratefully acknowledge the finan-cial support of the Ministry of Human Resource Development (MHRD), Government of India for partial work reported in the paper.
References
[1] B. B. GUPTA, M. MISRA, R. C. JOSHI, An ISP level Solution to Combat DDoS attacks using Combined Statistical Based Approach, inInternational Jour-nal of Information Assurance and Security (JIAS), vol. 3, issue 2, Dynamic Publishers Inc., USA, pp. 102–110, 2008.
[2] B. B. GUPTA, R. C. JOSHI, M. MISRA, Defending against Distributed Denial of Service Attacks: Is-sues and Challenges, inInformation Security Jour-nal: A Global Perspective, vol. 18, number 5, Taylor & Francis Group, UK, pp. 224-247, 2009.
[3] B. B. GUPTA, R. C. JOSHI, M. MISRA, ANN Based Scheme to Predict Number of Zombies involved in a DDoS Attack, International Journal of Network Security (IJNS), vol. 14, no. 1, ISSN 1816-3548, pp. 36–45, 2012.
[5] D. MOORE, C. SHANNON, D. J. BROWN, G. VOELKER, S. SAVAGE, Inferring Internet Denial-of-Service Activity, ACM Transactions on Computer Systems, 24(2), 115–139,(2006).
[6] GT-ITM Traffic Generator Documentation and Tool. Available at:http://www.cc.gatech.edu/fac/ EllenLegura/ graphs.html.
[7] NS Documentation. Available at: http://www.isi.edu/nsnam/ns.
[8] D. V. LINDLEY, (1987) Regression and Correla-tion Analysis, New Palgrave: A Dictionary of Economics, vol. 4, pp. 120–23.
[9] DAVID A. FREEDMAN, Statistical Models: Theory and Practice, Cambridge University Press, 2005.
[10] C. E. SHANNON, A Mathematical Theory of Com-munication,ACM SIGMOBILE Mobile Computing and Communication Review, vol. 5, pp. 3–55, 2001.
[11] B. GIBSON, TCP Limitations on File Transfer Per-formance Hamper the Global Internet,White paper, Sept. 2006. Available at:
http://www.niwotnetworks.com/gbx/ TCPLimitsFastFileTransfer.htm.
Received:June, 2010 Accepted:May, 2012
Contact address: B. B. Gupta University of New Brunswick, Canada e-mail:[email protected]
B. B. GUPTAreceived the Bachelor of Engg. degree in information tech-nology from the Rajasthan University, Jaipur, India. He was a topper in the graduate studies and was awarded with the Institute Fellowship for his excellent performance. He got his PhD degree from Dept. of Elec-tronics and Computer Engg, Indian Institute of Technology Roorkee, India. In 2009, he was selected for the prestigious Canadian Common-wealth Scholarship and awarded with Government of Canada Award. He spent more than 6 months at University of Saskatchewan(UofS), Canada to complete a portion of his research work. Dr. Gupta has published more than 35 research papers in international journals and conferences of high repute. He has visited more than 6 countries to presented his research papers. His biography is selected to be published in the 30th edition of the prestigious Marquis Who’s Who in the World, 2012. He has also served as Technical Program Committee(TPC) mem-ber of more than 15 international conferences worldwide. Dr. Gupta is member of IEEE, SIGCOMM, The Society of Digital Information and Wireless Communications(SDIWC), Internet Society, Institute of Nanotechnology, Life Member, International Association of Engineers