1
Short title:
1
Transposon insertional library
2
3
§
Address for correspondence:
4
Frank Hochholdinger
5
Institute of Crop Science and Resource Conservation (INRES)
6
Crop Functional Genomics (CFG)
7
University of Bonn
8
Friedrich-Ebert-Allee 144
9
53113 Bonn, Germany
10
Tel.: +49 228 73 60334
11
Email: [email protected]
12
13
14
15
BonnMu: a sequence-indexed resource of transposon-induced maize
16
mutations for functional genomics studies
17
Authors:
18
Caroline Marcona,1,*, Lena Altroggeb,1, Yan Naing Wina, Tyll Stöckerb, Jack M.
19
Gardinerc, John L. Portwood IId, Nina Opitza,2, Annika Kortza, Jutta A. Baldaufa,
20
Charles T. Huntere,3, Donald R. McCartye, Karen E. Koche, Heiko Schoofb,*, Frank
21
Hochholdingera,*,§
22
a
INRES, Institute of Crop Science and Resource Conservation, Crop Functional
23
Genomics, University of Bonn, 53113 Bonn, Germany
24
b
INRES, Institute of Crop Science and Resource Conservation, Crop Bioinformatics,
25
University of Bonn, 53115 Bonn, Germany
26
c
Division of Animal Sciences, University of Missouri, Columbia, MO 65211, USA
27
d
USDA-ARS Corn Insects and Crop Genetics Research Unit, Ames, IA 50011, USA
28
e
Horticultural Sciences Department, Plant Molecular and Cellular Biology Program,
29
Genetics Institute, University of Florida, Gainesville, Florida, USA
30
Author contributions:
31
C.M. and F.H. conceived the research. C.M., Y.N.W., N.O., and A.K. generated the
32
Mu-seq libraries. C.M. and Y.N.W. phenotyped the Mu-seq families and prepared
33
seedling photos for public access via MaizeGDB.org. L.A., T.S., and H.S. conceived
34
and carried out the bioinformatics analyses. J.M.G. and J.L.P. curated insertions and
35
phenotypes of the Mu-tagged families at MaizeGDB.org. D.R.M., C.T.H., and K.E.K.
36
provided W22 datasets and participated in data interpretation. J.A.B. was involved in
37
statistical analysis. C.M. and L.A. interpreted the data and drafted the article. H.S.
38
and F.H. participated in data interpretation, coordinated the study and helped to draft
39
the article. All authors approved the final draft of the article.
One sentence summary:
41
A European sequence-indexed library of Mutator insertions provides an important
42
resource for functional genetics studies of maize.
43
44
1
These authors contributed equally to this work
45
2
Present address: Federal Ministry of Food and Agriculture, 53123 Bonn, Germany
46
3
Present address: USDA-ARS Chemistry Research Unit, Gainesville, Florida, FL
47
32608, USA.
48
* Senior authors: Caroline Marcon ([email protected]), Frank Hochholdinger
49
([email protected]) and Heiko Schoof ([email protected])
Abstract
51
Sequence-indexed insertional libraries in maize (Zea mays L.) are fundamental
52
resources for functional genetics studies. Here, we constructed a Mutator (Mu)
53
insertional library in the B73 inbred background designated BonnMu. A total of 1,152
54
Mu-tagged F2-families were sequenced using the Mu-seq approach. We detected 55
225,936 genomic Mu insertion sites and 41,086 high quality germinal Mu insertions
56
covering 16,392 of the annotated maize genes (37% of the B73v4 genome). On
57
average, each F2-family of the BonnMu libraries captured 37 germinal Mu insertions 58
in genes of the Filtered Gene Set (FGS). All BonnMu insertions and phenotypic
59
seedling photographs of Mu-tagged F2-families can be accessed via MaizeGDB.org. 60
Downstream examination of 137,410 somatic and germinal insertion sites revealed
61
that 50% of the tagged genes have a single hotspot, targeted by Mu. By comparing
62
our BonnMu (B73) data to the UniformMu (W22) library, we identified conserved
63
insertion hotspots between different genetic backgrounds. Finally, the vast majority of
64
BonnMu and UniformMu transposons was inserted near the transcription start site of
65
genes. Remarkably, 75% of all BonnMu insertions were in closer proximity to the
66
transcription start site (distance: 542 bp) than to the start codon (distance: 704 bp),
67
which corresponds to open chromatin, especially in the 5’ region of genes. Our
68
European sequence-indexed library of Mu insertions provides an important resource
69
for functional genetics studies of maize.
Introduction
71
The genome of the maize (Zea mays L.) inbred line B73v4 is predicted to contain
72
44,117 genes, including 39,179 high confidence protein encoding gene models and
73
4,938 genes encoding for large intergenic non-coding RNAs (lincRNAs), tRNAs and
74
miRNAs (Jiao et al., 2017). To date only a few hundred of these genes have been
75
functionally characterized (Schnable and Freeling, 2011). The identification of
76
specific mutants in forward genetic screens and the subsequent cloning of the
77
underlying genes has been the method of choice to determine gene functions for
78
several decades (Candela and Hake, 2008). Until now, reverse genetics using
79
specific gene sequences as a starting point for the identification of the corresponding
80
mutants (Candela and Hake, 2008) has mainly been used to independently validate
81
candidate genes identified by forward genetics experiments (e.g. Hochholdinger et
82
al., 2008; Nestler et al., 2014). Nevertheless, reverse genetics has also been
83
successfully applied to identify developmental mutants of genes without prior
84
knowledge of their phenotype (Xu et al., 2015). Genome-wide insertional
85
mutagenesis is a tool to create loss-of-function mutations for virtually all genes in a
86
genome by the insertion of DNA into the gene of interest. Sequence-indexed
87
collections of such mutants have been generated for Arabidopsis (Arabidopsis 88
thaliana) (Alonso et al., 2003), rice (Oryza sativa) (Hirochika et al., 2004) and maize
89
(Fernandes et al., 2004; McCarty et al., 2005; Liang et al., 2019).
90
Endogenous transposons or transposable elements (TEs) are mobile DNA
91
sequences initially discovered in maize by Barbara McClintock (McClintock, 1951).
92
Once activated, a transposon can move from one location in the genome to another,
93
thereby disrupting genes. The two major classes of transposons are class I
94
retrotransposons and class II DNA transposons. The main difference between these
95
classes is their mode of transposition. Class I retrotransposons first require
96
transcription of their DNA to an RNA intermediate, which is then reversely transcribed
97
into DNA, before it is re-inserted into a new genomic location (reviewed in Feschotte
98
et al., 2002). This mechanism is catalyzed by a reverse transcriptase. In contrast, the
99
TE itself is the transposition intermediate for class II DNA transposons. Both classes
100
have in common that they consist of “autonomous” and “non-autonomous” TEs.
101
Autonomous TEs can transpose by themselves, because they encode a transposase,
102
whereas non-autonomous TEs require another autonomous transposon to move.
Class I transposons are predominantly intergenic, contributing to plant genome size
104
(Bennetzen, 2000). In contrast, class II TEs insert preferentially in and around genes
105
(Dietrich et al., 2002; Fernandes et al., 2004; Settles et al., 2004), which is a
106
prerequisite for genome-wide insertional mutagenesis screens.
107
The most active class II transposon family in maize is the family of Mutator (Mu)
108
elements (Lisch, 2002). Discovered by Donald S. Robertson (Robertson, 1978),
109
MuDR, an autonomous TE, controls the transposition of itself and 16 classes of
non-110
autonomous Mu elements (Lisch, 2015). All Mu transposons share highly conserved
111
215 bp terminal inverted repeats (TIRs) at both ends of the element and upon
112
insertion they generate 9 bp target site duplications (TSDs) directly flanking the Mu 113
transposon sequences. For untargeted insertional mutagenesis, Mu exhibits a
114
number of advantages over other maize class II transposon families, such as
115
Activator/Dissociation (Ac/Ds) or Enhancer/Suppressor-mutator (En/Spm), including
116
its high transposition rate and high-copy number (Chandler and Hardeman, 1992).
117
While Ac/Ds transposons exhibit a preference for regional mutagenesis, i.e.
118
transposition into closely linked genes (Brutnell, 2002), Mu elements randomly target
119
genes throughout the maize genome (Lisch, 2002). As such, Mu insertion site
120
frequencies strongly correlate with gene density (Liu et al., 2009; Schnable et al.,
121
2009; Springer et al., 2018).
122
In the past, adapter-mediated (Frey et al., 1998) and thermal asymmetric interlaced
123
PCR (TAIL-PCR; Liu and Whittier, 1995) have been used to amplify Mu-flanking
124
fragments for sequencing. The presence of highly conserved TIR sequences at both
125
ends of the transposons is ideally suited to design Mu-specific primers used in
TAIL-126
PCR. This PCR technique combines nested TIR-specific primers and degenerative
127
arbitrary primers to amplify sequences neighboring known sequences by using high
128
and low annealing temperature cycles (Settles et al., 2004). More recently,
high-129
throughput next generation sequencing enables efficient, reproducible and
130
sequence-based identification and mapping of transposon insertion sites in maize
131
(McCarty et al., 2013; Liu et al., 2016; Liang et al., 2019).
132
Thus far, several transposon-tagged maize populations have been generated using
133
the Mu transposon system (Fernandes et al., 2004; Stern et al., 2004; McCarty et al.,
of the annotated maize gene models (Liang et al., 2019) have mapped Mu insertions.
136
Among these collections, the insertion-tagged UniformMu population (McCarty et al.,
137
2005) has been developed by backcrossing an active MuDR element eight times into
138
the genetically uniform inbred line W22. A genetically uniform genetic inbred
139
background is one key feature of the UniformMu resource, because it allows to
140
distinguish between parental and newly created mutations. Therefore, a uniform
141
background aids to identification of insertions related to new phenotypes (McCarty et
142
al., 2005). A large set of more than 14,000 UniformMu lines are publicly available
143
(Liu et al., 2016). Another Mu insertional library, called ChinaMu, has been generated
144
by crossing a Mu-starter line to the inbred line B73 (Liang et al., 2019). The Mu
-145
tagged sequences of 2,581 F2-Mu lines were isolated by a Mu tag enrichment 146
approach and sequenced by high-throughput sequencing.
147
Here we used the Mutator-seq approach (Mu-seq; McCarty et al., 2013; Liu et al.,
148
2016) to construct multiplexed sequencing libraries in the inbred line B73 that
149
guarantees unbiased coverage of mutations in the maize genome. The Mu-seq
150
reverse genetics approach enables the identification of F2-families carrying 151
transposon insertions in genes of interest in a sequence-indexed transposon tagged
152
population. These newly identified transposon induced mutations can be used for
153
subsequent molecular and genetic analyses. Furthermore, this European database
154
(BonnMu) of sequence-indexed Mutator transposon insertion sites in B73
155
complements the UniformMu and ChinaMu resources and allows for forward and
156
reverse genetics experiments. Besides the sequence-indexed Mu insertional libraries
157
from North America (UniformMu) and Asia (ChinaMu), our resource of transposon
158
induced mutations will offer easier access for European researchers but also for
159
maize geneticists around the globe.
Results
161
Mutator-seq library alignment statistics of BonnMu
162
To generate a sequence-indexed collection of transposon tagged maize mutants, the
163
Mutator-seq (Mu-seq) protocol (McCarty et al. 2013; Liu et al. 2016) was applied to
164
generate two libraries each containing 576 Mu active B73 F2-families (BonnMu) of 165
maize. These 1,152 mutagenized F2-families were pooled according to a 24 x 24 grid 166
system per library (see methods). Sequencing of the two libraries yielded 55 and 90
167
million raw read pairs (Table 1; Supplemental Dataset S1). Each Mu-seq library was
168
parsed according to the individual 6 bp barcodes of the 48 multiplexed pools (Table
169
S1), resulting in an averaged output of 1,151,003 and 1,871,525 read pairs per pool
170
(Supplemental Dataset S1). Downstream statistical analysis of the two Mu-seq
171
libraries are summarized in Table 1. After trimming U-adapter and TIR sequences,
172
83% and 89% (Table 1) of the remaining reads (43 and 65 million) were aligned to
173
the B73 Filtered Gene Set (FGS) AGPv4.36, containing 44,117 high confidence gene
174
models. After duplicate read removal, 18 and 23 million read pairs remained and
175
were used to identify genomic insertion sites, in (a) any of the 48 pools (somatic and
176
germinal insertions, named union in Table 1) and (b) at intersections of one row and
177
one column pool (germinal insertions, named intersection in Table 1). For insertion
178
site identification, reads were counted in each of the 48 pools. Only insertion sites
179
supported by at least 4 reads were used for further analyses. In total, 225,936
180
genomic insertion sites were detected in the two Mu-seq libraries (Table 1;
181
Supplemental Dataset S2). Among those insertion sites, 61% (137,410 of 225,936
182
insertions) mapped to FGS genes, tagging in total 22,362 genes (Table 1). Thus,
183
there were on average six somatic or germinal insertions per tagged FGS gene.
184
Further parsing of insertion sites identified 110,730 insertion sites in exons of FGS
185
genes, 40,140 of such sites in the coding sequence, 75,201 sites in 5’ UTR, 7,125
186
insertion sites in 3’ UTR, and 25,203 insertion sites in introns of FGS genes. In
187
addition, 38,609 insertion sites ≤500 bp upstream of FGS genes and 88,562
188
intergenic insertions were detected (Table 1). Based on the genome annotation of
189
AGPv4.36, insertion sites can be assigned to more than one feature, e.g. both the 5’
190
UTR and exonic region, within a gene. To calculate the number of insertion sites in
191
introns, the union of insertion sites located in exons/cds and UTRs was subtracted
from the number of insertion sites in FGS genes. Therefore, the number of insertion
193
sites located in introns cannot be re-calculated from Table 1.
194
Finally, to only consider heritable (germinal) insertions the information from the
195
different pools was combined to track down Mu tagged genes in specific F2-families. 196
Each F2-family is represented by the intersection of one column and one row pool 197
(according to the 24 x 24 grid system; Table S1). By that criterion, we identified
198
66,750 germinal insertion sites in the two Mu-seq libraries, of which 38% (25,664 of
199
66,750) mapped to non-coding DNA (Table 1). The remaining 62% (41,086 of
200
66,750) of the insertion sites were located in genes of the FGS (Table 1;
201
Supplemental Dataset S3). On average, each F2-family harbored 37 germinal 202
insertions in FGS genes (Supplemental Dataset S3; Table S2 and Table S3).
203
Furthermore, 46% of mutated FGS genes (7,582 of 16,392 FGS genes) contained
204
insertions in coding sequences.
205
European based BonnMu complements the North American UniformMu and the
206
Asian ChinaMu resource
207
Based on the analysis of two Mu-seq libraries in B73 (BonnMu), Mu insertions
208
affected 16,392 of 44,117 (37%; Table 1, Figure 1A) high confidence gene models of
209
maize. Of the 16,392 genes, 41% (6,763) were identified in F2-families of both Mu -210
seq libraries, whereas 59% (9,656) of the genes were uniquely detected in one of the
211
Mu-seq libraries (Figure 1A). We observed a significantly higher overlap of Mu 212
tagged genes in both Mu-seq libraries than expected (2,938; Table S4). This finding
213
supports the notion that genes are not randomly targeted by Mu transposons, but
214
that there is a preference for Mu tagging of specific genes.
215
The 16,392 genes of the BonnMu collection in the B73 background was compared to
216
16,090 Mu tagged genes of the UniformMu resource in the W22 background
217
(McCarty et al., 2013) and to 20,396 genes tagged in B73 in the ChinaMu dataset
218
(Liang et al., 2019) and personal communication with R. Song). The three collections
219
cover 57% (25,140 of 44,117) of the genes present in the B73 reference genome
220
AGPv4.36 (Figure 1B). A considerable proportion of Mu tagged genes, i.e., 42%
221
(10,623 of 25,140) were hit in all three collections. This number of overlapping genes
222
was significantly higher than expected by pure chance (2,724; Table S4), suggesting
223
that at least some genes are preferentially targeted by Mu insertions.
BonnMu insertions can be browsed at the MaizeGDB website
225
(https://www.maizegdb.org; Portwood et al., 2019) as previously described for the
226
UniformMu database (Liu et al., 2016). A unique feature of BonnMu is that photos of
227
seedling phenotypes of segregating F2-families are linked to the database entries of 228
each transposon insertion. To access and visualize B73 insertions in maizegdb.org,
229
a gene model identifier is needed for the genome browser view. By clicking “select
230
track” and “BonnMu”, insertion sites become visible in the locus. Clicking on the
231
insertion site links to the Mu insertion identifiers (e.g. BonnMu0000812) and the
232
respective F2-Mu-seq family (e.g. BonnMu-2-A-0596) and its respective phenotype 233
10 days after germination. Among the analyzed F2-families various leaf color mutants 234
were identified such as albino (e.g. BonnMu-2-A-0784) or pale green (e.g. BonnMu
-235
2-A-0784). The mutation rate, detected on the basis of albino and pale green leaf
236
phenotype was 13% (149 of 1,152 F2-families). Furthermore, shoot gravitropism 237
mutants (e.g. BonnMu-2-A-0596, BonnMu-2-A-0598) were identified.
238
The number of Mutator insertions correlates with gene length in a size
239
dependent manner
240
The present dataset contains 41,086 Mutator insertions in 16,392 B73 high
241
confidence gene models (Table 1, Supplemental Dataset S3). More specifically, 39%
242
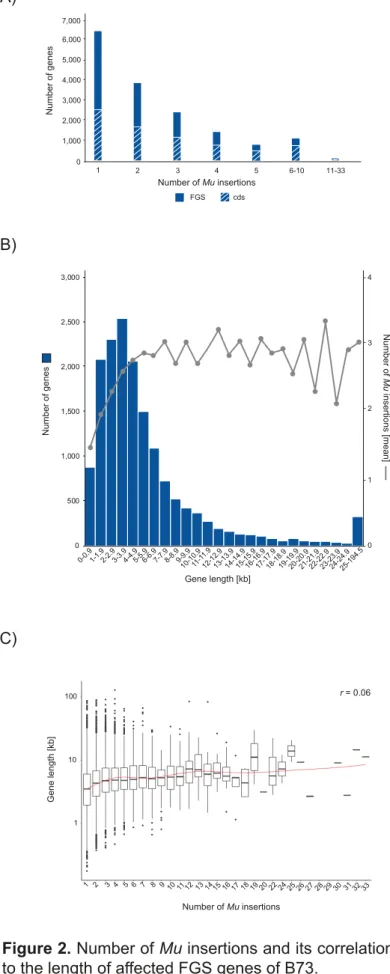
(6,455 of 16,392) of the high confidence gene models were tagged by a unique
243
insertion (Figure 2A), whereas 61% (9,937 of 16,392) contained at least two Mu 244
insertions. A similar distribution was observed when the 7,582 FGS genes harboring
245
insertions in their coding sequence (cds, Table 1, Supplemental Dataset S3) were
246
analyzed. Among those, 33% (2,535 of 7,582) had a unique insertion, whereas 67%
247
(5,047 of 7,582) were tagged by at least two Mu insertions (Figure 2A). An extreme
248
example is a gene encoding an adaptor protein 4 (AP-4) complex subunit µ 249
(Zm00001d002925) which harbored 33 independent insertions in its cds
250
(Supplemental Dataset S3).
251
The length of the affected genes ranged between 72 bp and 195 kb (Figure 2B,
252
Supplemental Dataset S3). The three shortest genes (72 bp) encode tRNAs
253
(Zm00001d006818, Zm00001d007104, Zm00001d034123), whereas the largest
254
gene of 195 kb (Zm00001d001010) represents a lincRNA. We observed 882 tagged
255
genes (5% of all 16,392 Mu tagged FGS genes) in a size range of 72-999 bp (Figure
affected genes (16%) having a size between 3 and 3.999 kb. After this peak the
258
number of affected genes decreased, while their length increased. Overall, 12,510
259
tagged genes (76%) had a size between 72 bp and 6.999 kb, while only 3,882 genes
260
(24%) were >7 kb. In contrast to the observed distribution of the 16,392 tagged
261
genes according to their gene length, the size distribution of all 44,117 B73v4 high
262
confidence gene models differed. While 47% of all B73v4 gene models had a size of
263
<2 kb, only 18% of all Mu tagged genes of the present dataset ranged in that size
264
(Figure S1). In contrast, 53% of all B73v4 gene models had a length between 2 and
265
194.5 kb, while among all Mu tagged genes 82% ranged between these lengths.
266
Next, we tested the hypothesis that the number of Mu insertions increased with the
267
length of the affected genes. Although a strong linear correlation of insertion number
268
with gene size was detected in the gene size range of 72 bp to 3.999 kb, there was
269
no correlation with gene size for genes >4 kb (Figure 2B). Hence, the calculated
270
Pearson correlation over all groups of gene sizes revealed no correlation (r = 0.06;
271
Figure 2C). This abrupt transition in gene-size-dependence at 4 kb was also detected
272
in the W22 dataset (Figure S2, Supplemental Dataset S4). Due to the fact that a
273
large subset of 48% affected genes (7,838 B73 and 7,790 W22 genes) have a size of
274
<4 kb, the gene-size-dependent correlation is important to consider.
275
Mutator insertion hotspots are conserved among affected genes of B73 and
276
W22
277
Next, we investigated if Mu transposons show preferences regarding their insertion
278
sites in the genes. Therefore, we examined all insertion sites in any of the samples,
279
including somatic and germinal insertions of the present BonnMu datasest (Table 1;
280
Supplemental Dataset S2). The majority of these insertion sites (61%; 137,410 of
281
225,936) was located in FGS genes. Each of the 22,362 Mu tagged genes was
282
divided into bins of 200 bp in size. Then, all insertion sites were sorted into the
283
corresponding bins. Each bin with at least one insertion site was counted as a
284
hotspot. In total, 38% (8,502 of 22,362 genes) of the Mu tagged genes had one
285
hotspot, which was predominantly targeted by the transposons (Figure S3A). The
286
number of hotspots per affected gene ranged from 1 to 15, with a median number of
287
two hotspots, independent of gene length (Figure S3B).
288
To investigate if insertion hotspots are conserved among affected genes of our Mu
-289
seq repository in B73 and the UniformMu repository in the W22 genetic background,
one exemplary W22 Mu-seq dataset (SRA accession SRP028545) was re-analyzed.
291
A total of 558 identified insertion sites in W22 supported by at least two reads could
292
be assigned to 423 FGS genes.
293
Among these 423 Mu tagged genes in W22, 413 (98%) were also affected in B73.
294
For the overlapping 413 genes a hotspot analysis was performed. Since we were
295
only interested in conserved hotspots of novel Mu insertion events we first corrected
296
the affected genes for endogenous Mu insertions that are present in the genomes of
297
B73 and W22. About 40 canonical Mu elements exist in the two genomes (Springer
298
et al., 2018) and D. R. McCarty, personal communication; Supplemental Dataset S5).
299
Due to the fact that such parental Mu elements are fixed in every B73/W22 plant,
300
such elements account for a large proportion of reads. Hence, the endogenous
301
elements could contribute to an apparent hotspot overlap between B73 and W22.
302
After correcting for endogenous Mu elements, 22,348 B73 genes and 420 W22
303
genes remained. Among those, 412 genes overlapped between the two datasets and
304
were divided into bins of 200 bp in length. Then, Mu transposon insertion sites
305
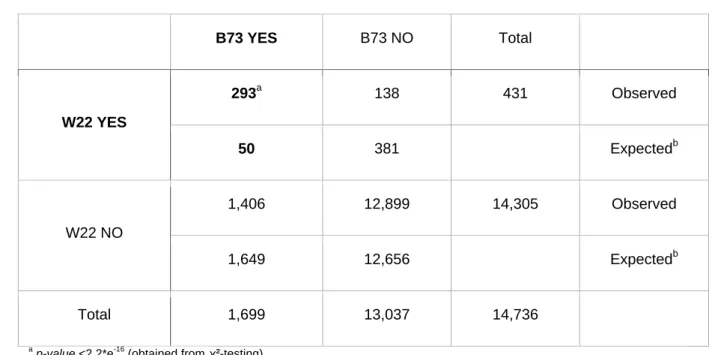
identified in B73 and W22 were sorted into the corresponding bin. Out of 14,736 bins,
306
293 were targeted in both B73 and W22, 1,406 only in B73, 138 only in W22, and
307
12,899 in neither B73 nor W22 (Table 2). A χ²-test was performed to test the
308
hypothesis that there is an association between insertion sites in B73 and W22. The
309
observed value of overlapping bins in both B73 and W22 (293) significantly exceeded
310
the expected value of 50 bins, demonstrating that there are conserved insertion site
311
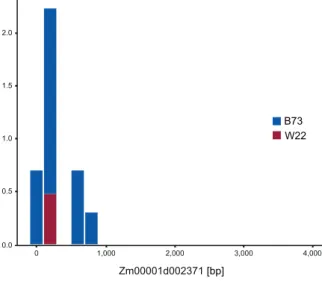
hotspots in both genomes. This observation is exemplarily shown in Figure 3 for gene
312
Zm00001d002371. Here, Mu transposon insertions were concentrated around two
313
hotspots within that gene in B73 and one overlapping hotspot in W22.
314
Mutator transposons preferentially insert near the transcription start site of
315
genes in B73 and W22
316
To investigate if Mu transposons show preferences regarding their insertion sites in
317
genes, the union of all B73 Mu transposon insertion sites located in FGS genes was
318
analyzed. A total of 110,730 of the insertion sites were located in exons of FGS
319
genes (Table 1). Whereas 40,140 of the insertion sites were assigned to the cds of
320
FGS genes, the majority of insertion sites (75,201) were located in the 5’ UTR of FGS
321
genes.
To examine Mu transposon insertion site preferences in B73 compared to W22, for
323
each affected FGS gene with annotated cds, the cds was divided into deciles.
324
Subsequently, all insertion sites located in the cds of FGS genes were sorted into the
325
corresponding cds decile. Insertion sites located up- or downstream of the cds were
326
designated as insertions in the 5’ UTR or 3’ UTR, respectively. The majority of Mu 327
insertion sites was detected in the 5’ UTR and the first decile of the cds in both B73
328
(76%) and W22 (62%), with another smaller peak at the end of the cds (Figure 4A).
329
To account for the length of the FGS genes, all affected genes were sorted into gene
330
sets based on their length (Figure S4A). Each of the sets (deciles) contained 2,152
331
affected B73 and either 42 or 43 affected W22 genes. Whereas in shorter genes of
332
B73 (deciles 1-10%, and 11-20%) Mutator insertions were evenly distributed among
333
the gene, longer genes showed an insertion peak at the start region, i.e., the 5’ UTR
334
and first 10% of the genes’ cds (Figure 4B). Another small peak of insertions was
335
detected at the end of the cds (100%) of B73 genes.
336
Although the W22 dataset (SRP028545) only contained 423 genes, a similar
337
preference of Mu insertions to target the 5’ UTR of the genes was observed (Figure 338
4B). The observation that Mu insertions were evenly distributed among the gene of
339
shorter genes, especially in B73, can be explained by the very short 5’ UTR of those
340
genes. By comparing the length of the 5’ UTRs of each of the ten gene sets it
341
became clear that the first two gene sets (1-10%, 135-1214 bp; 11-20%, 1215-1872
342
bp) had very short or even no 5’ UTRs (Figure S4B). Therefore, the absolute distance
343
of insertions to the 5’ UTRs in those genes was small, even if the insertion was close
344
to the 3’ end of the gene.
345
To verify if the insertion sites were located closer to the 5’ UTR start or closer to the
346
start codon (ATG) of the affected genes, the distance (bp) from insertions inside or
347
upstream of FGS genes to both the 5’ UTR start and cds start codon was calculated
348
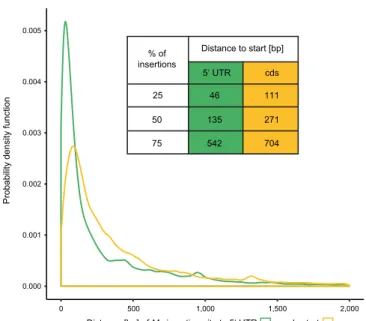
for the B73 dataset. The density plot (Figure 5) represents only insertion sites located
349
500 bp upstream of the 5’ UTR to 2,000 bp downstream of the genes’ start codon.
350
Irrespective of this cut-off, the vast majority of 93% of all insertion sites are in the
351
range of the above-mentioned distance to the 5’ UTR and 90% of all insertion sites
352
are in such a distance to the cds. This result suggested that the majority of Mu 353
insertion sites are close to the 5’ UTR and the cds start of the affected genes. This is
354
also visible in the density plot (Figure 5) where the majority of Mu insertion sites
peaked in close proximity to the 5’ UTR and cds start. The slope of the curve
356
revealed that the Mu transposon insertions are closer to the 5’ UTR than to the 357
genes’ start codon. Finally, 25% of all Mu insertion sites were located in close
358
proximity to the 5’ UTR (46 bp) and to the cds start (111 bp; Figure 5). When 50% of
359
all insertion sites were considered, the distance was on average 135 bp to the 5’ UTR
360
and 271 bp to the cds. Remarkably, 75% of all Mu insertion sites were located near
361
the 5’ UTR (542 bp) and close to the start codon (704 bp) of the affected genes. In
362
summary, this data revealed that the majority of Mu insertion sites are located closer
363
to the 5’ UTR transcription start site than to the cds start of affected genes.
Discussion
365
Construction of the European sequence-indexed insertional library (BonnMu) in
366
maize discovered 41,086 high quality germinal Mu insertions in 16,392 high
367
confidence gene models (Figure 1), tagging 37% of the B73 genome. This number is
368
comparable to the North American UniformMu resource (McCarty et al., 2013; Liu et
369
al., 2016), covering 16,090 genes, which were tagged by 43,943 germinal Mu 370
insertions. Recently, an Asian insertional library (ChinaMu; Liang et al., 2019)
371
identified 66,565 high-quality germinal insertions representing 20,396 annotated
372
maize genes. In comparison to UniformMu and ChinaMu, 1,807 genes were newly
373
tagged by BonnMu. Hence, with our new European sequence-indexed resource, the
374
percentage of Mu tagged maize genes in public repositories increased from 52% to
375
57%. Although, this number is still less than that of Arabidopsis (74% of the genes
376
covered; Alonso et al., 2003), it is comparable to rice (about 60% tagged genes;
377
Wang et al., 2013). However it is worth noting that different techniques, such as
T-378
DNA insertional mutagenesis (Alonso et al., 2003; Toki et al., 2006), two-component
379
transposon system Ac/Ds based mutagenesis (van Enckevort et al., 2005), or Tos17 380
retrotransposon mutagenesis (Miyao et al., 2003) were applied to construct
381
insertional libraries in Arabidopsis and rice. Nevertheless, because adequate Mu 382
tagged F2-families are available in the three global resources (Liang et al., 2019) 383
expanding the datasets is already being implemented to increase the coverage of
384
tagged genes. As described by Liang et al., 2019 we also detected an increase in the
385
number of insertional alleles per gene reducing the efficiency of tagging new genes.
386
A reduction of efficient new gene tagging was also observed in insertional libraries of
387
rice, where more than 246,000 insertions only covered 60% of the genes (Wang et
388
al., 2013). Therefore, our data and previous studies (Kolesnik et al., 2004; Hsing et
389
al., 2007; Zhang, 2007; Liang et al., 2019) suggest that it is difficult, if not impossible,
390
to achieve whole-genome saturation using insertional mutagenesis.
391
Maize is an excellent model for transposon genetics and mutagenesis studies
392
(Settles et al., 2004). Several endogenous DNA transposon systems, such as Ac/Ds 393
(McClintock, 1950) and Mutator transposons (Robertson, 1978) are highly active in
394
maize and can be easily adopted for large-scale mutagenesis. Genic transposon
395
insertions are usually large enough to cause substantial disruptions of gene function,
396
which are genetically stable (McCarty and Meeley, 2009). Moreover, transposon
397
insertions are relatively easy to identify using molecular genetics and high-throughput
sequencing. Nevertheless, early constructed Mu-based mutation libraries in maize
399
(Bensen et al., 1995; May et al., 2003; Fernandes et al., 2004) had to deal with (1)
400
inefficient recovery and identification of newly transposed insertions and (2) the
401
challenge to discriminate between germinal and the high background of somatic
402
insertions. Recent studies have overcome both of these challenges. The Mu-seq
403
method (McCarty et al., 2013 and the present study) applies high-throughput
404
NextGen sequencing of Mu-tag enriched replicated samples to identify germinal Mu 405
insertions. More recently, Liang et al., 2019 achieved Mu-tag enrichment utilizing
406
probe hybridization, coupled with high-throughput sequencing to efficiently recover
407
Mu insertions in F2-families of maize. To distinguish germinal from somatic insertions 408
Liang et al., 2019 used a practical criterion, i.e., normalized Mu-flanking sequence
409
tag read counts, in addition to the replicated samples as were used for the
410
UniformMu analysis (McCarty et al., 2013).
411
Since the present European BonnMu and the North American UniformMu insertional
412
library was constructed using the Mu-seq approach, Mu insertion sites of BonnMu 413
were analyzed and compared in more detail with the UniformMu library. Due to
414
multiple-round backcrossing between the mutagenic parents and the uniform W22
415
inbred line, the UniformMu lines captured on average five novel germinal insertions
416
(McCarty et al., 2005), already excluding about 40 ancestral insertions in the W22
417
genome (D. R. McCarty, personal communication; Supplemental Dataset S5).
418
However, the BonnMu libraries presented here captured 37 germinal insertions in
419
genes of the FGS per F2-family on average (Supplemental Dataset S3, Table S2, 420
Table S3).
421
For about 50% of the BonnMu and UniformMu tagged genes we observed a
gene-422
size- dependent number of insertions (Figure 2B, Figure S2). On average, 2.5
423
insertions were detected per Mu tagged gene and we observed an association
424
between insertion sites in B73 and W22, i.e., hotspots of insertions, which are
425
conserved among tagged genes of both genomes (Figure 3). The availability of the
426
W22v2 assembly (Springer et al., 2018) allows for comparisons to the B73v4
427
reference genome at multiple scales, such as Mu transposon composition. In total,
428
75% to 80% of the genes are present at syntenic locations in both maize inbred lines
429
(Springer et al., 2018), making a comparison suitable. To provide additional support
for the notion that insertion hotspots are conserved among tagged genes in B73 and
431
W22, it will be essential to analyze and compare a larger W22-Mu-seq dataset.
432
Previous studies revealed that Mu insertions concentrate in genomic regions with
433
epigenetic marks of open chromatin near the transcription start site (Dietrich et al.,
434
2002; Liu et al., 2009; Springer et al., 2018). Indeed, Mu elements do exhibit a strong
435
preference for 5’ UTRs of genes (Figure 4; Dietrich et al., 2002; Liang et al., 2019).
436
Even more precisely, we demonstrated that 50% of all BonnMu insertions are located
437
within 135 bp of the transcription start site (TSS) (Figure 5). Pericentromeric regions,
438
which are rich in heterochromatin, display low frequencies of Mu insertions and
439
meiotic recombinations (Liu et al., 2009), suggesting an association of site selection
440
for Mu insertions with chromatin structure. Indeed, locations for novel transposon
441
insertions can be sensitive to chromatin structure (Naito et al., 2009; Sultana et al.,
442
2017; Springer et al., 2018). For instance, DNA methylation patterns were analyzed
443
by whole-genome bisulfite sequencing and chromatin accessibility throughout the
444
W22 genome using a Micrococcal Nuclease (MNase) assay (Springer et al., 2018).
445
The enrichment of open chromatin, based on epigenetic marks, such as CHH, and
446
MNase treatment at the (TSS) and the 3’ UTR of genes (Regulski et al., 2013;
447
Springer et al., 2018) corresponds with the majority of BonnMu insertions detected
448
near the 5’ UTR region of genes (Figure 4 and 5) and a smaller peak near the 3’ UTR
449
(Figure 4A). Hence, it is likely that chromatin structure plays a key role in site
450
selection for Mu insertions. Further indirect support of the hypothesis that open
451
chromatin drives Mu insertion sites preferences is shown in Figure 1 of this study.
452
The high number of observed Mu tagged genes overlapping among the libraries
453
suggests that the genes are not randomly selected by Mu. To further test the
454
hypothesis that open chromatic marks drives Mu insertion site preferences, chemical
455
treatment to promote chromatin opening (Baubec et al., 2009) could be applied,
456
thereby facilitating Mu insertions in heterochromatic, i.e., inaccessible regions.
457
Another indirect strategy to support this hypothesis is to test if the subset of genes
458
that is not yet Mu tagged in any of the published libraries belongs to transcriptionally
459
silenced genes with densely methylated chromatin.
460
Conclusion
461
In summary, our publicly available European BonnMu insertional library provides a
462
starting point for forward and reverse genetics studies in maize. To facilitate
functional genomics study in maize, specific mutants and respective phenotypes of
464
segregating F2-families can be identified based on gene sequences of interest 465
through MaizeGDB.org as described in Liu et al., 2016. Detected on the basis of
466
albino and pale green leaf phenotypes, the mutation rate was ~13%, which is
467
consistent with previously published mutation rates (Robertson, 1983), suggesting a
468
high transposon activity in these stocks. The European BonnMu resource is still
469
expanding to archive additional genes tagged by germinal Mu insertions. To
470
accelerate the identification of Mu insertion sites of future Mu-seq libraries we created
471
a Mu-seq workflow utility (MuWU) which is publicly available at
472
https://github.com/Crop-Bioinformatics-Bonn/MuWU. Our MuWU makes use of
473
bioconda (Grüning et al., 2018) and snakemake (Köster and Rahmann, 2012) to
474
provide an easy to install and completely automated framework for the detection and
475
annotation of Mutator insertion sites.
Material and methods
477
Plant material
478
The Mutator tagged maize (Zea mays) F1-population was generated in the summer 479
season of 2014 by crossing an active Mutator line (Mu2 per se; Robertson, 1983) into
480
B73 at the experimental field station Campus Klein Altendorf (CKA, University of
481
Bonn). The F1-generation, which is heterozygous for the new Mu insertions, was self-482
pollinated during winter nursery 2014/15 in Chile and in the summer season 2015 at
483
CKA to produce segregating F2-families. 484
Mu-seq library production
485
For construction of two multiplexed Mu-seq libraries we used 1,152 (2 x 576) F2 -486
families in the B73 background and followed the previously described Mu-seq
487
approach (McCarty et al., 2013). Briefly, each of the two Mu-seq libraries contained
488
576 F2-families, which were pooled according to a 2-dimensional 24 x 24 grid design 489
(Table S1). Hence, the two Mu-seq libraries consisted of 1,152 (2 x 24 x 24) F2 -490
families. Construction of the Mu-seq libraries started with germination of 2 x 576
491
maize F2-families (6 seeds per F2-family) in paper rolls (Hetz et al., 1996). Sampling 492
of leaf-tissue was carried out 10-12 days after germination, according to the 24 x 24
493
grid design, where each family contributed to one distinct column and one distinct
494
row pool. In total, there were 24 row and 24 column pools, which created 48
495
multiplexed leaf samples. Depending on the germination rate, 3-6 seedlings were
496
sampled per F2-family. If less than 3 seedlings germinated, seeds of these F2-families 497
were re-germinated to complement the number of seedlings. A probability was
498
calculated of 99% (Table S5) to obtain at least one mutant allele per tagged gene
499
among the 3-6 germinated plants per F2-family. To ensure the specific identification 500
of heritable germinal insertions at intersections of rows and columns in the grid, leaf
501
samples of row and column pools were taken from independent somatic cell
502
lineages, i.e., from alternate leaves of each seedling. By utilizing this approach,
non-503
heritable, somatic insertions appeared only in a single axis of the grid and they were
504
excluded from further analyses. Subsequently, gDNA was isolated from these 48
505
pools (Nalini et al., 2003) and randomly fragmented to a size of about 1 kb using 1-3
506
cycles of 3 min sonication using an Ultrasonication unit followed by 3 min rigorous
507
vortexing. The single stranded overhang of the randomly sheared gDNA fragments
508
were filled in by an enzyme mix to create blunt ends that enabled ligation of a
stranded universal (U) adapter. Afterwards, Mu-flanking amplicons were enriched by
510
ligation-mediated PCR using a Mu-TIR-specific and a specific primer for the ligated U
511
adapter (PCR I). Two subsequent rounds of PCR (PCR II and III) used nested TIR
512
primers in combination with Illumina sequencing adapter primers to successively
513
incorporate the adapters, necessary for sequencing of the fragments. To reduce the
514
number of very short Mu-flanking fragments, PCR II products were purified to a size
515
range of 300 to 800 bp on 1.2% (w/v) agarose gels. To avoid sample contamination,
516
each of the 48 PCR II products was loaded on a separate gel. The final PCR III
517
completed the required sequencing adapters and incorporated a 6 bp barcode
518
allowing multiplexing of the 48 pools. Finally, each Mu-seq library was quantified
519
using a Bioanalyzer, DNA 7500 chip (Agilent Technologies). The final concentrations
520
of the two Mu-seq libraries were 73 and 102 nM. Paired-end sequencing (100 bp) of
521
the multiplexed Mu-seq libraries was performed in two separate lanes of a HiSeq
522
2500 (Illumina) sequencer.
523
Identification of Mutatorinsertion sites in B73 524
Adapters and terminal inverted repeat (TIR) sequences were cut from both ends of
525
the raw Mu-seq reads with cutadapt v2.3 (-e 0.2; Martin, 2011). Low quality bases
526
were filtered with Trimmomatic v0.36 (SLIDINGWINDOW:4:15; MINLEN:12; Bolger et
527
al., 2014) and mapped to the Zea mays L. reference genome AGPv4.36 (Jiao et al.,
528
2017) with Bowtie2 v2.5.0 (Langmead and Salzberg, 2012). Duplicate reads were
529
removed with the Picard MarkDuplicates tool v2.5.0 (Picard Toolkit, 2019:
530
https://github.com/broadinstitute/picard). Mu insertion sites were identified using a
531
customized Python script based on the characteristic 9 bp overlap of Mu insertion
532
flanking sequences (McCarty et al., 2013). An insertion site was selected if the 9 bp
533
overlap was supported by at least two reads on each side. To detect insertions that
534
can be assigned to a specific maize F2-family, all insertion sites with matching 535
genomic coordinates in only one row and one column sample were selected. To
536
identify Mu insertion sites inside or upstream of genes of the B73 Filtered Gene Set
537
v4.36 (FGS; Jiao et al., 2017), the Bioconductor R packages IRanges v2.16 and
538
GenomicRanges v1.36 (Lawrence et al., 2013), as well as ChIPpeakAnno v3.16.1
539
(Zhu et al., 2010) were subsequently employed. Only Mu insertion sites located
540
inside or upstream (≤500bp) of FGS genes were considered. The Pearson correlation
coefficient was calculated in R v3.5.2 to test the hypothesis that the number of Mu 542
insertions increased with the length of the affected genes.
543
To determine the expected number of FGS genes being Mu tagged among BonnMu 544
libraries and global sequence-indexed libraries (Table S4; Figure 1), a generalized
545
linear model with a log-link and Poisson distribution was fitted under the assumption
546
of independence between the three available Mu-seq resources using proc genmod 547
in SAS 9.4 (SAS Institute Inc., Cary, NC, USA, 2014). For each comparison, the
548
model under independence comprised main effects for each of the compared
549
resources. The expected and observed numbers of Mu tagged FGS genes were
550
compared using a χ2-test for the two- or three-way interaction effect of the compared 551
resources, respectively. Significant differences were determined at a significance
552
level of α = 0.05. Because it was not known which genome versions were used to
553
align the reads of the UniformMu or the ChinaMu datasets, the reference genome
554
AGPv4.36, used in the present study, was applied. Hence, only 16,066 UniformMu 555
genes and 20,133 ChinaMu genes (Figure 1B) were considered for the calculation of
556
expected values.
557
Identification of Mutatorinsertion sites in W22
558
Single-end raw Mu-seq reads in W22 background (SRA accession SRP028545) were
559
trimmed with cutadapt v2.3 (-e 0.2; Martin, 2011). The barcode and the terminal
560
inverted repeat (TIR) sequence were cut from the beginning of each read. Reads
561
without TIR sequence were discarded and bases were cut from the end of the
562
remaining reads with Trimmomatic v0.36 (Bolger et al., 2014) if they fell below a
563
quality score of 20 (TRAILING:20; MINLEN:12). Reads were mapped to the Zea 564
mays L. reference genome W22 v2.0 (Springer et al., 2018) with Bowtie2 v2.5.0
565
(Langmead and Salzberg, 2012) and duplicate reads were subsequently removed
566
using the Picard MarkDuplicates tool v2.5.0 (Picard Toolkit, 2019:
567
https://github.com/broadinstitute/picard). Reads that mapped to more than one
568
position were excluded from the deduplicated SAM files and Mu insertion sites were
569
identified using a customized Python script. Genomic coordinates were tagged as Mu 570
transposon insertion sites if the alignment start of at least two reads matched at the
571
same position. Insertion sites located inside W22 v2.0 genes (Springer et al., 2018)
572
were identified with the R Bioconductor packages IRanges v2.16, GenomicRanges
v1.36 (Lawrence et al., 2013), and ChIPpeakAnno v3.16.1 (Zhu et al., 2010) and all
574
insertion sites located inside W22 genes were selected.
575
Analysis of Mutatorinsertion sites in B73 and W22
576
To analyze hotspots of Mutator insertion sites in B73 and W22, all insertion sites
577
were sorted into corresponding bins. To this end, the length of each gene was
578
divided into bins of 200 bp in size and the number of bins (i.e. hotspots) containing
579
Mu transposon insertions was counted for each gene. To compare hotspots between
580
B73 and W22, Mu flanking sequences in W22 were extracted (50 bp upstream – 50
581
bp downstream of the insertion site) using BEDTools v2.25.0 (Quinlan and Hall,
582
2010) and aligned to the Zea mays L. reference genome AGPv4.36 (Jiao et al.,
583
2017) with Bowtie2 v2.5.0 (Langmead and Salzberg, 2012). Multireads (i.e. reads
584
aligning to multiple genomic locations) were excluded and B73 coordinates of W22
585
reads were further analyzed to identify W22 Mu insertion sites within genes of the
586
B73 FGS (Jiao et al., 2017) as described above. Identified insertion sites in W22 and
587
B73 were filtered for endogenous Mu elements. To this end, matches between
588
sequences of endogenous Mu elements (Springer et al., 2018) and Mu insertion
589
flanking sequences (200 bp upstream – 200 bp downstream of the insertion
590
site) were identified with BLAST v2.3.0 (Camacho et al., 2009). Matches that
591
exceeded the defined threshold (pident ≥95; bitscore ≥50) were excluded from further
592
analyses. Remaining Mu tagged genes that were hit in both B73 and W22 were
593
divided into 200 bp bins. The filtered Mu insertions were sorted into the
594
corresponding bins. A χ²-test (α ≤0.01) was performed on the confusion matrix given
595
in Table 2 in R v3.5.2 to test the hypothesis that there was an association between
596
hotspots in B73 and W22.
597
To analyze insertion site preferences of Mu transposons, the longest transcript for
598
each affected gene in either B73 or W22 was selected and the coding sequence
599
(cds) was divided into deciles based on the B73 FGS (Jiao et al., 2017). Genes
600
without annotated cds were excluded from further analyses. All identified insertion
601
sites located in the cds, including endogenous Mu elements, were sorted into the
602
corresponding cds decile. Insertion sites located within FGS genes, but up- or
603
downstream of the cds, were counted as an insertion site in the 5’ UTR and 3’ UTR,
604
respectively. To determine the distance from each Mu insertion site to the TSS, the
identified in B73 inside or upstream (≤500 bp) of B73 FGS genes, the absolute
607
distance to both the cds start and, if available, the 5’ UTR start of the associated
608
gene was calculated.
609
Accession numbers
610
Raw sequencing data are stored at the Sequence Read Archive
611
(http://www.ncbi.nlm.nih.gov/sra) with the accession number PRJNA608624.
Supplemental Data
613
The following supplemental materials are available in the online version of this article.
614
Supplemental Figure S1. Size distribution of 16,392 affected FGS genes in
615
comparison to the size distribution of all 44,117 B73v4 genes.
616
Supplemental Figure S2. Number of affected W22 genes and associated number of
617
Mu insertions plotted against the corresponding gene size.
618
Supplemental Figure S3. Number of regions (200 bp bins) in FGS genes
619
preferentially targeted by Mu transposons.
620
Supplemental Figure S4. Affected genes sorted into gene sets according to their
621
length (deciles).
622
Supplemental Table S1. Grid design for 24 x 24 F2-families, i.e., 576 F2-families per 623
Mu-seq library.
624
Supplemental Table S2. Number of germinal Mu insertions in FGS genes per 576
625
F2-families (Mu-seq 1). 626
Supplemental Table S3. Number of germinal Mu insertions in FGS genes per 576
627
F2-families (Mu-seq 2). 628
Supplemental Table S4. Number of observed and expected Mu-tagged genes
629
among sequence-indexed Mu insertional libraries (related to Figure 1).
630
Supplemental Table S5. Calculated probability to obtain at least one mutant allele
631
per tagged gene among the 3-6 germinated plants per F2-family. 632
Supplemental Dataset S1. Number of raw read pairs per row and column sample
633
sequenced per Mu-seq library with HiSeq2500 (Illumina) sequencer.
634
Supplemental Dataset S2. A total of 225,936 genomic insertion sites detected in the
635
two Mu-seq libraries.
636
Supplemental Dataset S3. A total of 41,086 Mu insertion sites detected in 16,392
637
genes of the Filtered Gene Set (FGS).
638
Supplemental Dataset S4. List of 43,943 UniformMu insertions within 16,090 genes
639
in B73.
Supplemental Dataset S5. Canonical Mu elements in W22 and B73.
641
Acknowledgement
643
We thank Hans-Peter Piepho (University of Hohenheim) for statistical assistance. We
644
also appreciate the help of Peng Yu (University of Bonn) in this project. We thank
645
Karl-Josef Wiesel (Campus Klein Altendorf, University of Bonn), Christa Schulz and
646
Helmut Rehkopf (University of Bonn) for technical assistance. This project was
647
supported by the Deutsche Forschungsgemeinschaft (DFG) grant MA 8427/1-1 to
648
CM and the Bundesministerium für Bildung und Forschung (BMBF) grant no. 031
649
B195C to FH. JLP and CTH were funded by the United States Department of
650
Agriculture, Agricultural Research Service (USDA-ARS).
Table 1. Mu-seq library alignment statistics.
652
Mu-seq 1 Mu-seq 2 combined
Raw read pairs 89,833,184 55,248,154
Read pairs after trimming1 65,773,604 43,651,352
Average alignment rate 89% 83%
Remaining read pairs after removing
duplicate reads2 23,251,540 18,785,728
Union (somatic and germinal insertions)3
Insertion sites 135,108 112,205 225,936
Insertion sites in FGS4 genes 81,698 68,413 137,410
Insertion sites in exons of FGS genes 66,270 55,221 110,730
Insertion sites in cds of FGS genes 22,743 19,743 40,140
Insertion sites in 5‘ UTR of FGS genes 46,362 37,945 75,201
Insertion sites in 3‘ UTR of FGS genes 4,085 3,361 7,125
Insertion sites in introns of FGS genes 14,586 12,404 25,203
Insertion sites upstream of FGS genes (≤500
bp) 23,268 19,411 38,609
Intergenic insertion sites 53,410 43,792 88,562
Mu-tagged FGS genes 19,162 17,923 22,362
Intersection (germinal insertions)5
Insertion sites 43,225 24,234 66,750
Insertion sites in non-coding DNA 16,462 9,323 25,664
Insertions sites in FGS genes 26,762 14,912 41,086
Mu-tagged FGS genes 13,590 9,538 16,392
Mu-tagged FGS genes, affected in their cds 5,605 3,487 7,582
1
Mu-seq reads were trimmed and aligned to the B73v4 genome as described in the materials and methods section. 653
2
Duplicate reads were removed as described in the materials and methods section 654
3
All insertion sites identified in any of the samples. Insertion sites were identified as described in the materials and methods 655
section. 656
4 FGS, filtered gene set
657
5
Table 2. Number of expected and observed unique and overlapping bins, i.e., 200 bp
659
sized regions of genes, targeted by Mu transposon insertions in B73 and W22.
660
661
B73 YES B73 NO Total
W22 YES
293a 138 431 Observed
50 381 Expectedb
W22 NO
1,406 12,899 14,305 Observed
1,649 12,656 Expectedb
Total 1,699 13,037 14,736
ap-value <2.2*e-16 (obtained fromχ²-testing)
662
b
Expected value of bins being hit in B73 and W22 was calculated as total number of bins identified in W22 (431)* total 663
Figure legends
665
Figure 1. Overlap of FGS genes tagged by Mutator transposon insertions. A) Tagged
666
FGS genes among the two Mu-seq libraries in the B73 background. B) FGS genes
667
with Mu insertions in the three available Mu-tagged resources in the B73 (blue,
668
BonnMu; green, ChinaMu) and W22 inbred backgrounds (red, UniformMu).
669
670
Figure 2. Number of Mu insertions and its correlation to the length of affected FGS
671
genes of B73. A) Distribution and number of Mu insertions among 16,392 affected
672
FGS genes and the subset of 7,582 genes harboring insertions in the coding
673
sequence (cds) of FGS genes. B) Number of tagged genes and associated mean
674
number of Mu insertions plotted against the corresponding gene size. C) Length
675
distribution of affected genes plotted against the individual number of Mu insertions
676
(Pearson correlation coefficient, r = 0.06).
677
678
Figure 3. A Mu insertion hotspot in the representative gene Zm00001d002371
679
affected in the B73 and W22 genomes. The number of Mu insertions is plotted
680
against location in Zm00001d002371.
681
682
Figure 4. Distribution of Mu transposon insertion sites in FGS genes. A) Proportion
683
of Mu insertions located in each decile of the cds, 5’ UTR, and 3’ UTR (B73, blue; 684
W22, red). B) All FGS genes targeted by Mu transposons in B73 and W22
685
(SRP028545) were divided into gene sets based on their length (1%-10% represent
686
the shortest set of genes and 91%-100% represent the longest genes) and the
687
number of genes with insertions in each cds decile, 5’ UTR and 3’ UTR (B73, blue;
688
W22, red).
689
690
Figure 5. Distance of Mu insertion sites to the start of the 5’ UTR (transcription start 691
site) and the coding sequence (cds) of affected B73 genes. Density plot illustrating
692
the distances of the Mu insertion sites to the 5’ UTR start (green) and the start of the 693
cds (yellow). Only insertion sites located between 500 bp upstream of the 5’ UTR and
694
2,000 bp downstream of the ATG were considered. Calculated distances of Mu 695
insertion sites to the 5’ UTR and the start of affected genes are given in the table.
Literature cited
697
Alonso JM, Stepanova AN, Leisse TJ, Kim CJ, Chen H, Shinn P, Stevenson DK,
698
Zimmerman J, Barajas P, Cheuk R, Gadrinab C, Heller C, Jeske A,
699
Koesema E, Meyers CC, Parker H, Prednis L, Ansari Y, Choy N, Deen H,
700
Geralt M, Hazari N, Hom E, Karnes M, Mulholland C, Ndubaku R, Schmidt
701
I, Guzman P, Aguilar-Henonin L, Schmid M, Weigel D, Carter DE,
702
Marchand T, Risseeuw E, Brogden D, Zeko A, Crosby WL, Berry CC,
703
Ecker JR (2003) Genome-wide insertional mutagenesis of Arabidopsis 704
thaliana. Science 301: 653-657
705
Baubec T, Pecinka A, Rozhon W, Mittelsten Scheid O (2009) Effective,
706
homogeneous and transient interference with cytosine methylation in plant
707
genomic DNA by zebularine. Plant J 57: 542-554
708
Bennetzen JL (2000) Transposable element contributions to plant gene and genome
709
evolution. Plant Mol Biol 42: 251-269
710
Bensen RJ, Johal GS, Crane VC, Tossberg JT, Schnable PS, Meeley RB, Briggs
711
SP (1995) Cloning and characterization of the maize an1 gene. Plant Cell 7:
712
75-84
713
Bolger AM, Lohse M, Usadel B (2014) Trimmomatic: a flexible trimmer for Illumina
714
sequence data. Bioinformatics 30: 2114-2120
715
Brutnell TP (2002) Transposon tagging in maize. Funct Integr Genomics 2: 4-12
716
Camacho C, Coulouris G, Avagyan V, Ma N, Papadopoulos J, Bealer K, Madden
717
TL (2009) BLAST+: architecture and applications. BMC Bioinformatics 10: 421
718
Candela H, Hake S (2008) The art and design of genetic screens: maize. Nat Rev
719
Genet 9: 192-203
720
Chandler VL, Hardeman KJ (1992) The Mu elements of Zea mays. Adv Genet 30:
721
77-122
722
Dietrich CR, Cui F, Packila ML, Li J, Ashlock DA, Nikolau BJ, Schnable PS
723
(2002) Maize Mu transposons are targeted to the 5' untranslated region of the
724
gl8 gene and sequences flanking Mu target site duplications exhibit
725
nonrandom nucleotide composition throughout the genome. Genetics 160:
726
697-716
727
Fernandes J, Dong Q, Schneider B, Morrow DJ, Nan GL, Brendel V, Walbot V
728
(2004) Genome-wide mutagenesis of Zea mays L. using RescueMu