VOLUME 17 ISSUE 1 (2019), Page 292 – 304
MEASURING PUBLIC ASSET PERFORMANCE USING OUTPUT-BASED APPROACH: EVIDENCE FROM INDONESIA
Intan Puspitarini1 & Muhammad Heru Akhmadi2
School of Financial Management
POLYTECHNIC OF STATE FINANCE STAN, INDONESIA
Abstract
Indonesia’s Central Government 2016 Fiscal Year Financial Report shows that the proportion of the total value of public assets owned by the Central Government (known as State-Owned Assets/SOAs) was very significant to the total value of its asset in the balance sheet, which was 40%. While the total value of SOAs sat on IDR 2,200 trillion, the total asset in the balance sheet reached IDR 5,456.88 trillion. Such significant value of SOAs consequently requires the Indonesian government to develop an asset management strategy to effectively and efficiently manage SOA. The utilization of SOAs is one of the tools employed by the government to ensure that capital expenditures spent have been fitted to their intended use. With this premise, it is important for the Government to measure the performance of SOAs. The purpose of this study is to derive a simple and convenient equation using output-based approach to measure SOAs performance that may be used as a reference for the government in devising its policies. This research used the qualitative method with literature study and field testing through a study case. The research object is limited to SOAs in the form of office buildings. The results indicate that measuring SOAs performance using the proposed formula is applicable to SOAs in Indonesia, particularly those in the form of office buildings. Through such performance assessment, the potential of idle assets is expected to be minimized, and public asset planning process becomes more efficient by creating several alternative cost requirements over a certain period of planned asset output.
INTRODUCTION
Good governance puts its emphasis on the improvement of the public sector management system to increase efficiency, effectiveness, productivity, and competitiveness in service provision (Gumede & Dipholo, 2014). To conduct good governance, the Government of the Republic of Indonesia has reformed its National Finance, with the aim of restructuring the management of its national finance. This reform started by the issuance of 3 laws, those are: Law 17/2003 on National Finance, Law 1/2004 on National Treasury, and Law 15/2004 on National Audit. Through financial reforms, the government has committed to improve the quality of financial information of the country, in terms of assets, debt, and investment.
To manage public assets in national level, or what is known as State-Owned Asset (SOA), the Indonesian government has regulated the implementation of SOA management at the Central Government level. Article 42 verse (2) of Law 1/2004 on National Treasury stipulates that procurement of SOA is fundamentally meant to be utilized in the conduction of government duties and functions. If there are SOAs not being utilized for the conduction of government duties and functions, Governmental Regulation 27/2014 states that it is mandatory for the Line Ministries serving as the Asset User to hand over the SOA to the Minister of Finance as the Asset Manager, of which in this case is the responsibility of the Directorate General of State Assets Management (DGSAM).
There are, however, some problems confronted by the Government in maximizing the use of existing SOAs. Firstly, the existence of idle SOAs, which are SOAs that are currently not and are not going to be utilized in the conduction of government duties and functions. The 2015 annual report concerning Idle Public Property issued by the Ministry of Finance (MOF) shows that MOF as SOA Manager was in possession of idle assets worth more than IDR 26 billion – some have been unused for years (LBMN, 2016). This figure does not include idle assets maintained by line ministries, which had either been reported without completing the handover process to the MOF, or those that had not been reported by any means as line ministries failed to recognize them as idle assets. Although idle assets pose a significant problem, their whereabouts can be identified and mapped out by the line ministries.
According to PMK No. 71/PMK.06/2016 on the Management of Idle SOAs for Conduction of Line Ministries Duties and Functions, the idle asset is defined as SOAs in the form of land and/or buildings that are not utilized for the interest of conducting line ministries duties and functions. Based on this definition, the existence of idle assets tends to be easily identified. Hence K/L as Asset Users will be able to map out these assets and implement proper strategies to address them. Attention needs to be given to the existing assets that are not performing optimally. Some instances are empty unused floor areas, abandoned rooms that have been made into temporary storages then eventually forgotten and become permanently idle. These spaces are supposed to be maximized for fulfilling the needs of K/L, yet the crux of the matter lies in how we can measure or assess the optimal utilization of a certain asset. Or in other words, how can we best measure the performance of an asset? As of current, the Government has yet to acquire a tool for measuring asset performance (DJKN, 2017). In response to this issue, this paper proposes a simple and convenient equation on how to measure SOA performance that may be used as a reference for the government in devising its policies.
RESEARCH METHODOLOGY
LITERATURE REVIEW
In the concept of public finance management, asset performance is a part of asset management strategy intended to be aligned with spending/expenditure strategy to accomplish organizational objectives (Brown & Humphrey, 2005). This synergy indicator is apparent with the implementation of Law 1/2004. It shows the strategic role of public assets management as one of the significant indicators in controlling national budget and as an effort of realizing accountability in national financial management (Hadiyanto, 2009).
Provision of public assets is a part of the government’s efforts in providing public services. The concept of improving service provision is known as New Public Management (NPM), which refers to bureaucratic reforms of administration and finance in the public sector. The NPM concept assumes that management practices in the private sector are far more superior than public sector management. Several management practices in the private sector that are considered superior, among others, are performance assessment, performance-based promotion and compensation system, cost management, flexible structure, and more advanced budgeting and accountancy system. While the traditional public-sector management system merely draws attention to policy, the NPM management system puts more emphasis on performance.
Public sector management is, thus, expected to improve and become more professional by implementing NPM practices. Concerning the implementation of NPM, change in public assets management and its relevant policies is one of the biggest challenges that must be confronted (Grubisic, Nusinovic, & Gorana, 2008). Study results from Ball et al. (Ball, 1999) show the significant impact that reform in public sector financial management has on fiscal consumption. Their study concludes that an impetus is necessary to maintain control over the efficient use of resources and public expenditure as well as to proactively strengthen the level of accountability pertaining to public resources management, of which public asset is a part of. Tanzi and Prakash (Tanzi & Prakash, 2000) argued that the habit of correlating efficiency with public spending, as is commonly done, may produce erroneous results if government institutions were to utilize public assets without calculating their cost of utilization.
success of budget retrenchment as an impact of successfully integrating the process of planning and asset management (Hadiyanto, 2009).
The study conducted by Gibson (Gibson, 1994) found that while there had been significant progress made in capturing the quantity and quality of information pertaining to public assets, there was nonetheless a problem in making effective management use of such information. Management could not make effective use of information because there was no performance benchmarking system with appropriate performance indicators. Performance benchmarking of fixed public asset helps to establish if property resources are being managed in an efficient and effective manner (Ngwira & Manase, 2016). Ngwira et al. (2016) also found that performance measurement is a part of monitoring and oversight of public fixed asset management. It is derived to determine whether the management processes are appropriate, whether the intended asset performance and service delivery outcomes are achieved, and whether all the parties are accountable for fulfilling their responsibilities and roles (Columbia, 2002).
Based on service plans of a government agency, asset managers set their departmental standards of fixed asset services. Supervisors, in turn, stipulate their sectional standards as well as individual job standards (Hitt, Middlemist, & Mathis, 1989). Performance standards established by managers of different levels must be results-oriented, comparative, diverse and balanced, stable, realistic, and able to withstand scrutiny (Ngwira et al., 2016). Fixed asset management performance is monitored and measured against all established standards and specific indicators. Generally, appropriate feedback is also simultaneously provided regarding variances between actual results and expected standards, underlying causes, and corrections and improvements to be made (Columbia, 2002).
Output Based Approach in Measuring Asset Performance
Optimization of existing SOAs can only be accomplished when apparatuses for measuring asset performance have been made. An effort that can be carried out to find out the asset performance employed by the line ministries is by measuring the performance value of an asset. One study done by Almeida and Felix in 2006 concluded that the output-based approach, which compares the actual and potential output levels of public assets, should be applied in order to assess public asset performance (Almeida & Félix, 2006). This approach was developed from Okun (1962) who had introduced a method of measuring output gap. It is a method developed from the Gap Theory, which had been introduced by Wicksell and Keynes (Hauptmeier, 2009), and is known as the Keynesian Concept of Inflationary Gap. In the concept of management, this approach is known as ‘utilization.’ The concept of utilization is calculating opportunity gap, i.e., measuring the difference between what an asset can produce and what it produces. The actual output ratio could be attained if the percentage of asset utilization approaches 100% (Ellis, 1998).
The development of this utilization concept produced asset utilization indicators, to determine conditions of being fully utilized, underutilized, or unutilized/idle. The three forms of utilization are calculated based on the percentage of asset utilization. By having such performance measurement tool, the performance of each SOA is expected to be properly captured, and quality of public services, in terms of public asset, can subsequently be monitored and be provoked to continue to improve. Mathematically, Asset Utilization can be formulated as follows (Ellis, 1998):
Actual Output (AO) is the value of asset unit/size/volume that is utilized in the conduction of line ministries duties and functions including for providing public services. Potential Output (PO) is the value of asset unit/size/volume that can be utilized in the conduction of line ministries duties and functions including for providing public services. The percentage of Asset Utilization (AU) indicates the value of asset unit/size/volume that has successfully been accomplished in terms of asset utilization. Subsequently, the following equation is used to calculate the value of opportunity gap an asset may have (Ellis, 1998):
The above asset utilization equation was further developed then implemented on SOAs in the form of state-owned office buildings. This consideration is because such asset had substantial value in terms of its portion in
AU = Actual Output (AO) X 100% Potential Output (PO)
the balance sheet of Indonesia’s Financial Report. In the 2016 report, it is clear that the total value of office building assets owned by the government retained a 40% portion of the total value of assets, which was ± IDR 2,200 trillion of the total IDR 5,456.88 trillion total recorded on the balance sheet (2016 Fiscal Year SOA Report). From the figure above, SOA value in the form of buildings is quite significant, with a 9% percentage of the total value of SOAs.
Another point to consider is that office building currently has a standard as a basis for building utilization potential plan which was instructed by the Minister of Finance through the Minister of Finance Regulation (PMK) No. 7/PMK.06/2016 on the amendment of PMK No. 248/PMK.06/2011 on Assets Standard and Needs Standard of State-Owned Assets in the form of Land and/or Building. This standard is subsequently used as the optimal output of office building utilization. Currently, office buildings are used for supporting in the implementation of line ministries duties and functions to provide public services. However, there is the possibility of utilizing office building spaces for other uses such as ATM centers, non government offices, and meeting rooms.
FINDINGS – PROPOSED CONCEPTUAL FRAMEWORK
In this study, the equation for measuring SOA performance was developed in line with the concept of opportunity gap, and it was implemented on office building SOAs. In accordance with laws and regulations on SOA management, the procurement of an SOA is essentially intended for conducting government duties and functions. If an SOA were not utilized for the conduction of government duties and functions, PP No. 27/2014 stipulates that the SOA should be handed over by the line ministries as the Asset User, to the Minister of Finance as the Asset Manager. PP No. 27/2014 also states that if an SOA were not utilized for the conduction of government duties and functions, then utilization of said SOA can be carried out by engaging in third-party collaboration, via mechanisms of leasing, rent, build-operate-transfer/build-transfer-operate, or utilization cooperation.
Based on the provisions stated in the above regulation, this paper proposes a formula to measure SOA performance as the total obtained by adding up asset performance (KA) for conducting duties and functions (KATUSI) and
asset performance for utilization (KAMAN). The equation developed was made by
accommodating provisions on SBSK (Assets Standard and Needs Standard) written in PMK No. 7/PMK.06/2016. Description relating to the calculation of Office Building SOA Performance for the Conduction of Duties and Functions (KATUSI) and for Utilization (KAMANFAAT) is elaborated further in the following
section:
Calculating Office Building SOA Performance for Duties (KATUSI)
By accommodating the stipulations on SBSK written in PMK No. 7/PMK.06/2016, the performance of SOA was formulated to be the total number of employees (potential) multiplied by the need for building space per employee based on their title and function then added by the dimension of supporting facilities, and dimension of dead space (if any). The equation is thus formulated as follows:
Apparently, calculating office building SOA performance can be done by comparing the value of actual assets currently utilized to the value of assets suggested and contained in the Asset Standard and Needs Standard (SBSK). Different from the LSBSK calculation above, which is based on the number of
potential employees, the actual value (LACT) calculation is based on the number
of an actual number of employees at a given point in time. The equation is formulated as follows:
Hence, the percentage of office building SOA Performance utilized for the conduction of duties and functions (KATUSI) can be presented as follows:
% KATUSI = LACT / LSBSK x100%
Calculating Office Building SOA Performance for Utilization (KAMANFAAT)
The value of asset utilized is the real value produced through the collaboration between the line ministries and their Partners. Collaboration conducted with a partner to set up a Café for guests, is an example. In this case, the calculated values are real values of the booth, sitting area for costumers, storage space, and pantry. Based on such consideration, the authors formulated an equation relating to the value of utilized asset performance as follows:
Calculating Office Building SOA Performance for Duties (KATUSI)
Based on the equations above, the total performance value of office building SOA is likely to be acquired by employing the following formulation:
L SBSK = ∑ (amount of employees (potential) x dimension of building space per function)
+ ∑ dimension of facilities + ∑ dimension of dead space (if any)
L ACT = ∑ (amount of employees (actual) x dimension of building space per function)
+ ∑ dimension of facilities + ∑ dimension of dead space (if any)
MEASURING ASSET PERFORMANCE: A CASE STUDY
To test the possibility of applying the equations formulated above, a case study measuring the performance of a building in one of the line ministries, namely the Coordinating Ministry for Maritime Affairs (CMMA), has been conducted. The data used in this study is based on the 2016 Fiscal Year State-Owned Asset Needs Plan data.
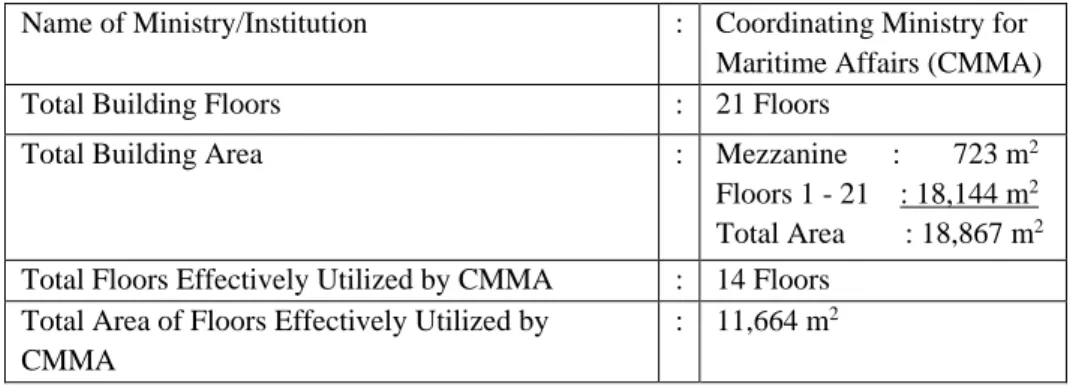
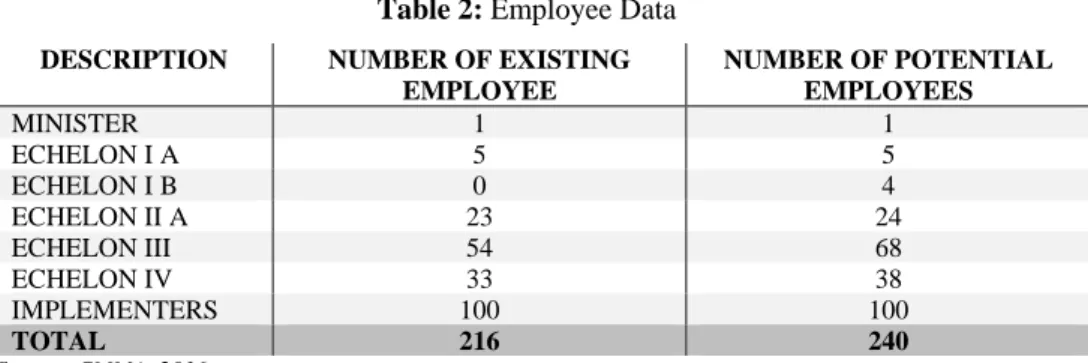
CMMA occupies a 21-story building in the Central Jakarta area to conduct its duties and functions. The building is shared with a few other line ministries, namely the Indonesian National Standardization Agency (BSN) and the Indonesian Agency for the Assessment and Application of Technology (BPPT). Several data, shown in the tables below, had been collected to calculate SOA performance of the CMMA. Table 1 shows building specifications. Table 2 contains data on building dimension and utilization. CMMA utilizes 14 of the total 21 available floors, wherein each floor has an area of 864 m2. Most of the area on the 17th floor is occupied by the BPPT, leaving a total area of 11,664.00 m2 (12,096 m2 – 432 m2) to be utilized by CMMA. Table 3 contains data relating to the number of both existing and potential employees.
The needs standard of SOA in the form of office building refers to the provision regulating Assets Standard and Needs Standard (SBSK) of SOA, which had been established in PMK No. 7/PMK.06/2016 on Assets Standard and Needs Standard of State-Owned Assets in the form of Land and/or Building. Table 4 contains SOA SBSK data concerning workspace and supporting space. Both SOA SBSK in the table is aligned with PMK No. 7/PMK.06/2016.
Table 1: Building Specifications
Name of Ministry/Institution : Coordinating Ministry for
Maritime Affairs (CMMA)
Total Building Floors : 21 Floors
Total Building Area : Mezzanine : 723 m2
Floors 1 - 21 : 18,144 m2
Total Area : 18,867 m2
Total Floors Effectively Utilized by CMMA : 14 Floors Total Area of Floors Effectively Utilized by
CMMA
: 11,664 m2
Source: CMMA, 2016
% KATOTAL =% KATUSI + % KAMAN
Table 2: Employee Data
DESCRIPTION NUMBER OF EXISTING EMPLOYEE
NUMBER OF POTENTIAL EMPLOYEES
MINISTER 1 1
ECHELON I A 5 5
ECHELON I B 0 4
ECHELON II A 23 24
ECHELON III 54 68
ECHELON IV 33 38
IMPLEMENTERS 100 100
TOTAL 216 240
Source: CMMA, 2016
Based on the above data, the necessary area according to SBSK (LSBSK)
had been calculated, and the acquired results are shown in Table 3.
Table 3: Calculation of Expected Dimensional Needs for Office Building
Description
Based on Potential Employee Data
Based on Existing Employee Data
Officer Area (SBSK)
Total Area (m2)
Officer Area (SBSK)
Total Area (m2)
Work Space
1 Minister Room 1 223 223 1 223 223
2 Echelon I A 5 102 510 5 102 510
3 Echelon I B 4 79 316 0 79 0
4 Echelon II A 24 70 1,680 23 70 1,610
5
Echelon III non-Office Head
68 21 1,428 54 21 1,134
6
Echelon IV non-Office Head
38 11 418 33 11 363
7 Echelon V / Implementer 100 5 500 100 5 500
Area of SBSK Work Space
240 5,075 216 4,340
8
Total Number of Employee
240
9 Total Number of Staff 100
Supporting Space
10
Main Assembly Room of Ministry
1 140.00 140.00 1 140 140
11
Main Assembly Room for Echelon I
9 90.00 810.00 5 90 450
12
Main Assembly Room for Echelon II
24 40.00 960.00 23 40 920
13 Assembly Room/Aula of Line Ministries
1 400.00 400.00 1 400 400
14 Assembly Room/Aula of Echelon I unit Managers
9 150.00 1,350.00 5 150 750
15 Archive Space (0.4 m2 x
Number of Employee)
96.00 86.40
16 Functional Space (0.8 m2
x Number of Employees)
Description
Based on Potential Employee Data
Based on Existing Employee Data
Officer Area (SBSK)
Total Area (m2)
Officer Area (SBSK)
Total Area (m2)
17 Toilet (5 m2 for every 25
employees)
41.20 37.40
18 Server (0.02 m2 x
Number of Employees)
4.80 4.32
19 Lobby/other facilities (20 m2 per 1000 m2 of gross
area excluding the lobby)
9,069.00 181.38 7300.92 146.01
Area of SBSK
Supporting Space
4,175.38 3,106.93
Floor Area of Building 9,250.38 7,446.93
Floor Area:
Non-Simple Multiple Level Building (dead Space 30% of Building area) *
70.00% 70.00% 70.00%
Gross Floor Area of
Building 13,214.83 10,638.47
*) PMK No. 7/PMK.06/2016 Using the equation of: % KATUSI = LACT / LSBSK x 100%, then % KATUSI
can be calculated as follows: % KATUSI = LACT / LSBSK x 100%
= (10,638.47 : 13,214.83) x 100% = 80%
The source person from CMMA stated that a part of the office building areas is planned to be utilized for the ministry’s partners, that is a total area of ¾ of the floor measuring 648 m2. Hence, KAMAN can be calculated as follows:
% KAMAN = LMAN / LSBSK x 100%
= (648 : 13,214.83) x 100% = 4%
Based on the above calculations, the performance of SOA in the form of an office building at CMMA will be:
% KATOTAL =% KATUSI + % KAMAN
= 80% + 4% = 84%
generating non-tax revenue by leasing the space to third party that meets the regulations requirement.
CONCLUSION
The development of public asset performance measurement is vital for the government to be able to measure how best a certain public asset has delivered its service to the public. Nevertheless, the absence of tools for measuring those performances becomes an important issue. This study proposes a simple and convenient equation on how to measure SOA performance by adopting the Output-Based approach. This study shows that by referring to the case of the CMMA, it is feasible to use the proposed formula to measure SOAs performance, especially for an office building. From applying the formula into the case study and analyze it, it can be concluded that 84% of the CMMA office space has been fully utilized, while 16% of the space is not performing optimally. This study suggests that the CMMA may construct some alternatives of asset utilization scheme and propose them to the Asset Manager. For further research, this paper suggests that other types of public assets such as land, toll roads and dams be measured. This paper also suggests conducting further analysis on how to measure public asset performances using outcome basis for future studies.
REFERENCES
Almeida, V., & Félix, R. (2006). Computing Potential Output and The Output Gap.
Economic Bulletin, p. 73.
Ball, I. (. (1999). Reforming Financial Management in the Public Sector”. Policy. Policy
Study, Reason Public Policy Institute(No. 258 – part 3).
Brown, R., & Humphrey, B. (2005). Asset Management for Transmission and Distribution. Amerika: IEEE Power & energy Magazine.
Columbia, P. o. (2002). Capital asset management framework : Guidelines.
Ellis, R. (1998). Asset Utilization: A Metric for Focusing Reliability Efforts. Houston Texas: Seventh International Conference on Process Plant Reliability.
Gibson, V. (1994). Strategic Property Management: How Can Local Authorities Develop a Property Strategy? Property Management, Vol. 12 Iss 3 , pp. 9-14.
Grubisic, M., Nusinovic, M., & Gorana, R. (2008). From Accountable Government To Public Asset Management Reform and Welfare. Privredna Kretanja i
Ekonomska Politika, 117.
Gumede, N., & Dipholo, K. B. (2014). Governance, Restructuring and the New Public Management Reform: South African Perspectives. Journal of Educational and
Social Research, Vol. 4 No.6, pp. 43 - 50.
Hadiyanto. (2009). Strategic Asset Management: Kontribusi Pengelolaan Aset Negara dalam Mewujudkan APBN yang Efektif dan Optimal.
Hitt, M., Middlemist, R. D., & Mathis, R. (1989). Management: Concepts and effective
practice (3rd ed.). New York: West Publishing Company.
LBMN, P. I. (2016). Laporan Barang Milik Negara TA 2016. LKPP, P. I. (2016). Laporan Keuangan Pemerintah Pusat LKPP.
Ngwira, M., & Manase, D. (2016). Public Sector Property Asset Management. Willey Blackwel.
Tanzi, V., & Prakash, T. (2000). The Cost of Government and the Misuse of Public Assets.
International Monetary Fund