Identifying the Factors of Customer Satisfaction in E-Banking System Case Study: Export Development Bank of Iran
Bahman Vakili
Export Development Bank of Iran [email protected]
Abstract
The purpose of this paper is to identify the factors of customer satisfaction in Export Development bank of Iran (EDBI). In this study, purposive sampling technique was employed to recruit 50 customers classified as government service holder, private service holder and businessmen from all EDBI branches. We have done Kaiser-Meyer-Olkin Measure of Sampling Adequacy, Bartlett's Test of Sphericity, Cronbach's Alpha Reliability Statistics, inter-correlation, factor analysis and factor ranking. This research showed that management information service, service factor, time management and behavioral factor are the key factors which are representing customer satisfaction in EDBI. Management information services is the combination of 7 variables such as computerized service, innovative service, smooth and hassle free, staff availability, skilled and knowledgeable employees, service charge, transparency in services. In addition, service factor amalgamation of 3 variables which are service infrastructure, systematic, accurate service and cordial, customer friendly; helpful employee more over time management factor is also the combination of 3 variables such as waiting time, timely information and effective handling of complaint. Finally, commitment of employees and timely services are constitute of behavioral factor. Among major four factors behavioral factor obtain the highest rank comparing with other factor. The paper contributes to previous research by adding to existing knowledge regarding what constitutes e-banking service. The paper makes key recommendations towards enhancing current online financial services delivery.
Keywords: E-banking, banking services customer satisfaction, correlation, factor analysis
Introduction
In business field, Internet is used widely by masses and has numerous benefits to offer,
especially in E-banking services. Now-a-days, people are so busy in their work lives, that
they don't even have time to go to the bank for conducting their banking transactions. All
banks provide banking facilities to their customers as an additional advantage.
E-commerce is about buying and selling information, products and services via computer
networks such as the Internet and Electronic Data Interchange. banking is one form of E-commerce. More sophisticated E-banking services provide customer access to accounts, the
for loans via E-channels. E-banking largely came into being as a result of technological
developments in the field of computing and communications but there have been a number
of other factors or challenges which played an important part in its development. The
challenges for banks are fourfold. The first, they need to satisfy customer requirements that
are complex and ever changing. The second, they need to deal with increased competition from old as well as new entrants coming into the market. Third, they need to address the
pressures on the supply chain to deliver their services quickly. Finally, they must
continually develop new and innovative services to differentiate themselves from the
competition, as having a large branched network is no longer seen as a main source of
competitive advantage. E-banking is seen by many banks as a key tool to address these
challenges. As a developing country, Iran should try to reach the expected level in global
banking system. So it is our urgent need to upgrade its banking system. Kumbhar (2011)
found that study evaluates major factors (i.e. service quality, brand perception and perceived value) affecting on customers ‘satisfaction in E-banking service settings. This study also evaluates influence of service quality on brand perception, perceived value and
satisfaction in E-banking. Zeithaml, Parasuraman, and Malhotra (2000) found that there is a
very strong relationship between quality of service and customer satisfaction. Nadiri, Kandampully, and Hussain (2009) also focused that the higher level of perceived service
quality results in increased customer satisfaction.
When perceived service quality is less than expected service quality customer will be
dissatisfied. Cronin and Tailor (1992) also conducted survey that satisfaction super ordinate
to quality-that quality is one of the service dimensions factored into customer satisfaction judgment. Pairot (2008) defined that customer’s satisfaction as the company's ability to fulfill the business, emotional, and psychological needs of its customers. However,
customers have different levels of satisfaction as they have different attitudes and experiences as perceived from the company. Customer’s satisfaction is affected by the importance placed by the customers on each of the attitudes of the product/ service.
Santhiyavalli (2011) conducted survey that customer service is an integral part of any
organization. It is necessary to identify the key success factors in terms of customer satisfaction so as to survive for intense competition and increase the market share. Ankit
(2011) investigates that Banking Needs, followed by Core Services, Problem Resolution,
Cost Saved, Convenience , Risk and Privacy Concerns were the major factors that strongly
affect the overall satisfaction of online consumers. On the other hand, Feature Availability
and Consumer Continuation were found to moderately affect the overall satisfaction of
customers using online or internet banking services. Biswas (2012) identified the factors
responsible for determining the customer satisfaction. Singh and Kaur (2011) identify the
factors affecting satisfaction level of customers of Indian universal banks; analyzed the
the study are given below: 1) To analyze the level of customer satisfaction towards
E-banking service. 2) To identify the factors responsible for customer satisfaction in respect
of banking service quality. iii. To rank factors affecting customer satisfaction towards
E-banking service in respect of E-banking services and rank those factor responsible for
customer satisfaction in banks. Santhiyavalli (2011) conducted a study that main objective are studing the customer’s perception of service quality of the select branches of State Bank of India and studied the major factors responsible for their satisfaction.
Method
The study has been done mainly based on primary and secondary sources of data or
information. Primary data has been collected from EDBI data base which are taken
randomly from October to December, 2013.
Primary data collections are done by the interviewing method with a proper
questionnaire. A specifically designed questionnaire was used as a tool and the survey
covered a sample of 50 respondents for the purpose of analysis for 10 different EDBI
branches. The criteria of respondent were 10 government service holder, 30 private service
holder and 10 holding companies. Further, the 15 variables used for factor analysis were coded using 5 point scale likert scale ranging from 5 to 1 for example, ‘Highly Satisfied’ was ranked 5 followed by ‘Satisfied’ with 4, ‘Neither Satisfied nor Dissatisfied’ with 3, ‘Dissatisfied’ with 2 and ‘Very Dissatisfied’ with 1.
Table 1
Descriptive Statistics of Variables
Variables Mean Standard Deviation
Computerized Service (V1) 3.76 1.145
Service Infrastructure (V2) 3.37 0970
Innovation Service (V3) 3.28 0.945
Systematic and Accurate Service (V4) 3.77 0.932
Smooth, Hassel Free (V5) 3.86 1.183
Timely Services (V6) 3.87 0.970
Staff Availability (V7) 3.67 0.956
Waiting Time (V8) 3.39 1.125
Timely Information (V9) 3.68 0.979
Commitment of Employee (V10) 3.58 1.034
Skilled, Knowledgeable Employee (V11) 4.05 1.107
Cordial, Customer friendly, Helpful employee (V12) 3.89 1.083
Service Charge (V13) 3.13 1.263
Transparency in Service (V14) 3.48 1.053
Effective Handling of Complaint (V15) 3.61 1.311
Discussion and Analysis
From this table, we can see that mean value for all variables are above 3 that mean the variables lie between ‘Satisfied’ and ‘Neither Satisfied nor dissatisfied. Surprisingly the mean value of Skilled, knowledgeable employee (V11) is 4.05 that mean the customers are
more satisfied with E-banking service in respect to skilled, knowledgeable employees. To investigate the appropriateness of factor analysis Kaiser-Meyer-Olkin (KMO) and Bartlett’s
test statistics was used which were shown in table-2 and table-3 respectively. If, the KMO
value is greater than 0.6 is considered as adequate (Kaiser & Rice, 1974). A value of greater than 0.5 is desirable. Bartlett’s test measures the correlation of variables. A probability of less than 0.5 is acceptable (Singh & Jain, 2009). From our analysis we found that the value
of Kaiser-Meyer-Olkin Measure of Sampling Adequacy is .762 that is greater than 0.06
indicates the value of Kaiser-Meyer is acceptable and the value of Bartlett's Test of
Sphericity is also statistically significant and acceptable.
Table 2
KMO and Bartlett's Test Result for E-Banking
Kaiser-Meyer-Olkin Measure of Sampling Adequacy .762 Bartlett's Test of Sphericity Approx. Chi-Square 845.706
df 105
Sig. .000
Source: Computed from Primary Data
Table 3
Cronbach's Alpha Reliability Statistics
Cronbach's Alpha Number of items
.877 15
Source: Computed from Primary Data
To check multidimensionality of customer services and satisfaction, coefficient Alpha
was computed separately for all variables identified. In the present study, Alpha
coefficients value was 0.877, which is much higher than 0.7, indicating good consistency among the items variables and for a measure to be acceptable, coefficient Alpha should be
Scree Plot
Component Number
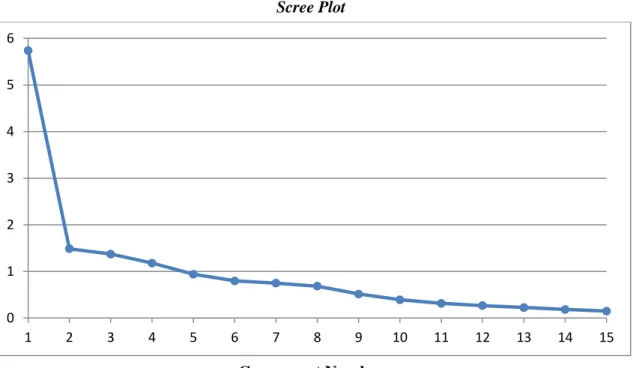
Figure 1. Scree plot showing the eigen values.
The Scree test was used to identify the optimum number of factors that can be extracted
before the amount of unique variance begins to dominate the common variance structure.
The scree test was derived by plotting the latent roots against the number of factors in their
order of extraction, and the shape of the resulting curve was used to evaluate the cut off
point (Cattel, 1966). The scree plot demonstrated (Figure 1) the Eigen values for initial 15
components or factors extracted in the study. Starting with the first factor, the plot slopes
steeply downward initially and then slowly became an approximately horizontal line. The
point at which the curve first begins to straighten out was considered to indicate the number of factors to extract. In the present case, as we have the Eigen value more than 1, hence, 4
factors have been considered. All factors beyond 1 for which these Eigen values level off were excluded from consideration (Cattel & Vogelman, 1977).
0 1 2 3 4 5 6
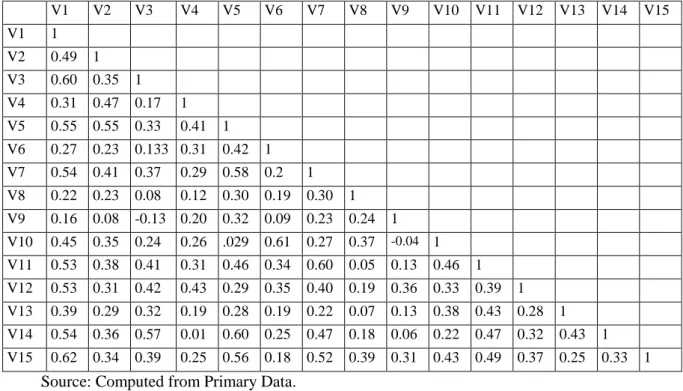
Table 4
Inter-correlation of Variables
V1 V2 V3 V4 V5 V6 V7 V8 V9 V10 V11 V12 V13 V14 V15
V1 1
V2 0.49 1
V3 0.60 0.35 1
V4 0.31 0.47 0.17 1
V5 0.55 0.55 0.33 0.41 1
V6 0.27 0.23 0.133 0.31 0.42 1
V7 0.54 0.41 0.37 0.29 0.58 0.2 1
V8 0.22 0.23 0.08 0.12 0.30 0.19 0.30 1
V9 0.16 0.08 -0.13 0.20 0.32 0.09 0.23 0.24 1
V10 0.45 0.35 0.24 0.26 .029 0.61 0.27 0.37 -0.04 1 V11 0.53 0.38 0.41 0.31 0.46 0.34 0.60 0.05 0.13 0.46 1
V12 0.53 0.31 0.42 0.43 0.29 0.35 0.40 0.19 0.36 0.33 0.39 1
V13 0.39 0.29 0.32 0.19 0.28 0.19 0.22 0.07 0.13 0.38 0.43 0.28 1
V14 0.54 0.36 0.57 0.01 0.60 0.25 0.47 0.18 0.06 0.22 0.47 0.32 0.43 1
V15 0.62 0.34 0.39 0.25 0.56 0.18 0.52 0.39 0.31 0.43 0.49 0.37 0.25 0.33 1
Source: Computed from Primary Data.
Inter-correlation among the variables were calculated and presented in the table-4.
Almost all the cases, correlation coefficient of variables were found statistically significant,
hence included as the factor influencing the level of customer satisfaction in respect of
banking services. The inter-correlation analysis suggests that out of 15 variables 4 were
closely related as the values of correlation co-efficient were relatively high in their cases.
This indicated that all these variables could be reduced to 4 factors. These variables
demonstrated higher correlation coefficients and were statistically significant at 1 percent
and 5 percent levels. The meaningful way was to look for substantive significance by
deciding on the minimum contribution of factor should make 1 percent and 5 percent
(Cattel& Vogelman, 1977).
Table 5
Total Variance Explained
Total Variance Explained
C o m p o n en
t Initial Eigen Values Extraction Sums of Squared Loadings
Rotation Sums of Squared
Loadings
Total % of
Variance
Cumulative
%
Total % of
Variance
Cumulative
%
Total % of
Variance
Cumulative
%
1 5.739 38.258 38.258 5.739 38.258 38.258 3.911 26.072 26.072
2 1.487 9.911 48.169 1.483 9.911 48.169 1.991 13.274 39.346
3 1.372 9.145 57.314 1.372 9.145 57.314 1.988 13.252 52.598
Total Variance Explained C o m p o n en
t Initial Eigen Values Extraction Sums of Squared Loadings
Rotation Sums of Squared
Loadings
Total % of
Variance
Cumulative
%
Total % of
Variance
Cumulative
%
Total % of
Variance
Cumulative
%
5 .941 6.271 71.453
6 .797 5.314 76.766
7 .749 4.996 81.762
8 .684 4.559 86.321
9 .516 3.438 89.759
10 .392 2.612 92.371
11 .316 2.103 94.475
12 .267 1.783 96.258
13 .227 1.512 97.770
14 .184 1.230 98.999
15 .150 1.001 100.000
Source: Computed from Primary Data
The first step for interpreting the output was to look at the factors extracted, their eigen
values and the cumulative percentage of variance. We could see from the cumulative
percentage column that the importance of the attributes (i.e. 4 factors) extracted together
account for 65.18 % of the total variance (information contained in the original 15
variables). This indicates that we lost only 34.82% of the information contained into the
original variable. Now, the most important thing was that of interpreting what these 4
extracted factors represent out of 50 samples.
Table 6
Factor Loading along with Eigen Value
Component Matrix
Component
Transparency in Service (v14) Factor-1 Factor-2 Factor-3 Factor-4
Timely Services (V6) .820 -.097 .138 .098
Computerized Service (V1) .805 .132 -.115 .019
Skilled, Knowledgeable Employee (V11) .728 .307 .225 .178
Smooth, Hassel Free (V5) .643 .314 .102 .238
Staff Availability (V7) .621 -.055 .540 .210
Service Charge (V13) .602 .230 .452 .009
Innovation Service (V3) .509 .203 -.059 .233
Systematic and Accurate Service (V4) .045 .881 .062 .170
Cordial, Customer friendly, Helpful
employee (V12)
. 324 .685 .240 .130
Service Infrastructure (V2) .440 .463 .071 .170
Component Matrix
Component
Waiting Time (V8) .035 -.085 .644 .428
Effective Handling of Complaint (V15) .499 .183 .569 .127
Commitment of Employee (V10) .255 .168 .039 .867
Timely Information (V9) .126 .204 .103 .790
Source: Computed from Primary Data
In this study, we have considered the highest value in a given row which is shown in
table-6.From this table, we can see that factor-1 is a group of 7 (seven) variables names
Computerized Service, Innovative Service, Smooth and Hassel Free, Staff availability,
Skilled and knowledgeable employee, Service Charge, Transparency in services had
loading 0.728, 0.805, 0.621, 0.602, 0.643, 0.509, 0.820 respectively. Factor-2 is
combination of 3 variables Service Infrastructure, Systematic, Accurate Service and
Cordial, Customer friendly, Helpful employee had loading 0.463, 0.881, and 0.685 respectively. Factor-3 is combination of 3 (three) variables Waiting Time, Timely
Information and Effective handling of Complaint had loading 0.644, 0.761, and 0.569
respectively. Factor-4 is included 2 (two) variables Commitment of employee and Timely
Services had loading 0.790, 0.867 respectively.
Table 7
Factor Affecting Customer Satisfaction
Factor Variables
Management Information Service (Factor-1)
Computerized Services (V1), Innovative Service (V3), Smooth, Hassel free (V5), Staff Availability (V7), Skilled,
Knowledgeable Employee (V11), Service Charge (V13), Transparency in Service (V14).
Service Factor (Factor-2) Service Infrastructure (V2), Systematic and Accurate Service (V4), Cordial, Customer friendly, Helpful employee (V12). Time Management (Factor-3) Waiting Time (V8), Timely Information (V9), Effective
Handling of Complaint (V15).
Table 8
Factor Ranking
Factor Mean Value Factor Ranking
Management Information service (Factor-1) 3.60 3
Service Factor (Factor-2) 3.67 2
Time Management (Factor-3) 3.55 4
Behavioral Factor (Factor-4) 3.73 1
Source: Computed from Primary Data
Mean value of each factor is calculated based on the mean value of all variables
included under a particular factor. In addition, factor ranking has been done based on the
mean value.
Conclusion
In our study most of the variables are correlated with each other. Among 15 variables 4
major factors are responsible for customer satisfaction in EDBI. These factors are named
Management Information service (Factor-1), Service Factor (Factor-2), Time Management
(Factor-3) and Behavioral Factor (Factor-4) Moreover, basis on mean value factor ranking
has been made. E-banking, the latest generation of electronic banking transactions, opened
up new window of opportunity to the existing Iranian banks and financial institutions. Most
of the Iranian banks including EDBI have their own websites but not all of them offer complete internet facilities. The main reason of this is that the core banking does not have
developed and widespread enough through the whole country. This research seeks to make
an original contribution to knowledge by investigating the impact of E-banking factors on
outcomes of customer satisfaction in Export Development Bank of Iran. This research
contributes to the services marketing discipline in finding out the role of the E-banking in
enhancing customer satisfaction and loyalty. However, with banking customers growing
increasingly comfortable with the digital lifestyle, but still many Iranian customers are not
aware about E-banking and its functions. Some of them not fully understand the power of
technology and seek to leverage it to enjoy better control over their banking operations. To
conclude that E-banking also provided other benefits. For instance, creating new markets,
and reducing operational costs, administrative costs and workforce are increasingly important aspects for the bank’s competitiveness, and E-banking improved these aspects as well. So, Iranian banks including EDBI should take these advantages of E-banking in Iran
economy as early as possible.
References
Ankit. S. (2011). Factors influencing online banking customer satisfaction and their
Information and Knowledge Management, 1(1).
Biswas, (2012). Determinants of customer satisfaction in bank-An empirical investigation.
Anvesha, 5 (1).
Cattel, R. B. (1966). The screen test for the number of factors. Multivariate Behavioral
Research, April (1), 245-276.
Cattel, R. B., & Vogelman, S. (1977). A comprehensive trial of the screen and the KG
criteria for determining the number of factors. Multivariate Behavioral Research,
289-325.
Cronin, J., & Taylor, S.A. (1992). Measuring service quality: A reexamination and
extension. Journal of Marketing, 56 (July), 55-68.
Kaiser, H. F., & Rice, J. (1974). Little jiffy mark iv. Educational and Psychological
Measurement, 34(1), 111-17.
Kumbhar V.M (2011). Factor affecting the customer satisfaction in e-banking: Some
evidences from Indian banks management. Research and Practice, 3 (4), 1-14.
Nadiri, H., Kandampully, J., & Hussain, K. (2009). Zone of tolerance for banks: A
diagnostic model of service quality. The Service Industries Journal, 29 (11), 1547 -
1564.
Nunnally, J. C. (1978). Psychometric Theory. New York: McGraw-Hill.
Pairot R. (2008). Members’ satisfaction of fitness service quality: A case study of
California wow experience public company limited, presented in partial fulfillment of
the requirements for the master of arts degree in business English for international
communication. Srinakharinwirot University.
Santhiyavalli G. (2011). Customer’s perception of service quality of state bank of India: A factor analysis. International Journal of Management & Business Studies, 1(3).
Singh, R., & Jain, M. (2009). Metro trains and customer satisfaction: An empirical study in
Delhi. Cabell’s Management Directory, 6(2).
Singh. J., & Kaur G. (2011). Customer satisfaction and universal banks: An empirical
study. International Journal of Commerce and Management, 21 (4), 327-348.
Zeithaml, V.A., Parasuraman, A., & Malhotra, A. (2000). A Conceptual framework for understanding e-Service quality: Implications for future research and managerial