131 |
P a g e
International Journal of Pharmaceutical
Development & Technology
e ISSN - 2248 - 910X
www.ijpdt.com
Print ISSN - 2248 - 9096COMPARATIVE EVALUATION OF A COLORIMETRIC
MICROTITRE PLATE ASSAY IN DETERMINING THE MINIMUM
INHIBITION CONCENTRATION OF ANTIMICROBIALS AND
PRESERVATIVES IN COSMETIC AND TOILETRY FORMULATIONS
Z.P. Bhathena
1*& N.J. Desai
21 Department of Microbiology, Bhavan’s College, Munshi Nagar, Andheri (West), Mumbai 400058, India.
2Bhavan’s Research Center (Microbiology), 5th Floor, Palanji Sadan- SFC Building, Bhavan’s College Campus, Munshi Nagar,
Andheri (West), Mumbai 400058, India.
ABSTRACT
Preservatives and antimicrobials are commonly used in cosmetic and toiletry products in order to increase the shelf life of the products. Thus the effective concentration of these chemical agents is one of the most critical points in formulation of cosmetics/ toiletries. Though there are some standard tests to determine the efficiency of antimicrobial preservatives in personal care products, no effective method is available that could determine the in situ presence of the antimicrobials and whether the required concentration is achieved within the final product. Personal care products when assayed for their anti-microbial contents by routine methods suffer due to the inherent turbidity of the product, thus the conventional method was miniaturized using a 96 well microtitre plate. An indicator colorimetric assay was developed to overcome the routinely used two step system of determining the MIC and MCB by test tube dilution followed by agar spotting. The methods were compared and assessed to develop a standardized technique for determining the in situ minimum inhibitory concentration of the preservative in cosmetic and toiletry formulations with the micro dilution assay being most accurate followed by micro dilution indicator dye assay followed by the conventional macro dilution assay.
Keywords: Antimicrobials, Cosmetic preservatives, Micro dilution assay, Macro dilution assay, Indicator dye assay, 2, 3, 5-Triphenyltetrazolium chloride (tetrazolium salt).
INTRODUCTION
Cosmetics and toiletries have become an essential commodity used for personal hygiene. Cosmetics and toiletries are made using raw materials that generally do not allow contamination, recontamination or easy proliferation of the microorganisms. In spite of that, these products must be adequately preserved or protected from microbial contamination and spoilage as they are repeatedly challenged by microorganisms present in saliva, on dirty hands, and in tap water [1]. Thus such microbes if retained within these products can lead to its spoilage, detected by discoloration, production of gas, and odor formation in the product besides being a cause for potential health hazards due to the presence and survival of opportunistic pathogens like Enterobacter spp., Klebsiella spp., Serratia spp., and
Pseudomonas spp. [2].
Antimicrobials and preservatives, due to their obvious mode of action, are widely used in products to
inhibit the survival of any potential spoilage or pathogenic organism. Such additions aim at negating the chances of microbial survival within these anhydrous products that may be contaminated or moistened during use to a minimal rate of recurrence [3]. However the adequacy of the preservation needs to be equated with the potential risk to the user, as infection or colonization with dermal or oral microorganisms is dependent on the route of application and the susceptibility of the user to the infection. Precise definition of effective preservation therefore is difficult, as opinions differ based on individual experience with distinct preservatives and formulations such that, recommendations and guidelines contained in different compendia are conflicting [4]. Thus though the preservatives are added within the formulation, it is not necessary that that effective concentration is homogenously present and the concentration is not negated through the interaction of other
132 |
P a g e
ingredients. Thus the personal care products after preparation need to be assessed for their effectiveness against the target organisms to achieve its utmost efficacy [5,6]. Though various test methods such as challenge test, determination of the D value and capacity test [7] have been optimized and modified regularly in order to achieve the ideal testing protocol, one still needs to establish a standard method for determining the effectiveness of the preservatives after introducing them in the formulation as no standard prescribed test method for determining the Minimum Inhibition Concentration of the same after the formulation has been developed.
In lieu of the above thought process, we have attempted to develop a standard method for determining the effectiveness of the preservatives in formulations using the MIC method described for antimicrobial drugs, by optimizing and miniaturizing the conventional tube method besides evaluating the use of an indicator dye to evaluate the MBC value .
MATERIALS AND METHODS Material(s):
Samples: Samples consisted of commercially available
antimicrobial hand wash, soap bar and an antibiotic (streptomycin).
Antibiotic preparation: The stock solution for the antibiotic streptomycin was prepared by dissolving the antibiotic in sterile distilled water to attain a final concentration of 1600 µg/ ml in TSB broth.
Liquid soap sample preparation: The Liquid hand wash was weighed using sterile containers and a final concentration of 16% (wt/vol) was prepared. The stock solution was further diluted as and when required to prepare working stock concentration in TSB broth of 16% when tested against E. coli ATCC 11229, 8% when tested against
S. aureus ATCC 6538; and of 0.12% for C. diphtherieae
ATCC 13812 respectively.
Solid soap sample preparation: The solid soap bar was grated and weighed using sterile grater and containers; the stock solution was homogenized using a magnetic stirrer with a constant temperature of 45o C to attain a concentration of 16% (wt/vol). The stock solution was further diluted as and when required to prepare working stock concentration in TSB broth of 16% when tested against E. coli ATCC 11229, 8% when tested against S.
aureus ATCC 6538; and of 0.12% for C. diphtherieae
ATCC 13812 respectively.
Method(s):
Bacterial Growth Curve kinetics:
18 hr old metabolically active cultures grown at 37o C of E. coli ATCC 11229, S. aureus ATCC 6538, C.
diphtheria ATCC 13812 was prepared in sterile saline to
attain cell density of 1.0 x 10⁸ CFU/ml after which dilution
were carried out in TSB to obtain suspensions of the inoculums ranging from 0.01 to 0.10 optical density detected at 620 nm respectively.
In a 96 well flat bottom microtitre plate (Tarson, India), 200 μL of TSB (HiMedia) was added into each of the well followed by addition in duplicates of 30 μL of the three cultures at the various cell densities. The growth curve kinetics was studied in PowerWave XS spectrophotometer (Biotek Inc., USA) using the Gen 5 software. Growth kinetics of cultures through determination of its lag period, tmax value using Gen 5 software was ascertained to obtain
the breakpoint value.
Micro dilution (serial dilution) assay of the soap samples:
Serial dilution of the hand wash and soap bar formulations were performed in duplicates using a multichannel pipette in a 96 well microtitre plates such that in a final volume of 200 µL of TSB, the MIC assay range attained for E. coli was 16% to 0.008% (row A1 to A12);
for S. aureus, 8% to 0.04%( row C1 to C12); and for C.
diphtheria, 0.12% to 0.00006% (row E1 to E12), using 30
µL as the inoculum volume. Similarly the MIC range for antibiotic streptomycin assay was attained from 1600 µL/ ml to 0.195 µL/ ml for all the three cultures. Respective positive growth controls, medium controls and the soap samples controls were maintained throughout the study. The plates were incubated at 30o C for 24 hrs maintaining the humidity levels in the incubator to avoid evaporation and the results were read using PowerWave XS spectrophotometer (Biotek Inc., USA) equipped with the Gen 5 software.
Indicator dye Micro dilution assay using 2, 3,
5-Triphenyltetrazolium chloride (TTC):
Since the above method is based on reading turbidity that cannot be very full proof, a further adaptation of the above method was undertaken wherein the use of indicator system of 2, 3, 5-Triphenyltetrazolium chloride,
after 24 hours of incubation of the micro dilution assay was
set up. 30 µL of 0.1 % TTC was inoculated and the plates further incubated at 30o C for 12 hours and the MIC value was interpreted on the basis of the development of the red coloration read using PowerWave XS spectrophotometer (Biotek Inc., USA) equipped with the Gen 5 software.
Minimum Bactericidal Concentration (MBC) assay:
For comparative analysis a traditional macro tube serial dilution tube assay system to ascertain the MIC values within a total volume of 5 ml was also set up [8].
133 |
P a g e
and negative controls were also spotted on the TSA plates to ensure the quality checks for the media used [9]. The experiments related to MIC were repeated in 12 sets to determine the repeatability and reproducibility of the methods under evaluation expressed as standard deviation.
RESULTS AND DISCUSSION
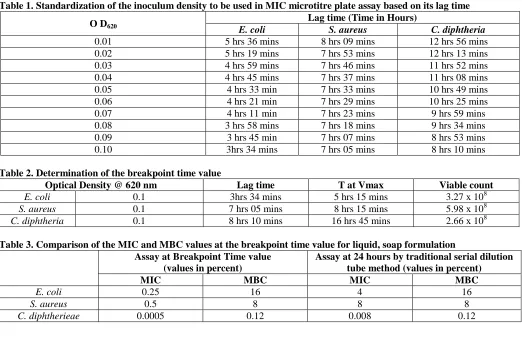
Preservation of cosmetics and toiletries is necessary to prevent formulations from being infected with resistant and hazardous microorganisms during their repeated use. Since there are no internationally agreed standards for use of preservatives owing to the diversity of the microbial load, the preservative efficacy of a formulation cannot be predicted and has to be established empirically by microbial challenge, as the biocidal or biostatic activity of the preservative is dependent not just on the effect of individual ingredients of the preservative but also on retaining its effect within a formulation that contains various ingredients that have a potential of decreasing its efficacy [4]. Thus a quick and efficient method that takes into account the volume of load besides being cost effective needs to be established to ascertain the efficacy of prepared formulations in preventing spoilage within the substrate matrix. Although NCCLS recommends the use of Mueller Hinton medium for susceptibility testing the Trpticase Soy Broth (TSB) media showed comparable results with most of the tested bacterial strains by various authors [10] and thus was used in this study. Traditional susceptibility testing methods use the Mac Farland standards to ascertain the inoculum size, but as this method is subjective and operator driven besides making it difficult to compare different bacterial species [11], a set of graphs of viability curves for each strain of bacterial species used was prepared and a final concentration of 1.0 x 10⁸ cfu/ ml was adopted (Table 1). This was based on the fact that the optical density of the inoculum of 0.1 at 620 nm yielding a count of 1 x 10⁸ cfu/ ml gave the least lag time of 3 hrs 34 mins for E. coli, 7 hrs and 05 mins for S. aureus and 8 hrs and 10 mins for C.
diphtheria respectively.
A breakpoint is defined as the MIC value that differentiates the organisms as “Sensitive” or “Resistant” and is ideally based on the obtainable serum or tissue concentrations of the antimicrobial agent [12]. Though these values were published in details for the various antimicrobial/ antibiotic agents by various authors [13-20] there is no sufficient relevant data on the breakpoint values of the preservatives for the microbial isolates. Hence, based on the above definition, the concept of breakpoint was devised to obtain the time necessary to determine the MIC value. The break point values, wherein within 5 hrs 15 mins
for E. coli, 8 hrs 15 mins for S. aureus, 16 hrs 45 mins for
C. diphtheria (Table 2), the culture if used at an initial
inoculum density of 0.1 at 620 nm would be at its maximum growth phase determined using PowerWave XS spectrophotometer (Biotek Inc., USA) and within such time the effect of the preservative would be optimum as it would be in its log phase. When the liquid hand wash soap samples
were tested, using this concept, the breakpoint concept failed to achieve the MIC values comparable to that obtained by the traditional 24 hrs old MIC method such that values 16 times lower were attained at its breakpoint time (Table 3). In contrast the MBC values of both the methods were comparable with similar values attained at the breakpoint time and after 24 hrs of incubation suggesting that the incubation time can be reduced to the given breakpoints time period, as the MBC value, is the final concentration considered by many to establish the MIC value of the preservative as it is that concentration which kills at least 99.99% of the standardized bacterial inoculum [21].
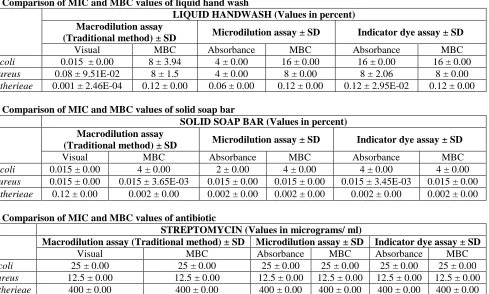
The MBC value is many times ignored in the industry as the Personal Care Products Council (formerly known as CTFA) [22] determined that mere inhibition of the organisms in the cosmetics is sufficient to pass the product and an absolute killing is not essential. But increasing resistance of the organisms against the preservatives and antimicrobials, make MBC values essential to prevent occurrences of spoilage of the cosmetics and toiletries The identical MBC values with an efficiency rate of 100% for the repeated sets confirm that irrespective of the methodology/ assay adapted, the MBC value remains a constant factor (Table 4- 6) and should be imperatively used to determine precisely the concentrations of the preservatives that are used to assess the efficacy of its presence in cosmetic formulations.
Determining the MIC value visually (as in Macro dilution – Serial dilution tube method) for soap samples can be an erroneous technique as the tubes have an inherent turbidity which makes it difficult to interpret the correct MIC value. This could be one of the reasons for the varied MIC values obtained by traditional method which was different from that obtained by Micro dilution assay and Indicator dye assay and also far away from the MBC value (Table 4- 6) which did not have reproducibility and often failed the repeatability criteria. Surprisingly, the micro dilution assay devised to overcome the disadvantages of the traditional method showed MIC values that did not match the MBC values such that the MBC values obtained were on an average two times the MIC values. This may be due to the fact that the Powerwave XS spectrophotometer reads the overall turbidity within the well such that, lower the dilution, more the sample amount and more is the inherent turbidity. As in such lower dilutions, the soap turbidity may conceal the optical density of the few organisms that may be present in the dilution well.
Such results are in accordance with those of Begot
et al [23] who determined the MIC values for bacteriocin
134 |
P a g e
study. An assay using an indicator dye in order to attain the MBC value directly from the microtiter plate, thereby reducing the two step system (agar spotting) was assessed using tetrazolium assay adopted from Drummond and Waigh [24] and McNicholl B et al [25] which allows the detection of microbial growth in extremely small volumes of solution in microtitre plates without the use of spectrophotometer. Using this modified assay system, especially with respect to the dilution protocols and a standard concentration of the bacterial suspension, a true MIC value was ascertained to determine the intensity of the red coloration which is proportional to the rate of respiration by the viable cells. Using such a technique, though a standard deviation was obtained, the MIC values were comparable to the MBC values. Additionally, the indicator dye assay worked best for the bacterial strain E. coli with maximum reproducibility, with results obtained within 5 minutes of addition of TTC. In contrast, the other bacterial strains C. diphtherieae and S. aureus showed varied results evident in the standard deviation observed for their MIC values. Additionally the formazan formation was irregular and faint, with it being precipitated in form of a button at the bottom of the well such that with the smaller number of cells it often resulted in a faint coloration which would get concealed in the inherent color of the soap resulting in a false negative result. Though MIC values for C. diphtheriae
were generally read after 12 hours after addition of the
tetrazoleum salt, 24 hour incubation at 37o C was necessary to measure an accurate MIC value of C. diphtheriae due to its large generation time. Barry and Braun [26] reported that the examination of MICs gave a discrepancy of 5.2% when measured by visual readings and considered this error rate as satisfactory for tests using serial two fold dilutions. Our results showing the variation observed within our test using the automated reader and its software thus can be considered reliable when compared to the visual reading as a low standard deviation with high accuracy is obtained.
Though the micro dilution assay was found to more accurate than the traditional serial dilution tube method, with no variation in repeatability and reproducibility, it failed to reduce the two step system and agar spotting was found to be essential in determining the MBC values for the soap samples. In contrast, though the indicator dye assay succeeded in reducing the two step system into a single system with prolonged incubation period it worked best with E. coli as variable results for S. aureus and C.
diphtheria test cultures were observed.
Thus in comparison with all the three methodology, the micro dilution assay performed with in microtitre plates is more accurate than the conventional macro dilution assay and maybe applicable for routine use as this system avoids transcriptional errors of laboratory data, improves media management and saves time besides running 96 combinations simultaneously.
Table 1. Standardization of the inoculum density to be used in MIC microtitre plate assay based on its lag time
O D620 Lag time (Time in Hours)
E. coli S. aureus C. diphtheria
0.01 5 hrs 36 mins 8 hrs 09 mins 12 hrs 56 mins 0.02 5 hrs 19 mins 7 hrs 53 mins 12 hrs 13 mins 0.03 4 hrs 59 mins 7 hrs 46 mins 11 hrs 52 mins 0.04 4 hrs 45 mins 7 hrs 37 mins 11 hrs 08 mins 0.05 4 hrs 33 min 7 hrs 33 mins 10 hrs 49 mins 0.06 4 hrs 21 min 7 hrs 29 mins 10 hrs 25 mins 0.07 4 hrs 11 min 7 hrs 23 mins 9 hrs 59 mins 0.08 3 hrs 58 mins 7 hrs 18 mins 9 hrs 34 mins 0.09 3 hrs 45 min 7 hrs 07 mins 8 hrs 53 mins 0.10 3hrs 34 mins 7 hrs 05 mins 8 hrs 10 mins
Table 2. Determination of the breakpoint time value
Optical Density @ 620 nm Lag time T at Vmax Viable count
E. coli 0.1 3hrs 34 mins 5 hrs 15 mins 3.27 x 10⁸
S. aureus 0.1 7 hrs 05 mins 8 hrs 15 mins 5.98 x 10⁸
C. diphtheria 0.1 8 hrs 10 mins 16 hrs 45 mins 2.66 x 10⁸
Table 3. Comparison of the MIC and MBC values at the breakpoint time value for liquid, soap formulation Assay at Breakpoint Time value
(values in percent)
Assay at 24 hours by traditional serial dilution tube method (values in percent)
MIC MBC MIC MBC
E. coli 0.25 16 4 16
S. aureus 0.5 8 8 8
135 |
P a g e
Table 4. Comparison of MIC and MBC values of liquid hand wash
LIQUID HANDWASH (Values in percent) Macrodilution assay
(Traditional method) ± SD Microdilution assay ± SD Indicator dye assay ± SD
Visual MBC Absorbance MBC Absorbance MBC
E coli 0.015 ± 0.00 8 ± 3.94 4 ± 0.00 16 ± 0.00 16 ± 0.00 16 ± 0.00
S aureus 0.08 ± 9.51E-02 8 ± 1.5 4 ± 0.00 8 ± 0.00 8 ± 2.06 8 ± 0.00
C diphtherieae 0.001 ± 2.46E-04 0.12 ± 0.00 0.06 ± 0.00 0.12 ± 0.00 0.12 ± 2.95E-02 0.12 ± 0.00
Table 5. Comparison of MIC and MBC values of solid soap bar
SOLID SOAP BAR (Values in percent) Macrodilution assay
(Traditional method) ± SD Microdilution assay ± SD Indicator dye assay ± SD
Visual MBC Absorbance MBC Absorbance MBC
E coli 0.015 ± 0.00 4 ± 0.00 2 ± 0.00 4 ± 0.00 4 ± 0.00 4 ± 0.00
S aureus 0.015 ± 0.00 0.015 ± 3.65E-03 0.015 ± 0.00 0.015 ± 0.00 0.015 ± 3.45E-03 0.015 ± 0.00
C diphtherieae 0.12 ± 0.00 0.002 ± 0.00 0.002 ± 0.00 0.002 ± 0.00 0.002 ± 0.00 0.002 ± 0.00
Table 6. Comparison of MIC and MBC values of antibiotic
STREPTOMYCIN (Values in micrograms/ ml)
Macrodilution assay (Traditional method) ± SD Microdilution assay ± SD Indicator dye assay ± SD
Visual MBC Absorbance MBC Absorbance MBC
E coli 25 ± 0.00 25 ± 0.00 25 ± 0.00 25 ± 0.00 25 ± 0.00 25 ± 0.00
S aureus 12.5 ± 0.00 12.5 ± 0.00 12.5 ± 0.00 12.5 ± 0.00 12.5 ± 0.00 12.5 ± 0.00
C diphtherieae 400 ± 0.00 400 ± 0.00 400 ± 0.00 400 ± 0.00 400 ± 0.00 400 ± 0.00
CONCLUSION
The amount of preservative added to the final formulation for cosmetics or toiletries is very crucial not only in terms of consumer’s health but also in terms of economics and cost effectiveness to the manufacturer. Choosing a correct assay to assess the MIC/ MBC of preservatives in formulation is important for generating a high quality reliable data with the highest accuracy, speed and efficiency, besides enabling the assessment of a larger number of formulations in a small period of time. The micro dilution method corrected for its dilution inaccuracies, especially in relation to the MIC determinations, as observed in macro dilution technique, enabled results to be comparable for the formulations for different bacterial strains. The method designed in the laboratory is easy to follow and accurate and maybe applicable for routine use. The indicator dye assay has shown promising results with high accuracy and a low discrepancy rate. This method needs further investigation in terms of reproducibility and
repeatability. The micro dilution method could be generally applied to determine the minimum amount of preservative/ antimicrobial which can be added to the formulation for safer and restricted use. The results of the study will contribute to the development of a standard method for determining the preservative susceptibilities of microorganisms and to subsequent delineation of microbiological breakpoints for individual microbial species.
ACKNOWLEDGMENTS
The authors are grateful to the Center Coordinator of Bhavan’s Research Center (Microbiology), Mumbai for providing the financial assistance and the infrastructural facilities to conduct this research work.
Declaration of Interest Statement
The authors declare no conflict of interest.
REFERENCES
1. Orth DS, Kabara JJ, Denyer SP, Tan SK. Cosmetic and Drug Microbiology, Informa Health Care USA, Inc., New York. Volume 31, 2006, 295-309.
2. Barel AO, Paye M, Maibach HI. Handbook of Cosmetic Science and Technology 2nd ed. Informa HealthCare USA, Inc., New York, 2005, 117-122.
3. Sox TE. Mechanisms of Actions of Preservatives, in: Cosmetic Microbiology: A Practical Handbook, CRC Press, LLC Florida, 1997, 163-173.
136 |
P a g e
5. Brannan D. Validation of Methods, in: Cosmetic Microbiology: A Practical Handbook, CRC Press, LLC Florida, 1997, 127-139.
6. Pharmacopeia, B (BP) XVIC. A 252: Appendix C, Efficacy of Antimicrobial preservation, 1998. 7. Geis P. Cosmetic Microbiology: A Practical Approach 2nd ed. Taylor & Francis, London, 2006, 111-147.
8. Barry AL, Amsterdam D, Coyle MB, Gerlach EH, Thornsberry C, Hawkinson RW. Simple Inoculum Standardizing Syetm for Antimicrobial Disk Susceptibility Tests. J. Clin. Microbiol. 10(6), 1979, 910-918.
9. Cruickshank R. Medical Microbiology: A guide to the laboratory Diagnosis and Control of Infections 11th ed. Churchill Livingstone, Teviot Place, Edinburgh, 1968, 888-907.
10. Koeth LM, King A, Knight H, May J, Miller LA, Phillips I, Poupard JA. Comparison of cation-adjusted Mueller–Hinton broth with Iso-Sensitest broth for the NCCLS broth microdilutionmethod. J. Antimicrob. Chemother., 46, 2000, 369-376. 11. Egervarn M, Lindmark H, Roos S, Huys G, Lindgren S. Effects of Inoculum Size and incubation time on broth microdilution
susceptibility testing of Lactic Acid Bacteria. Antimicrob. Agents and Chemother., 51, 2007, 394-396.
12. Blackall PJ, Eaves LE, Fegan M. Antimicrobial sensitivity testing of Australian isolates of Bordetella avium and the Bordetella avium like organism. Australian Veterinary Journal, 72(3), 1995, 97-100.
13. Garrod L, Lambert H, O’Grady F. Antibiotic and Chemotherapy 4th ed. Churchill Livingstone, Edinburgh-London, 1973, 2-83.
14. MacGowan AP, Wise R. Establishing MIC breakpoints and the interpretations of invitro susceptibility tests. J. Antimicrob.
Chemother., 48(S1), 2001, 17-28.
15. Kahlmeter G. An international survey of the antimicrobial susceptibility of pathogens from uncomplicated urinary tract infections: the ECO.SENS project. J. Antimicrob. Chemother., 51, 2003, 69-76.
16. Kahlmeter G, Brown DF, Goldstein FW, MacGowan AP, Mouton JW, Osterlund A, Rodloff A, SteinBakk M, Urbaskova P, Vatopoulos A. European harmonization of MIC breakpoints for antimicrobial susceptibility testing of bacteria, J. Antimicrob.
Chemother., 52, 2003, 145-148.
17. Riviere JE, Papich MG. Veterinary Pharmacology and Therapeutics 9th ed. John Willey & Sons, Iowa, 2009, 1203-1352. 18. Andrews JM. BSAC Standardised disc susceptibility testing method (Version 8). J. Antimicrob. Chemother., 64, 2009,
454-489.
19. Rex JH, Pfaller MA, Galgiani JN, Bartlett MS, Espinel-Ingroff A, Ghannoum MA, Lancaster M, Odds FC, Rinaldi MG, Walsh TJ, Barry AL. Development of Interpretive breakpoints for antifungal susceptibility testing: Conceptual Framework and Analysis of In vitro- In vivo Correlation data for Fluconazole, Itraconazole, and Candida infections. Subcommittee on Antifungal Susceptibility Testing of the National Committee for Clinical Laboratory Standards. Clin.
Infect. Dis., 24(2), 1997, 235-247.
20. King A. Recommendations for susceptibility tests on fastidious organisms and those requiring special handling. J.
Antimicrob. Chemother, 48(S1), 2001, 77-80.
21. Kalsoom F, Batool S, Shah N, Bakhsh MS, Jabeen F. Bactericidal activity of different soaps against Staphylococcus aureus.
Gomal Univ J Research, 22, 2006, 11-16.
22. Curry AS, McEwen JG, McEwen EN. Microbiology guidelines: CTFA technical guidelines. Cosmetic, Toiletry and Fragrance Association, CTFA, Washington DC, 2001.
23. Begot C, Desnier I, Daudin JD, Labadie JC, Lebert A. Recommendations for calculating growth parameters by optical density measurements. J Microbiol Meth, 25, 1996, 225-232.
24. Drummond AJ, Waigh RD. The development of microbiological methods for phytochemical screening. Recent Research
Development in Phytochemistry, 4, 2000, 143-152.
25. McNicholl BP, McGrath JW, Quinn JP. Development and application of a resazurin-based biomass activity test for activated sludge plant management. Water Research, 41(1), 2007, 127-133.